

The Broadcasting KPI Dashboard in Excel is a powerful and fully automated tool designed for TV networks, radio stations, digital broadcasters, and media agencies to monitor, analyze, and improve their key performance indicators (KPIs).
Whether you’re tracking audience engagement, ad revenue, content performance, or transmission efficiency, this Excel-based dashboard provides real-time insights into your broadcasting metrics, helping you make data-driven decisions and optimize performance.
With automated KPI calculations, dynamic trend analysis, and user-friendly input sheets, this broadcasting-specific KPI dashboard simplifies reporting, ensuring your broadcasting operations run smoothly and efficiently.
Key Features
✅ Instant Download – Start Tracking Broadcasting KPIs Immediately!
✅ Comprehensive Dashboard – Monitor MTD & YTD Performance
✅ Automated KPI Calculation – Compare Targets, Actuals & Previous Year Data
✅ Dynamic Visual Indicators – Highlight KPI Trends for Easy Analysis
✅ Excel-Based & User-Friendly – No Additional Software Required
What’s Inside?
This Broadcasting KPI Dashboard consists of seven essential worksheets, each tailored for performance tracking and strategic decision-making.
1. Home Sheet – The Navigation Hub
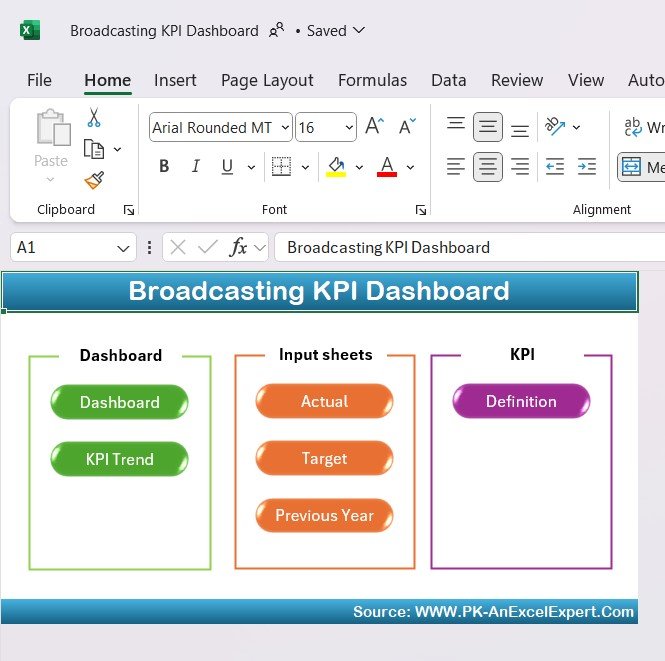
The Home Sheet acts as an interactive index, allowing quick navigation across the dashboard.
🖱️ Quick Navigation Buttons:
- Dashboard – Access the main KPI dashboard.
- KPI Trend – View monthly and yearly performance trends.
- Actual – Input real-time broadcasting performance data.
- Target – Set performance goals and benchmarks.
- Previous Year – Compare past and present broadcasting metrics.
- Definition – Understand each KPI with formula breakdowns.
📌 Why It’s Powerful?
✔ One-Click Access – Quickly jump between sections for efficiency.
✔ User-Friendly Interface – Easy to navigate, even for non-technical users.
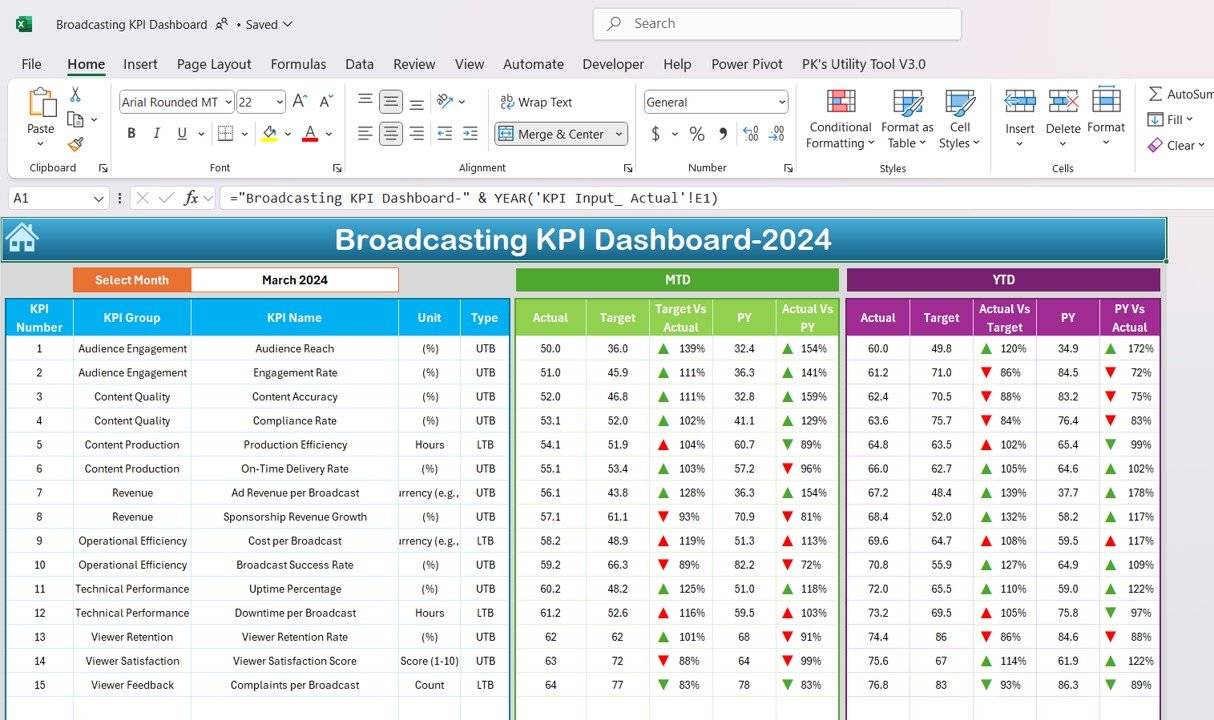
2. Dashboard Sheet – Complete Broadcasting Overview
The Dashboard Sheet is the heart of the Broadcasting KPI Dashboard, providing real-time insights into key performance indicators (KPIs).
📌 Key Features:
- Month-to-Date (MTD) & Year-to-Date (YTD) Metrics:
- View actual performance vs. targets vs. previous year data.
- Identify growth trends and performance gaps.
- Dynamic Month Selection:
- Select any month, and the dashboard updates automatically.
- Visual Indicators:
- Green & Red Arrows highlight positive and negative trends.
📊 Track Viewer Ratings, Ad Revenue & Content Performance!
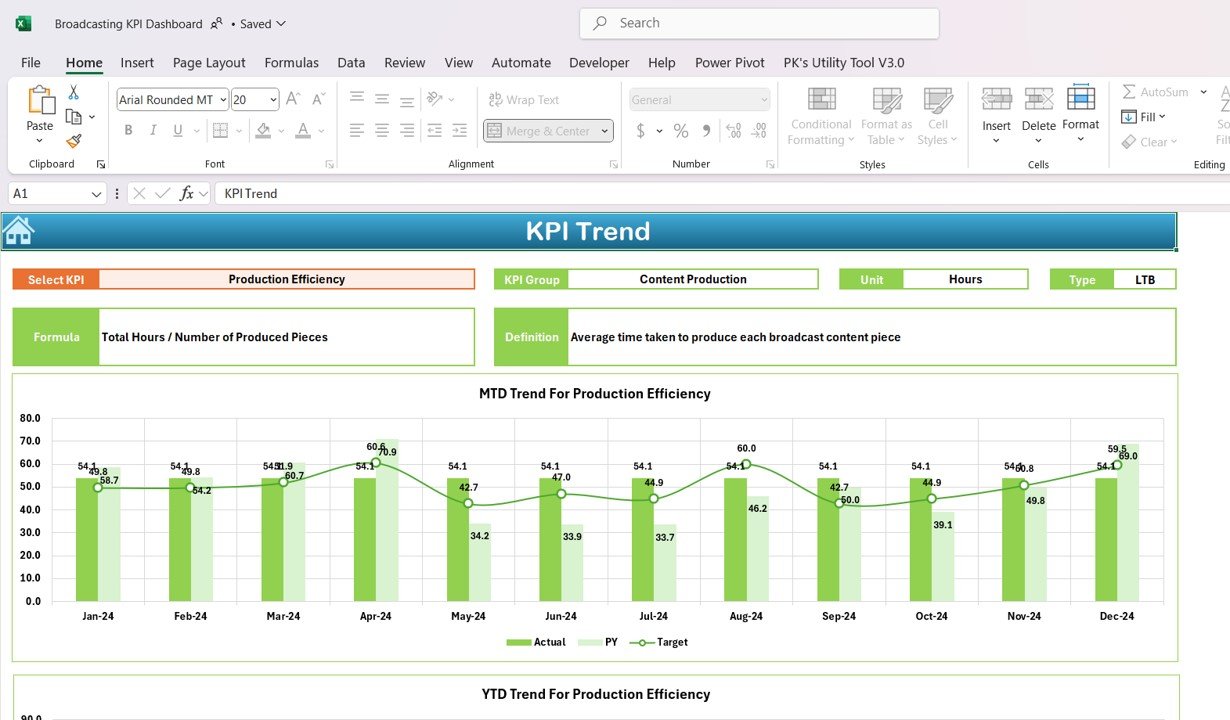
3. KPI Trend Sheet – In-Depth KPI Performance Analysis
This sheet provides detailed analysis of individual KPIs with interactive trend charts.
📌 Key Features:
- Dropdown Menu Selection:
- Choose a KPI and see its historical performance instantly.
- KPI Breakdown:
- KPI Group: Audience Metrics, Revenue, Broadcast Quality.
- Unit Type: Percentage, Viewership Numbers, Ad Revenue.
- Performance Type: Whether higher or lower values are better.
- Trend Charts:
- MTD & YTD performance comparison with actual, target & previous year data.
📊 Analyze Viewer Engagement, Ad Click-Through Rates & Signal Quality!
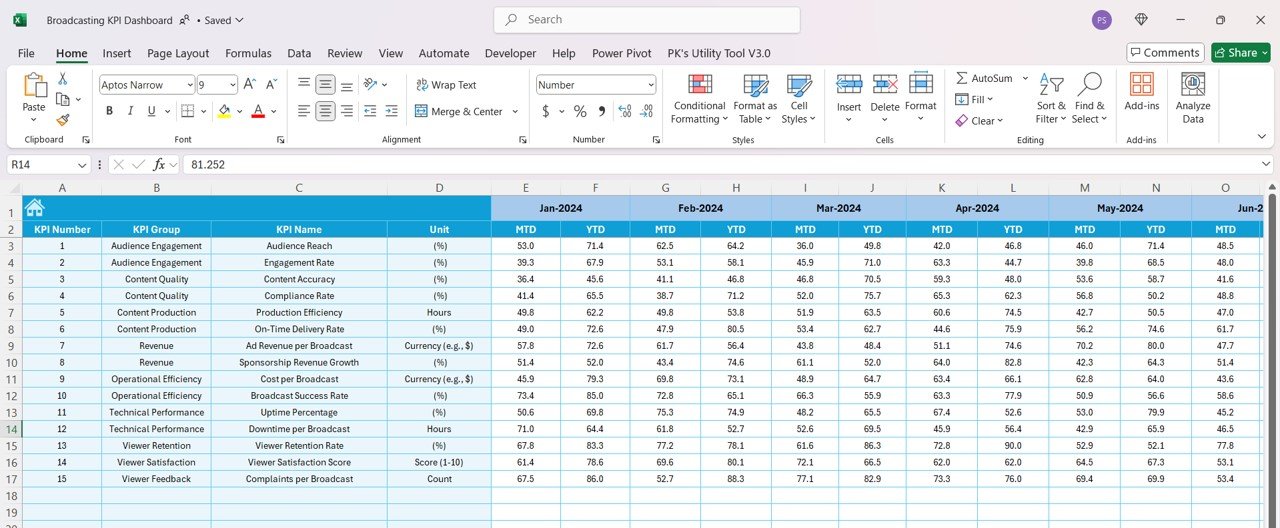
4. Actual Numbers Input Sheet – Simplified Data Entry
This sheet is dedicated to entering actual performance figures, making KPI tracking easy and efficient.
📌 Key Functionalities:
- Enter monthly and yearly performance data for each KPI.
- Adjust the starting month of the broadcast year in one step.
- Ensures consistent data tracking for ratings, transmission time, and revenue.
📊 Keep Broadcasting Performance on Track & Data Up-to-Date!
5. Target Sheet – Set Performance Goals
A successful broadcasting strategy relies on well-defined goals. This sheet helps set realistic targets for KPIs.
📌 Key Features:
✔ Define Monthly & Yearly Targets for each KPI.
✔ Compare Actual vs. Target Performance Easily.
✔ Helps in Ad Revenue Projections & Audience Growth Planning.
📊 Achieve Higher Engagement & Revenue Goals with Clear Benchmarks!
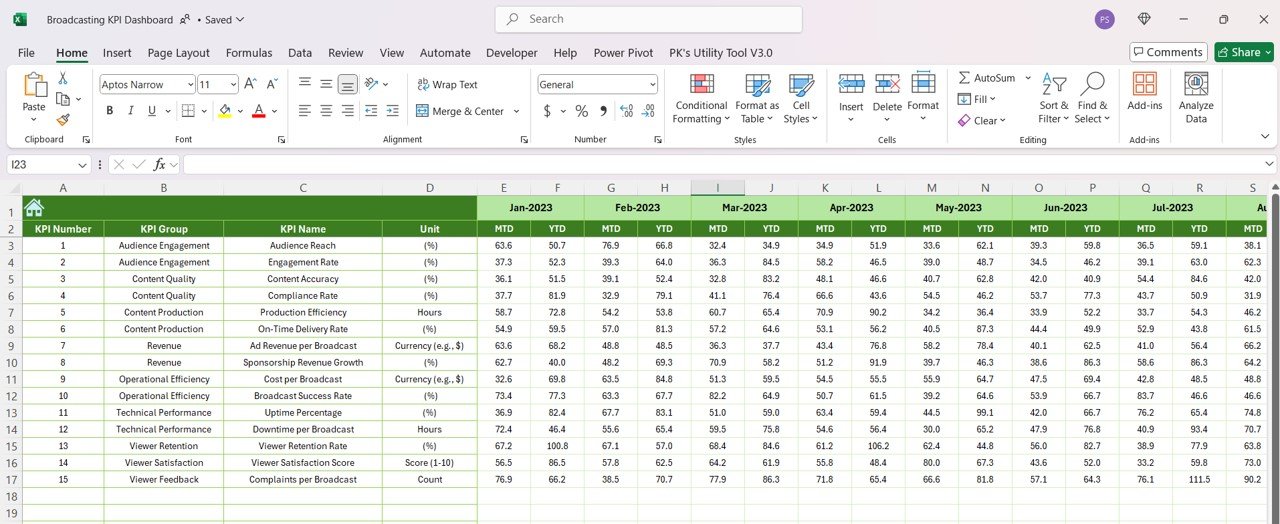
6. Previous Year Numbers Sheet – Historical Comparisons
Understanding past performance trends is crucial for future success.
📌 Key Features:
✔ Enter last year’s KPI data to compare with the current year.
✔ Identify growth, decline, and improvement areas.
✔ Measure progress over time for long-term strategic planning.
📊 Use Past Data to Optimize Future Broadcasting Strategies!
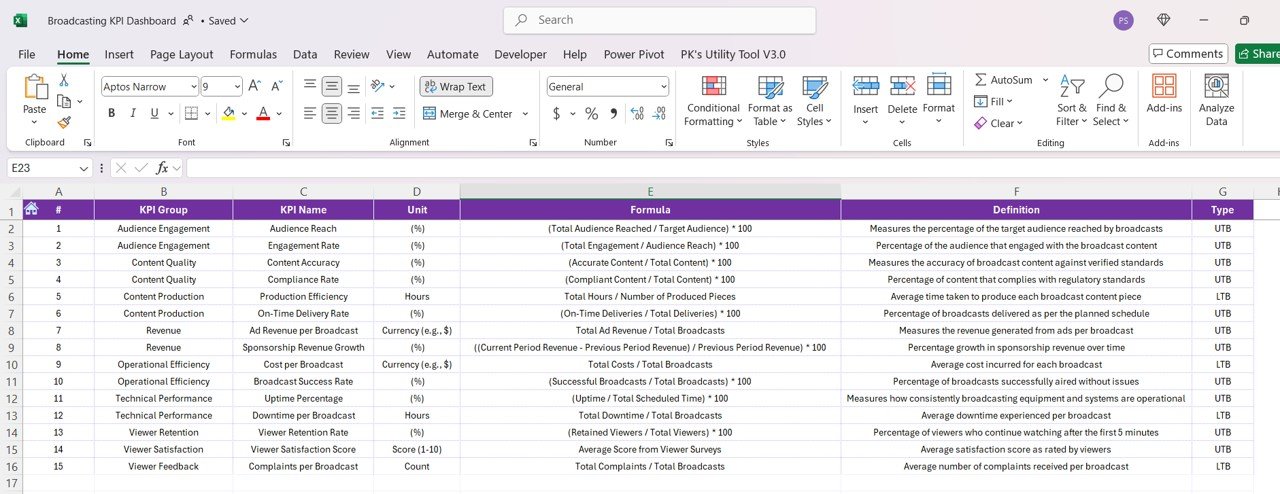
7. KPI Definition Sheet – Understand Every KPI
To ensure accurate tracking, the KPI Definition Sheet provides a detailed breakdown of each metric.
📌 Includes:
✔ KPI Name & Category – Audience, Revenue, Broadcast Efficiency.
✔ Unit of Measurement – Ratings, Time, Revenue, Percentages.
✔ Formula Used – Transparent calculation methods.
✔ Definition – Ensures clarity and standardization.
📊 Get a Clear Understanding of Every KPI & Improve Accuracy!
Why Choose This Broadcasting KPI Dashboard?
✅ Simplifies Broadcasting Performance Management: Track engagement, set revenue goals, and optimize content effectiveness.
✅ Data-Driven Decision Making: Real-time comparisons with targets and past performance.
✅ Interactive & Customizable: Adjust themes, highlight key KPIs, and personalize the dashboard.
✅ User-Friendly Interface: No advanced Excel knowledge required—just input your data and get insights!
✅ Boost Audience Engagement & Revenue: Helps broadcasters, production teams, and media strategists stay organized and make strategic decisions.
📢 Perfect for:
✔ TV Networks & Digital Broadcasters
✔ Radio Stations & Podcast Creators
✔ Media & Advertising Agencies
✔ Content Production & Streaming Platforms
✔ Broadcasting Operations & Strategic Planning Teams
🔥 Optimize Your Broadcasting Performance with Data-Driven Insights!
Get Your Copy Now!
The Broadcasting KPI Dashboard in Excel is an essential tool for broadcasters looking to streamline workflow, track key performance metrics, and enhance audience engagement.
Broadcasting KPI Dashboard in Excel
Track, Measure & Optimize Your Broadcasting Performance with Data-Driven Insights!
The Broadcasting KPI Dashboard in Excel is an essential tool designed for TV networks, radio stations, streaming platforms, and media agencies to monitor and optimize key performance indicators (KPIs) efficiently. This fully automated dashboard provides real-time insights into essential broadcasting metrics such as audience reach, ad revenue, broadcast efficiency, and content performance, enabling strategic decision-making and performance improvements.
With interactive dashboards, trend analysis, automated KPI calculations, and easy data input, this broadcasting-specific KPI dashboard helps teams streamline reporting and ensures that broadcasting operations run seamlessly and profitably.
Key Features
✅ Instant Download – Start Tracking Broadcasting KPIs Immediately!
✅ Comprehensive Dashboard – Monitor MTD & YTD Performance
✅ Automated KPI Calculation – Compare Targets, Actuals & Previous Year Data
✅ Dynamic Trend Analysis – Identify Audience & Revenue Growth Patterns
✅ Excel-Based & User-Friendly – No Additional Software Required
What’s Inside?
This Broadcasting KPI Dashboard consists of seven structured sheets, each crafted to enhance broadcast performance tracking and analysis.
1. Home Sheet – Your Navigation Hub
The Home Sheet serves as a quick-access index, allowing seamless navigation across the dashboard.
🖱️ Quick Navigation Buttons:
- Dashboard – View the main KPI performance summary.
- KPI Trend – Analyze KPI movements over time.
- Actual – Enter real-time broadcasting performance numbers.
- Target – Set monthly and yearly broadcasting performance benchmarks.
- Previous Year – Compare past and present broadcasting statistics.
- Definition – Understand KPI calculations and measurement units.
📌 Why It’s Useful?
✔ One-Click Access – Quickly navigate between sheets.
✔ User-Friendly Interface – Designed for intuitive use.
2. Dashboard Sheet – Performance Overview
The Dashboard Sheet is the core of the Broadcasting KPI Dashboard, offering an instant view of performance metrics.
📌 Key Features:
- Month-to-Date (MTD) & Year-to-Date (YTD) Metrics:
- Compare actual performance vs. targets vs. previous year data.
- Identify areas needing improvement.
- Dynamic Month Selection:
- Select a specific month in cell D3, and the dashboard updates automatically.
- Conditional Formatting for Easy Analysis:
- Green & Red Arrows show performance trends at a glance.
📊 Track Audience Growth, Ad Revenue & Broadcast Efficiency in Real Time!
3. KPI Trend Sheet – Analyze Performance Trends
This sheet provides a detailed, in-depth view of KPI trends, helping broadcasting teams make informed decisions.
📌 Key Features:
- KPI Selection (Dropdown in Cell C3): Choose a KPI and analyze trends instantly.
- Detailed KPI Breakdown:
- KPI Group: Audience, Revenue, Transmission Quality.
- Unit Type: Percentage, Viewership Count, Revenue, Hours.
- Performance Type: Whether higher or lower values are better.
- MTD & YTD Trend Charts:
- Displays Actual, Target, and Previous Year (PY) data in a visually intuitive format.
📊 Identify Content Popularity, Ad Revenue Fluctuations & Transmission Success Rates!
4. Actual Numbers Input Sheet – Track Real-Time Data
This sheet is dedicated to recording actual performance metrics for broadcasting KPIs.
📌 Key Functionalities:
✔ Manually enter MTD & YTD data for each KPI.
✔ Set the first month of the year in cell E1 for automatic adjustments.
✔ Ensures accurate tracking of live viewership, ad revenue, and content engagement.
📊 Keep Track of Audience Ratings & Ad Performance Efficiently!
5. Target Sheet – Set Realistic Goals
This sheet helps broadcasting teams establish clear and measurable KPI targets.
📌 Key Features:
✔ Define Monthly & Yearly KPI Targets.
✔ Compare Actual vs. Target Numbers in Real-Time.
✔ Helps in Setting Ad Revenue & Content Engagement Goals.
📊 Achieve Higher Viewer Retention & Optimized Revenue Generation!
6. Previous Year Numbers Sheet – Compare Historical Data
Analyzing past performance trends allows teams to strategize for future improvements.
📌 Key Features:
✔ Enter previous year’s data to compare with current performance.
✔ Identify strengths, weaknesses & growth opportunities.
✔ Assess improvements in broadcast engagement, revenue & audience growth.
📊 Use Historical Data to Drive Better Broadcasting Strategies!
7. KPI Definition Sheet – Understand Every KPI
To ensure accurate tracking, this sheet provides a detailed explanation of each KPI.
📌 Includes:
✔ KPI Name & Category: Audience Reach, Revenue, Content Performance.
✔ Unit of Measurement: Ratings, Revenue, Engagement Hours.
✔ Formula Used: Transparent KPI calculation breakdowns.
✔ Definition: Clear descriptions of each KPI.
📊 Eliminate Confusion & Standardize KPI Tracking for Broadcasting Teams!
Why Choose This Broadcasting KPI Dashboard?
✅ Optimized Broadcasting Management: Track engagement, ad revenue, and audience retention effectively.
✅ Fully Automated Excel Dashboard: Reduces manual work and ensures real-time performance tracking.
✅ Interactive & Customizable: Modify KPI formulas, adjust targets, and personalize dashboard layouts.
✅ User-Friendly Interface: No advanced Excel skills required—simply enter data & analyze insights.
✅ Maximize Audience Engagement & Revenue: Ideal for teams looking to enhance content performance & financial outcomes.
📢 Perfect for:
✔ TV Networks & Digital Broadcasters
✔ Radio Stations & Podcast Hosts
✔ Streaming Platforms & Content Creators
✔ Media & Advertising Agencies
✔ Broadcasting Operations & Strategic Planning Teams
🔥 Boost Your Broadcasting Success with Data-Driven Decision Making!
Click hare to read the Detailed blog post
Visit our YouTube channel to learn step-by-step video tutorials


Reviews
There are no reviews yet.