In today’s competitive business landscape, employee learning is business growth 💼. Organizations that track, measure, and optimize their corporate training programs achieve higher productivity, stronger retention, and measurable ROI. The Corporate Training KPI Dashboard in Excel is a ready-to-use, fully interactive tool that transforms your HR and L&D data into visual insights — empowering data-driven decisions for workforce development.
Built entirely in Excel, this dashboard simplifies performance tracking with automated formulas, dynamic visuals, and user-friendly navigation. Whether you’re measuring training completion, satisfaction, or cost efficiency, it’s the perfect solution for HR leaders and L&D professionals aiming to link learning outcomes directly to business success 🚀.
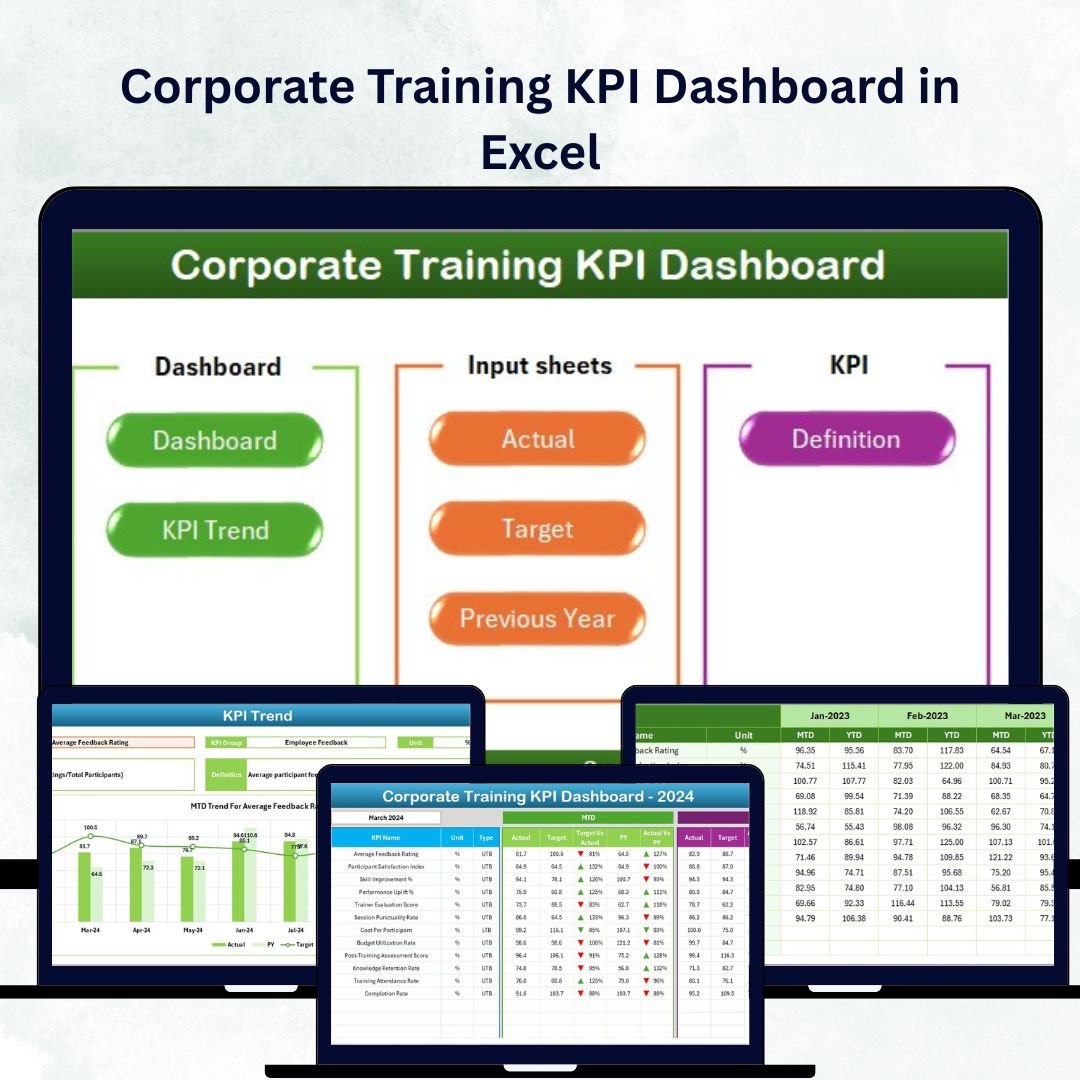
⚙️ Key Features of the Corporate Training KPI Dashboard in Excel
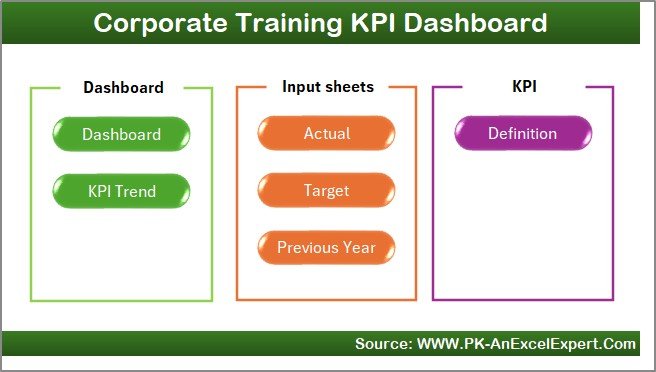
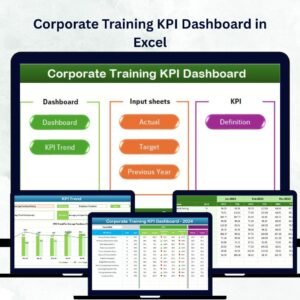
📊 7 Dedicated Sheets – Home, Dashboard, KPI Trend, Input, Target, Previous Year, KPI Definition.
🎯 MTD & YTD Comparisons – Track Month-to-Date and Year-to-Date progress instantly.
📈 Conditional Formatting Indicators – Green ⬆ for growth, Red ⬇ for decline.
💾 Auto-Updating Data Engine – Input once and see real-time visual updates.
🧠 Actual vs Target vs Previous Year – Three-way performance view for clear insight.
📉 Interactive KPI Trends – Visualize learning impact across months.
💡 Fully Customizable Template – Add or edit KPIs as your training program evolves.
💰 Cost-Effective Analytics – Enterprise-level reporting without software costs.
📦 What’s Inside the Dashboard
1️⃣ Home Sheet – Quick Navigation Hub
Your central control panel 🏠. Six interactive buttons allow you to jump between Dashboard, KPI Trend, Input Data, Target, Previous Year, and Definition sheets with one click. Ideal for users of all Excel skill levels.
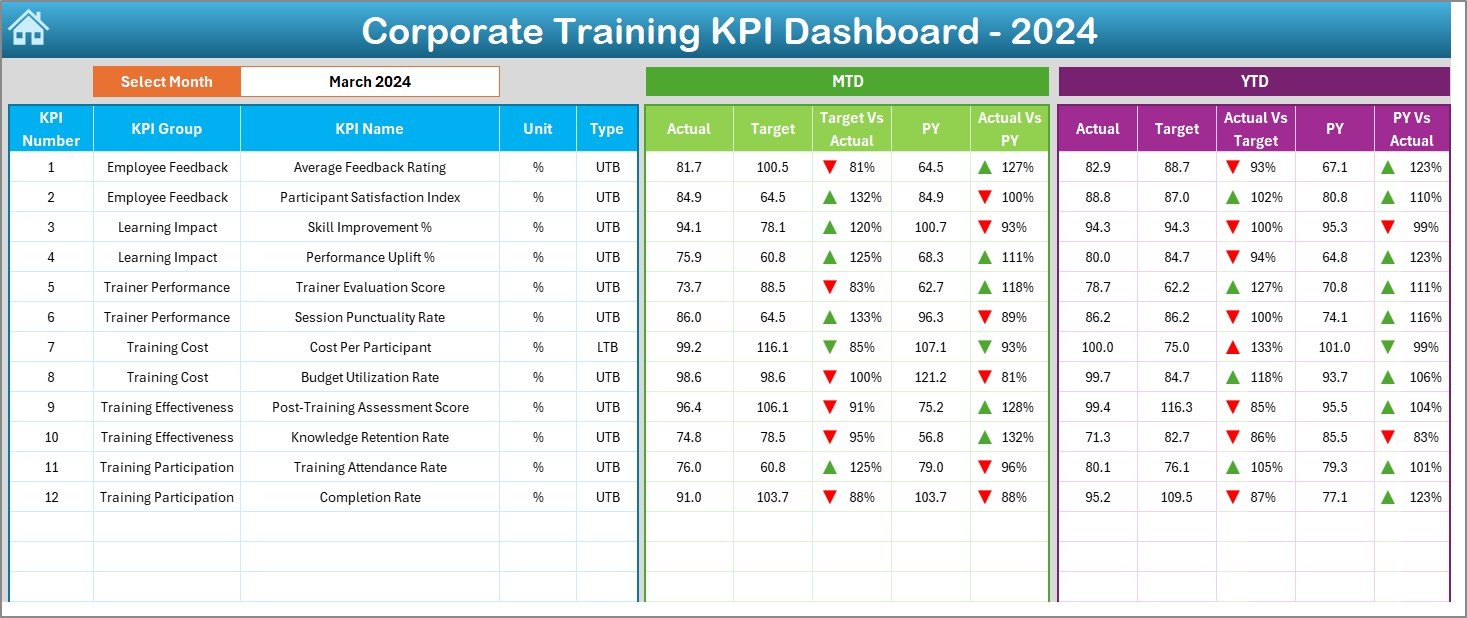
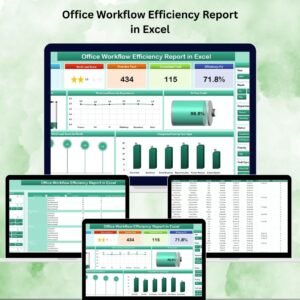
2️⃣ Dashboard Sheet – Your Performance Snapshot
This is the heart of the dashboard. Select any month (cell D3) to see automated updates for all KPIs.
-
MTD & YTD Actual vs Target visuals.
-
Arrows showing improvement or decline.
-
KPIs like Training Completion Rate, Average Cost per Trainee, Satisfaction Score.
Perfect for management reviews and monthly performance meetings.
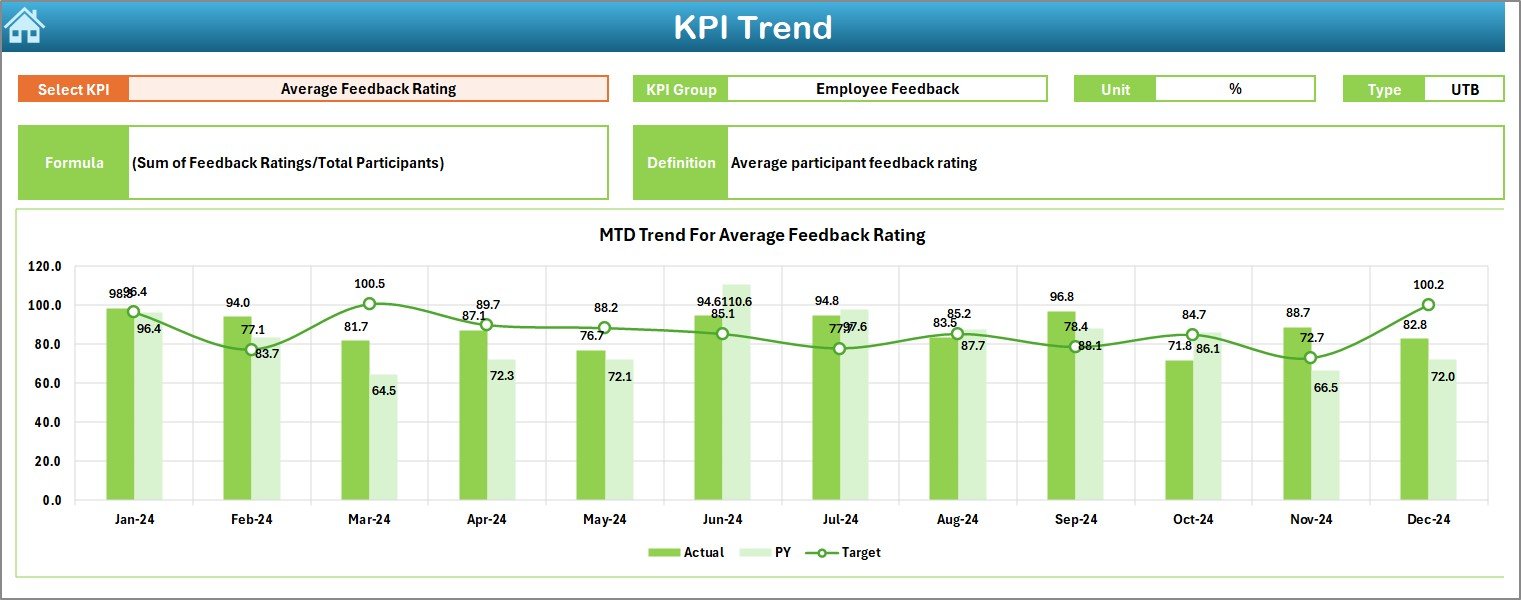
3️⃣ KPI Trend Sheet – Analyze Long-Term Progress
Choose any KPI (cell C3) to see its formula, group, type (UTB/LTB), and definition.
Charts visualize Actual vs Target vs Previous Year for MTD and YTD trends, revealing growth patterns and areas for improvement 📈.
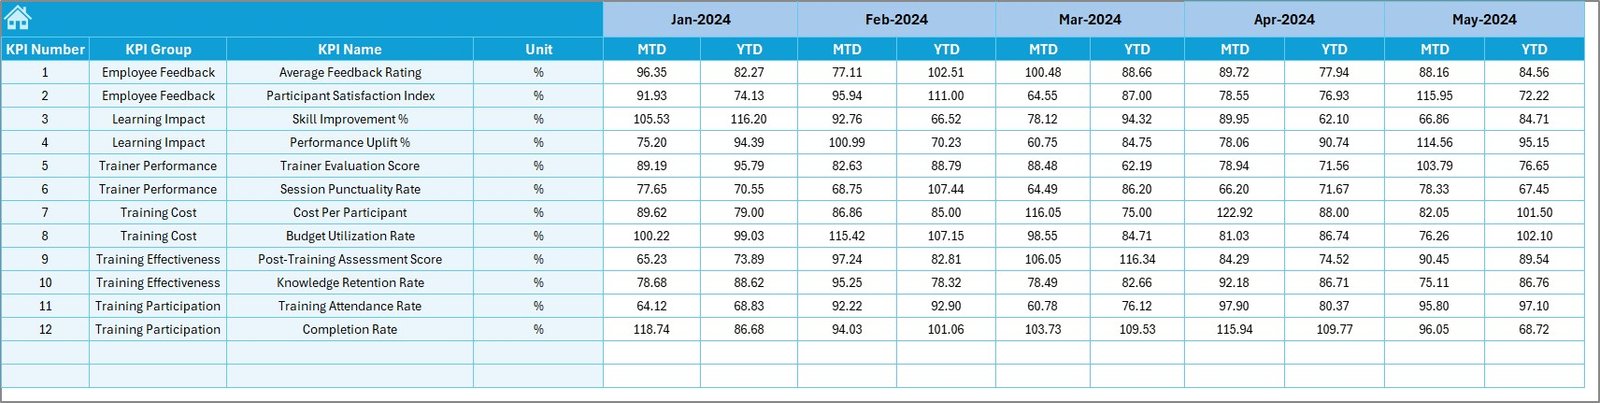
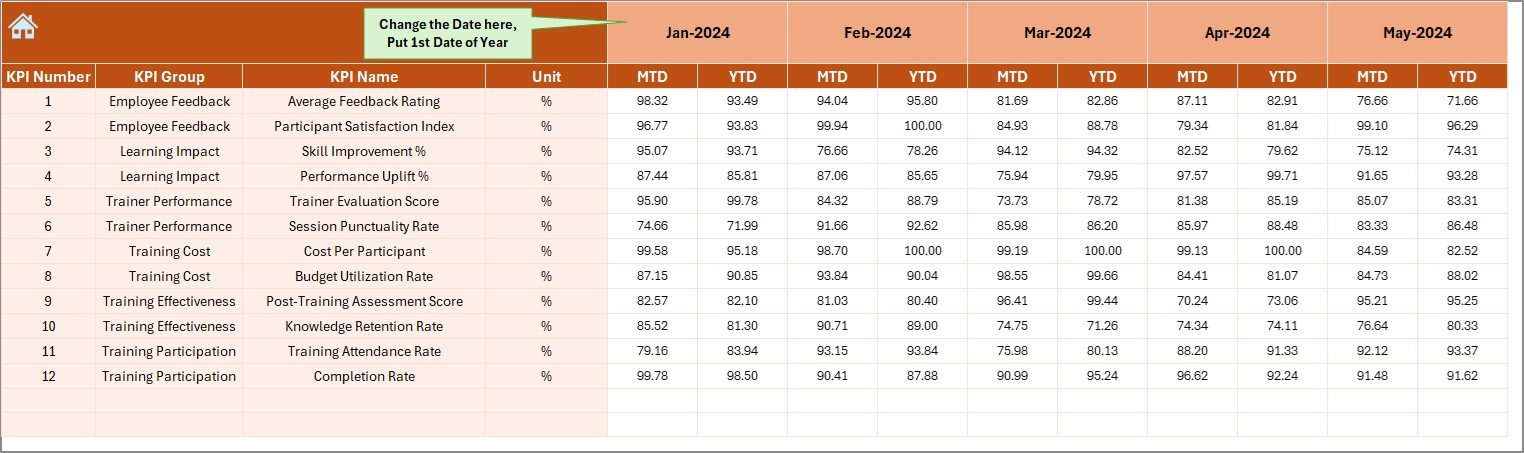
4️⃣ Input Sheet – Data Entry Made Simple
Enter monthly Actual performance data (Attendance, Cost, Scores).
Set the start month in cell E1 and watch all visuals update automatically ⚙️.
5️⃣ Target Sheet – Set Clear Goals
Record your expected MTD/YTD targets for KPIs like Completion Rate, Retention %, Cost per Trainee, and Satisfaction Score. Targets drive meaningful comparison and continuous improvement.
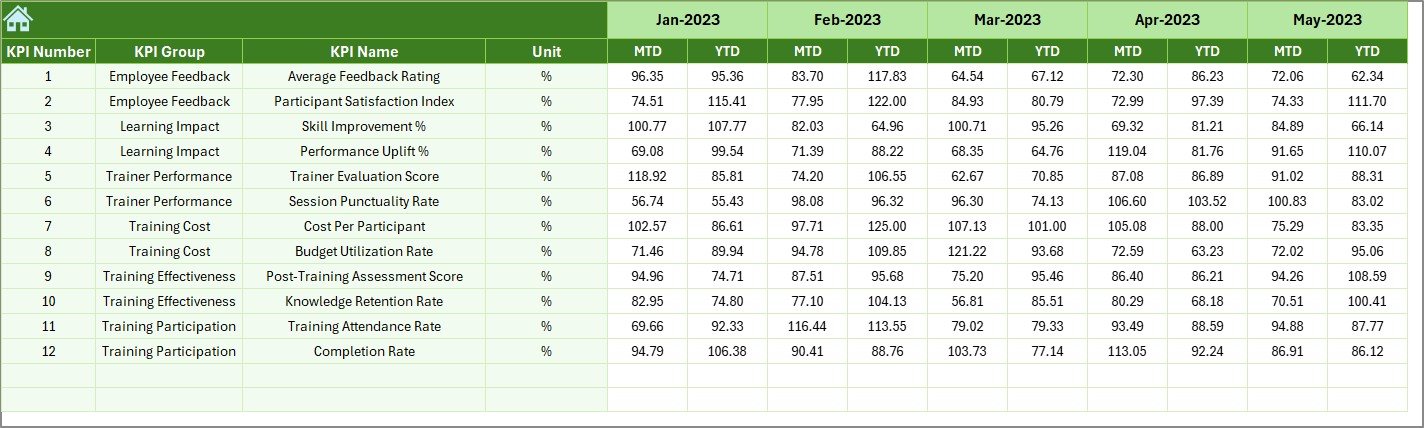
6️⃣ Previous Year Sheet – Benchmark for Growth
Input last year’s KPI results to compare progress year-over-year 📆. Perfect for identifying long-term training ROI.
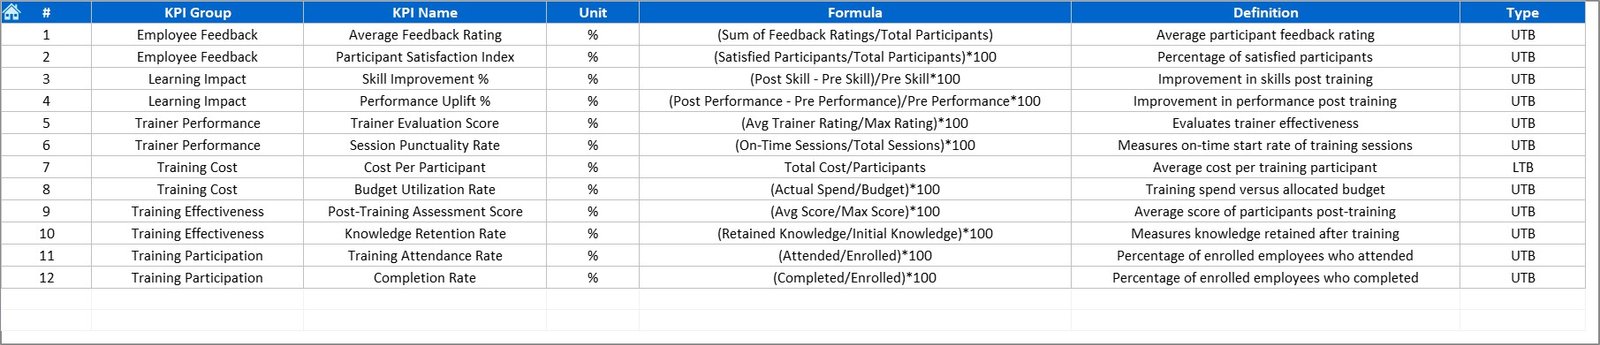
7️⃣ KPI Definition Sheet – Maintain Clarity & Consistency
Document each metric with its Group, Unit, Formula, and Definition. Ensures everyone interprets KPIs accurately and standardizes reporting across teams.
🧩 Example KPIs Included
🎓 Learning Effectiveness – Average Test Score %, Knowledge Retention %, Skill Improvement %.
📅 Training Operations – Programs Conducted, Completion Rate %, Training Hours per Employee.
💰 Financial Metrics – Cost per Trainee, Budget Utilization %, ROI on Training %.
😊 Engagement & Satisfaction – Satisfaction Score, Attendance Rate %, Feedback Rating (1–10).
This diverse mix of KPIs gives a 360° view of training performance and organizational impact.
🌟 Advantages of Using the Corporate Training KPI Dashboard in Excel
✅ Instant Insights – Track training performance in real time.
✅ Smarter Decisions – Use Actual vs Target vs Previous Year data for evidence-based choices.
✅ Automation – Excel handles calculations & conditional formatting automatically.
✅ Central Data Repository – All KPI data stored in one file.
✅ Customizable Design – Adapt KPIs to your training model.
✅ Budget-Friendly Tool – Powerful analytics without license fees.
💡 Best Practices for Effective Use
-
🎯 Align KPIs with business and learning objectives.
-
📊 Focus on quality, not quantity of metrics.
-
🗓️ Update data monthly for accurate trends.
-
🟢 Leverage conditional formatting for visual alerts.
-
🤝 Collaborate across HR and Finance teams for complete insight.
-
🔁 Review and refine KPIs as training programs evolve.
Follow these guidelines to turn your dashboard into a strategic decision-making system for L&D success.


Reviews
There are no reviews yet.