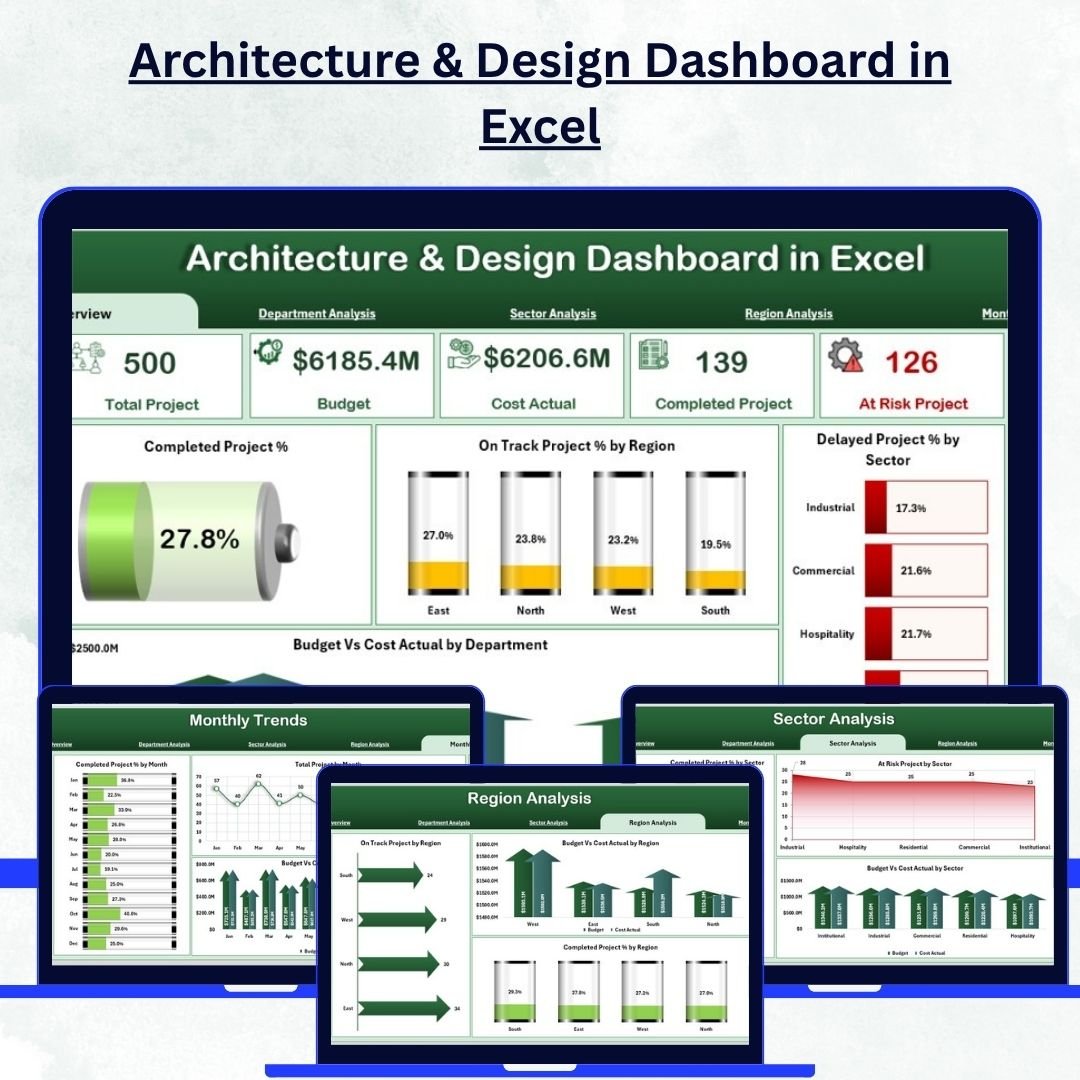
In today’s fast-paced world of design and innovation, every architecture and design firm needs a smart way to manage projects, track performance, and stay on budget. That’s where the Architecture & Design Dashboard in Excel comes in — your all-in-one analytical tool to visualize, analyze, and improve your project performance with just a few clicks.
This ready-to-use Excel dashboard transforms scattered data into clear insights using colorful charts, interactive slicers, and performance KPIs. Whether you’re managing commercial, residential, or government projects, this dashboard helps you make data-driven decisions with confidence.
✨ Key Features of the Architecture & Design Dashboard in Excel
📊 Visual Performance Tracking: Monitor completion rates, on-track projects, and delays through interactive visuals.
📂 5 Dedicated Analytical Pages: Includes Overview, Department Analysis, Sector Analysis, Region Analysis, and Monthly Trends — each designed for specific insights.
⚙️ Dynamic Page Navigator: Quickly switch between dashboard sections with a single click from the sidebar menu.
💰 Budget vs Actual Comparison: Instantly identify cost overruns and financial efficiency across departments, sectors, and regions.
🎨 Clean & Interactive Design: Simplified visuals, conditional formatting, and color-coded indicators (green, yellow, red) for quick interpretation.
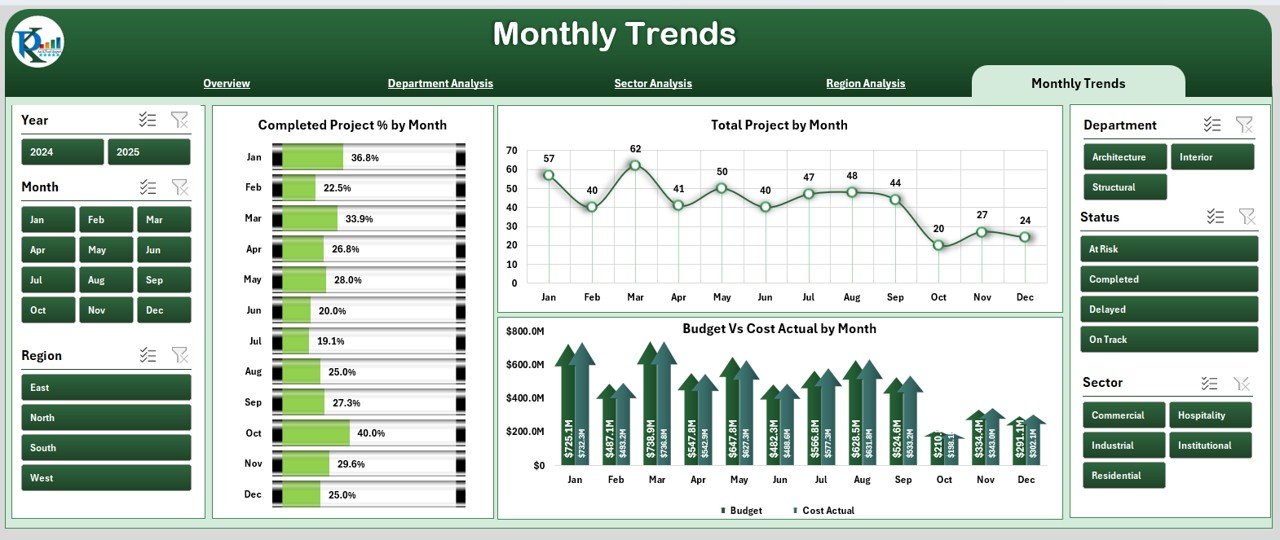
📅 Monthly & YTD Tracking: Evaluate short-term and yearly performance trends.
📈 Departmental & Regional Insights: Understand which teams and regions deliver projects on time and within budget.
🔒 Support Sheet for Data Management: Store master lists, validation items, and formulas safely in the backend sheet.
📘 What’s Inside the Architecture & Design Dashboard in Excel
This powerful Excel template is built with six sheet tabs to provide complete project visibility:
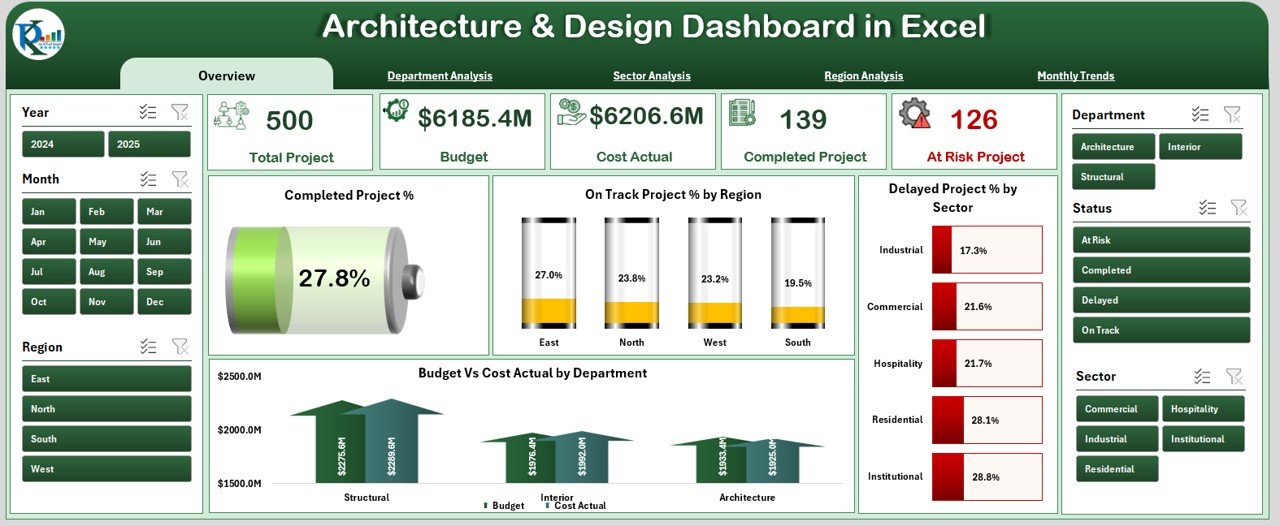
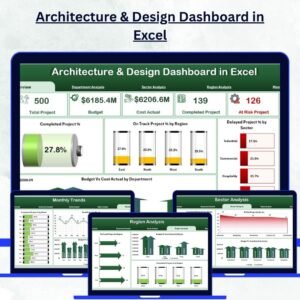
1️⃣ Overview Page – The control center showing project completion %, on-track status by region, delays by sector, and cost comparisons.
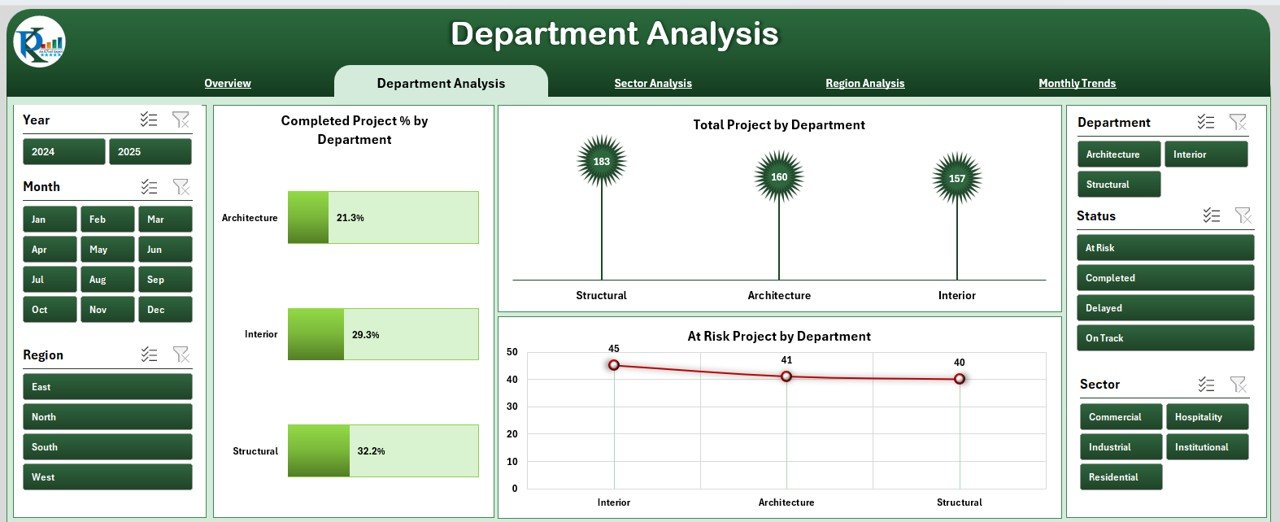
2️⃣ Department Analysis – Evaluate performance, workload, and risks per department using detailed charts.
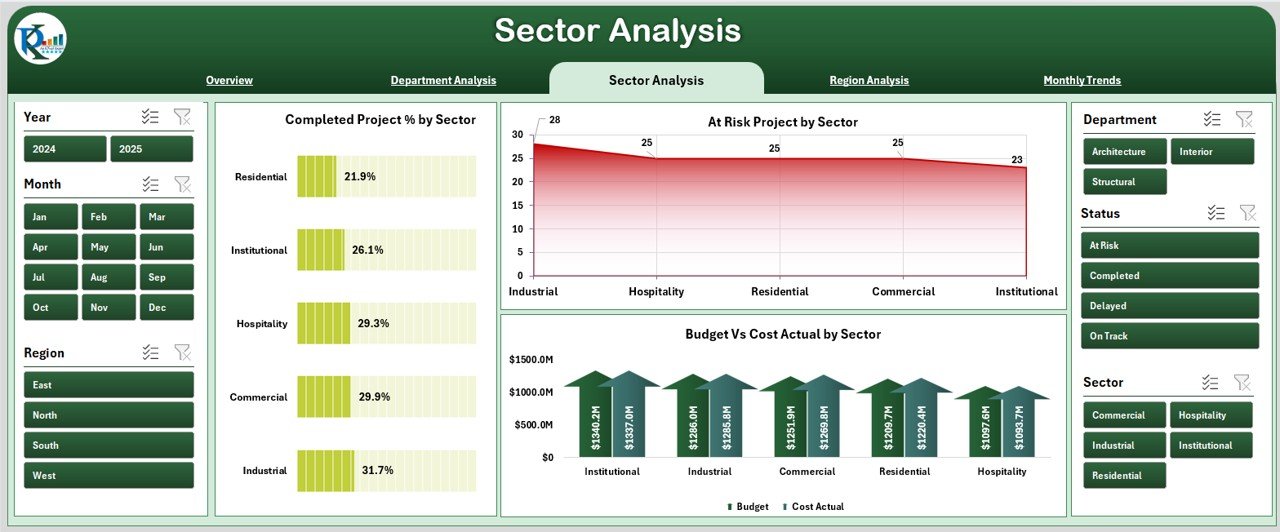
3️⃣ Sector Analysis – Compare efficiency across residential, commercial, industrial, and government projects.
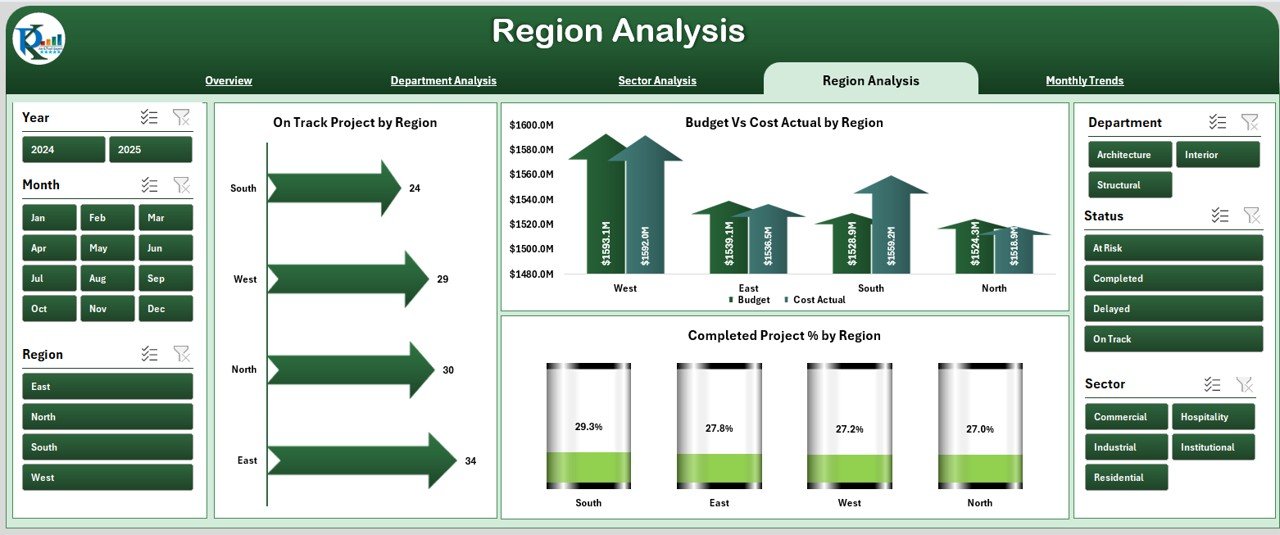
4️⃣ Region Analysis – Review regional performance and identify areas needing support.
5️⃣ Monthly Trends – Track performance patterns over time to plan future projects effectively.
6️⃣ Support Sheet – Manage backend data, drop-down lists, and formulas securely.
Everything you need is structured, automated, and formatted for immediate use.
⚡ How to Use the Architecture & Design Dashboard in Excel
🟢 Step 1: Enter all your project data — budgets, actual costs, and project details — in the Support Sheet.
🟢 Step 2: Refresh the pivot tables to update visuals instantly.
🟢 Step 3: Use slicers to filter data by month, department, region, or sector.
🟢 Step 4: Review performance cards and charts to identify areas of concern.
🟢 Step 5: Take informed actions to optimize costs, improve timelines, and balance workload.
No coding or technical skills are required — just plug in your data and start analyzing!
👥 Who Can Benefit from This Architecture & Design Dashboard in Excel
🏢 Architecture Firms: Manage multiple design projects and budgets effortlessly.
🎨 Design Studios: Monitor project delivery and resource efficiency.
📊 Project Managers: Identify delays, track department-level KPIs, and optimize workload.
💼 Finance Teams: Compare planned vs actual costs to maintain financial control.
🧑💼 Executives & Decision Makers: Get a bird’s-eye view of overall business performance in one visual dashboard.
📈 Consultants & Analysts: Use real data visualization to prepare reports for clients or management.
This dashboard is perfect for teams that want clarity, transparency, and faster decision-making without investing in expensive project management tools.
🔗 Click here to read the Detailed Blog Post
🎥 Visit our YouTube channel to learn step-by-step video tutorials
🔗 YouTube.com/@PKAnExcelExpert


Reviews
There are no reviews yet.