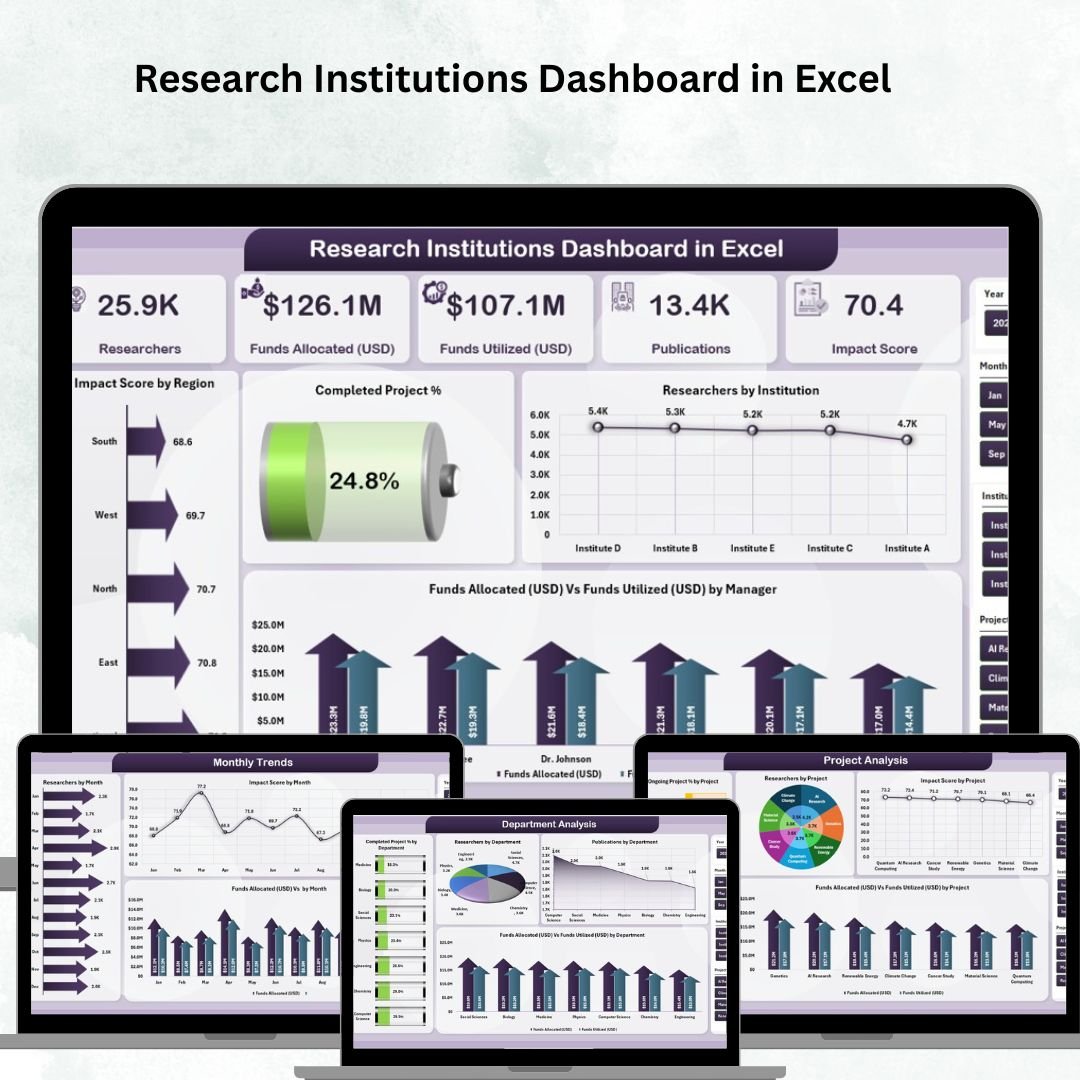
Research institutions drive innovation, global problem-solving, and academic excellence. Yet, managing projects, departments, researchers, and funding sources can quickly become overwhelming without a structured reporting system. That’s where the Research Institutions Dashboard in Excel comes in — a powerful, ready-to-use template that transforms raw research data into clear, actionable insights.
Unlike expensive software that demands technical expertise, this Excel-based dashboard is affordable, user-friendly, and flexible, making it the perfect solution for institutions seeking performance visibility and accountability.
🔑 Key Features of Research Institutions Dashboard in Excel
-
📊 Five Analytical Pages – Overview, Department Analysis, Project Analysis, Funding Source Analysis, and Monthly Trends.
-
🎯 Impact Tracking – Evaluate research output, completion %, and impact scores.
-
💰 Funding Efficiency – Compare Funds Allocated vs. Funds Utilized across managers, departments, and sources.
-
👨🏫 Departmental Insights – Track research productivity, publications, and performance at the department level.
-
🧪 Project-Level Analysis – Monitor ongoing projects, impact scores, and budget utilization.
-
🌍 Regional Comparisons – Understand impact by institution or region.
-
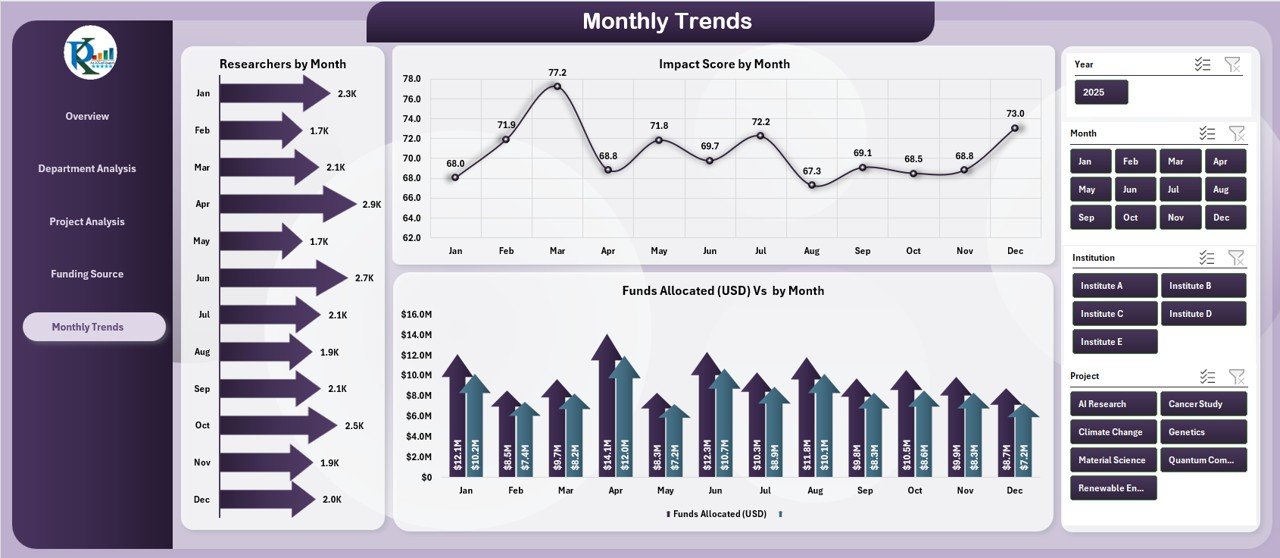
📈 Monthly Trends – Visualize research growth, funding use, and progress over time.
-
📂 Support Sheet – Keeps dropdowns, references, and lists organized for consistency.
📂 What’s Inside the Research Institutions Dashboard
This dashboard is structured into five powerful analytical pages plus a support sheet:
-
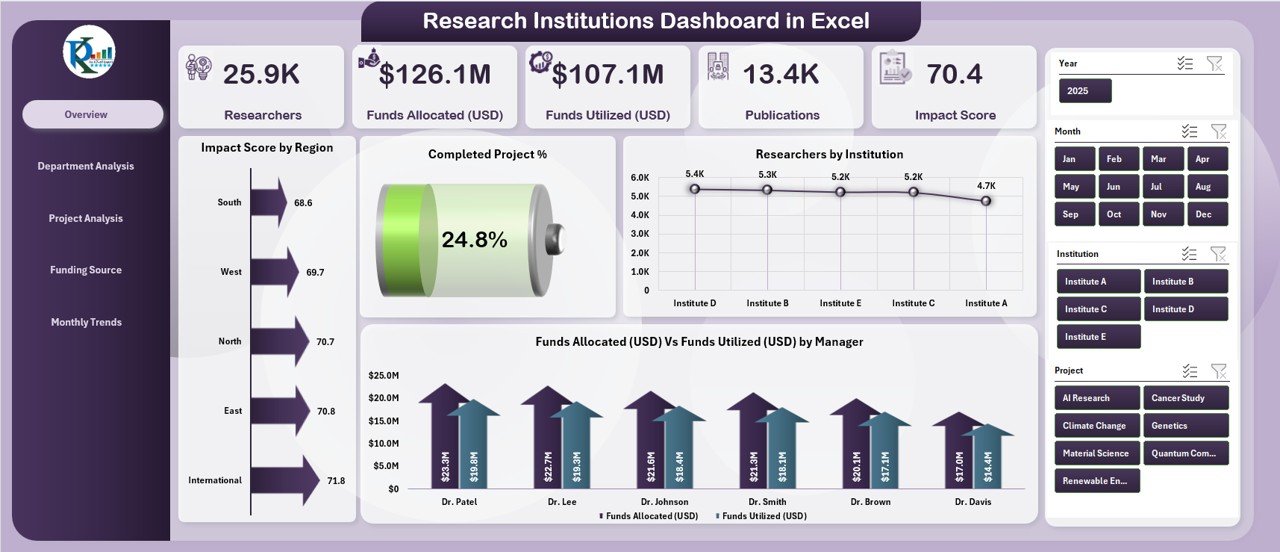
Overview Page
-
Impact Score by Region
-
Completed Project %
-
Researchers by Institution
-
Funds Allocated vs. Funds Utilized by Manager
-
-
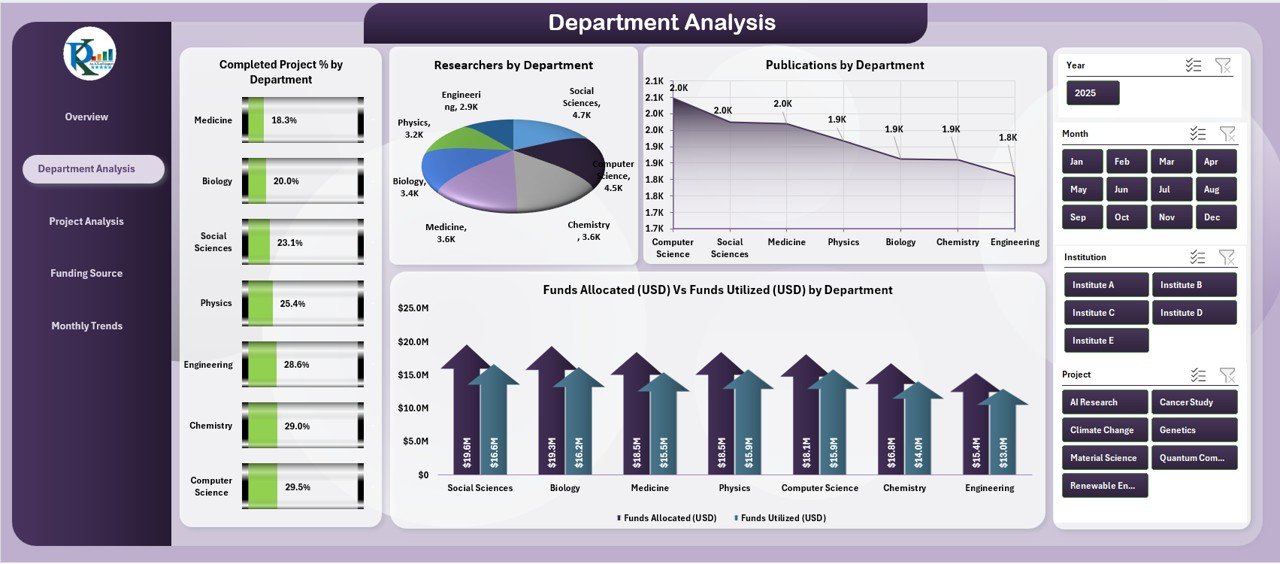
Department Analysis
-
Completed Project % by Department
-
Research Output & Publications
-
Funds Allocation vs. Utilization by Department
-
-
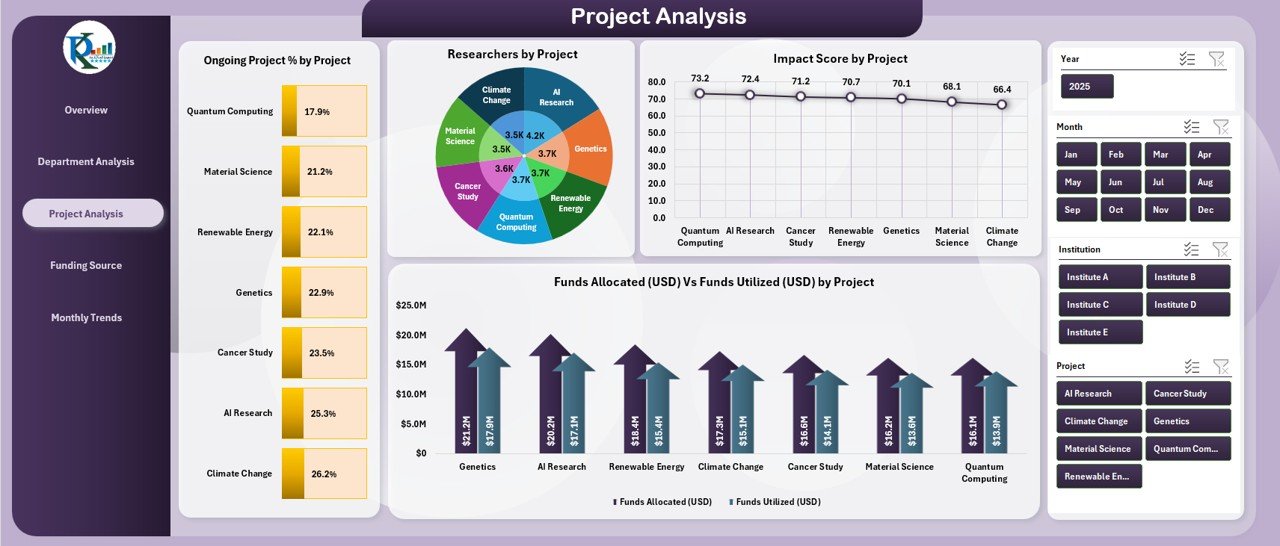
Project Analysis
-
Ongoing Project % by Project
-
Research Output & Impact Score
-
Funds Allocation vs. Utilization by Project
-
-
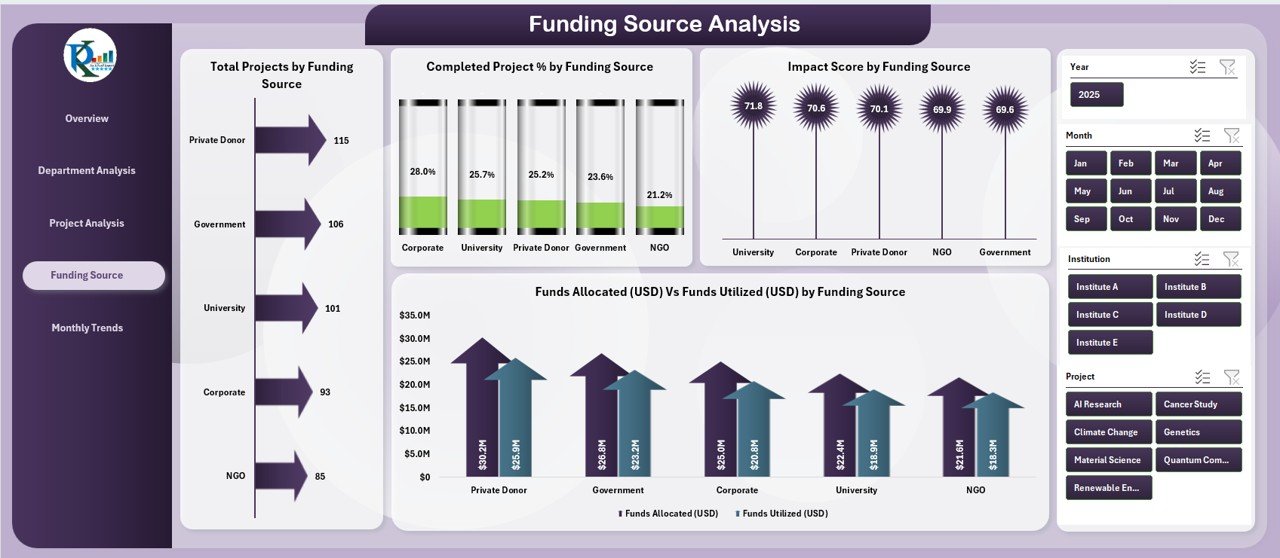
Funding Source Analysis
-
Total Projects by Funding Source
-
Completion % by Funding Source
-
Impact Score by Source
-
Financial discipline across sources
-
-
Monthly Trends
-
Research Output by Month
-
Monthly Impact Score
-
Monthly Funds Allocated vs. Utilized
-
-
Support Sheet
-
Stores reference data and dropdowns
-
Ensures accuracy and easy customization
-
🛠 How to Use the Research Institutions Dashboard
-
Collect Data – Enter researcher, project, funding, and departmental data into structured tables.
-
Update Monthly – Refresh with the latest progress, budgets, and completions.
-
Use Slicers & Filters – Drill into projects, funding sources, or departments.
-
Analyze Trends – Detect patterns in research impact and fund utilization.
-
Make Decisions – Use insights for better allocation, planning, and reporting.
👥 Who Can Benefit from This Dashboard?
-
🏛 Research Administrators – Track overall institutional performance.
-
👩🔬 Project Managers – Monitor project-specific progress and funding.
-
💰 Funding Agencies – Assess outcomes from allocated resources.
-
📚 Academic Leaders – Evaluate departmental productivity and research output.
-
🌍 Policy Makers – Gain insights into regional and institutional impact.
✅ Why Choose This Dashboard?
This Excel dashboard is visual, interactive, and easy-to-use. It saves time, centralizes research data, and provides clarity for leadership and funding bodies. From tracking progress to measuring impact, it’s a strategic tool for transparency, accountability, and smarter decisions.
Click here to read the Detailed blog post
👉 Visit our YouTube channel to learn step-by-step video tutorials


Reviews
There are no reviews yet.