Maintaining a safe and secure office environment is no longer optional—it’s essential. With rising risks, organizations need real-time visibility into incidents, response times, and team efficiency. That’s where the Office Security Incident Dashboard in Power BI comes in. This powerful, ready-to-use dashboard empowers security teams, facility managers, and executives to monitor, analyze, and manage incidents with ease.
Instead of drowning in spreadsheets or delayed reports, your team gets a live, interactive view of office security metrics—helping you prevent risks, resolve incidents faster, and build a culture of safety.
✨ Key Features of the Office Security Incident Dashboard
-
📌 Centralized Incident Tracking: Consolidate all reported incidents into one interactive dashboard.
-
⚡ Real-Time Insights: See incidents as they happen and track metrics instantly.
-
🚨 Severity Analysis: Monitor high-severity cases, escalation rates, and resolution efficiency.
-
🌍 Location-Based Tracking: Identify high-risk areas and trends by office location.
-
📈 Performance Monitoring: Track response times and closure rates across your security team.
-
🎯 Customizable Filters: Drill down by incident type, location, severity, or reporter for tailored insights.
📂 What’s Inside the Office Security Incident Dashboard
The dashboard includes multiple Power BI pages, each designed for actionable insights:
-
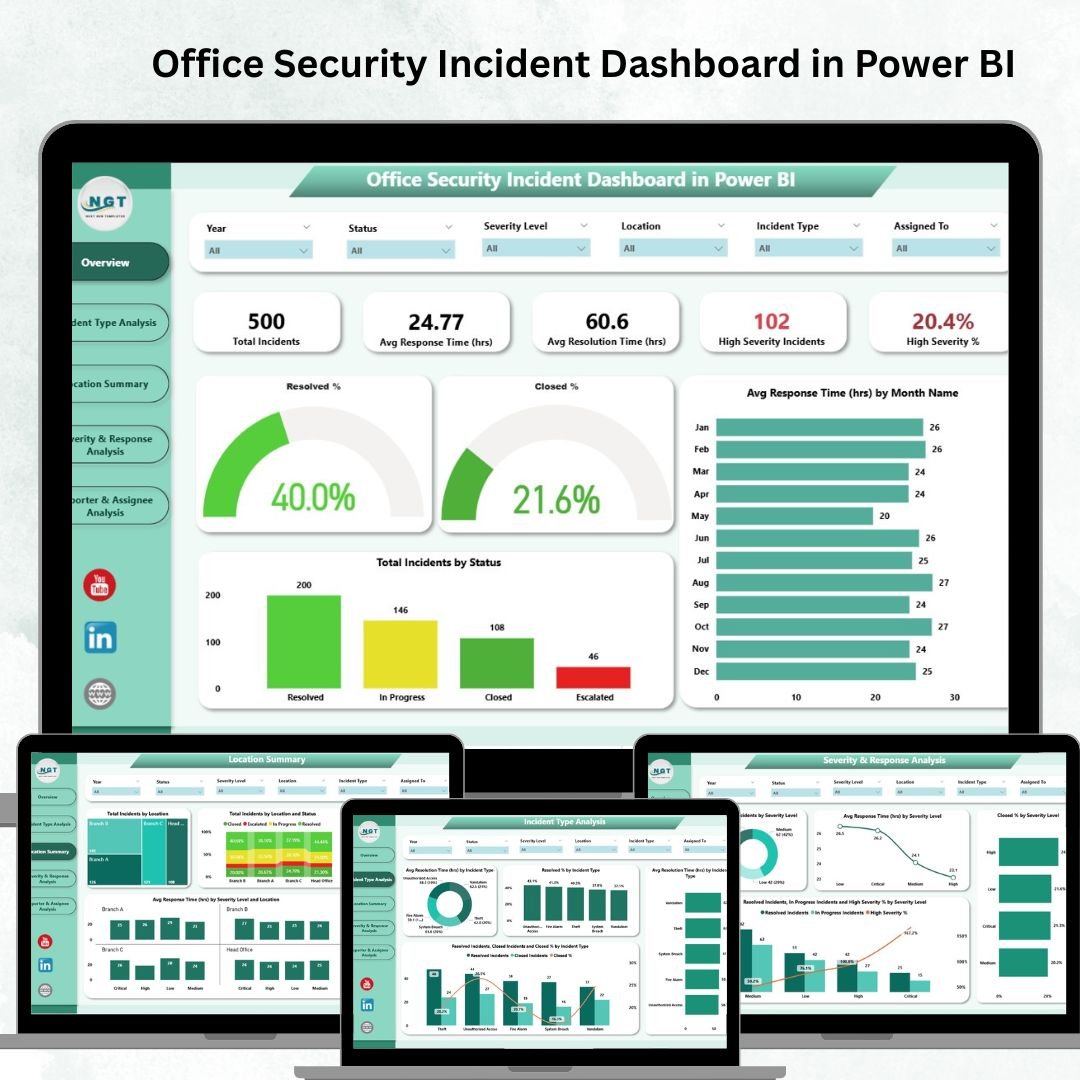
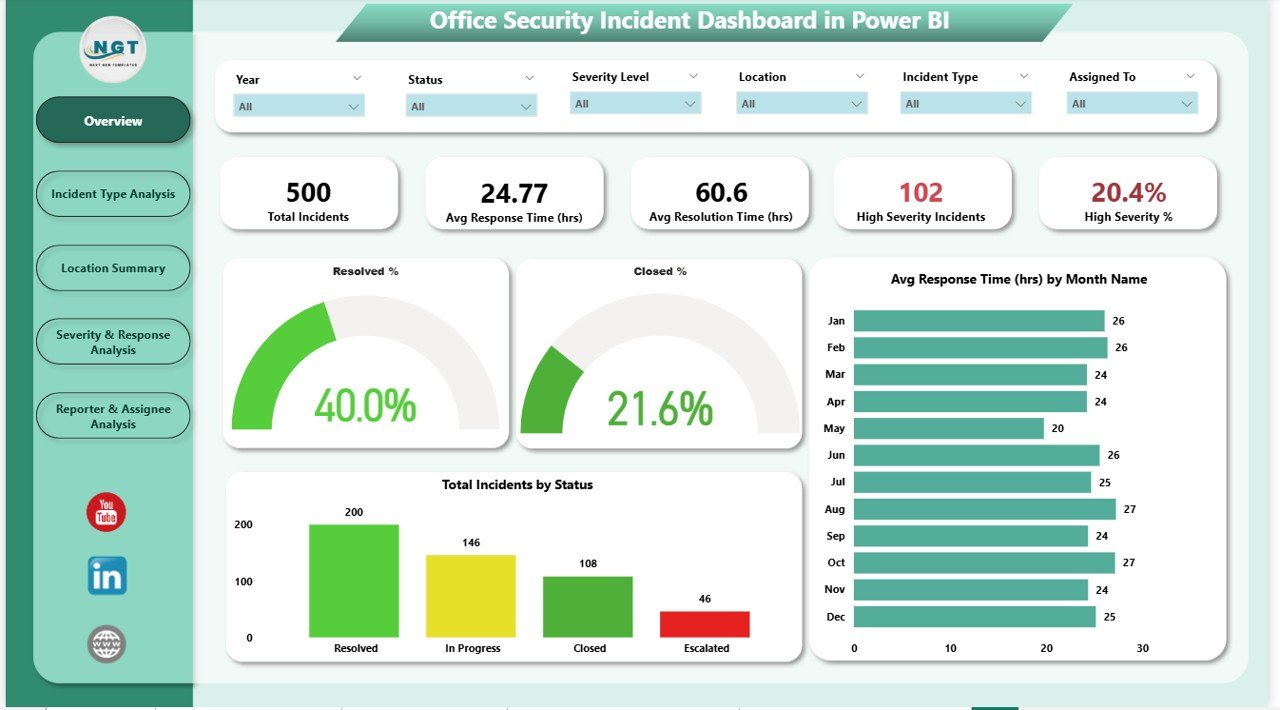
Overview Page:
-
Total Incidents
-
Avg. Response & Resolution Times
-
High Severity % & Incident Counts
-
Charts for status, trends, and closure rates
-
-
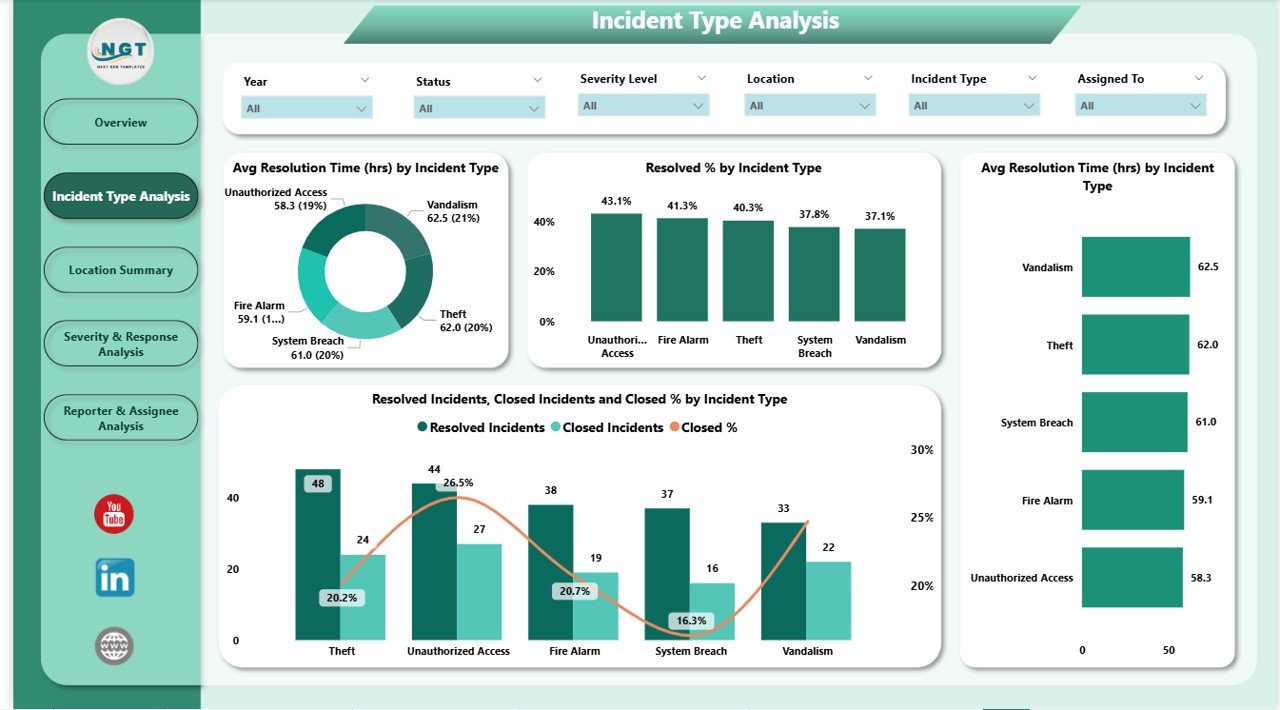
Incident Type Analysis:
-
Compare resolution success rates by incident type
-
Identify areas needing process improvements
-
-
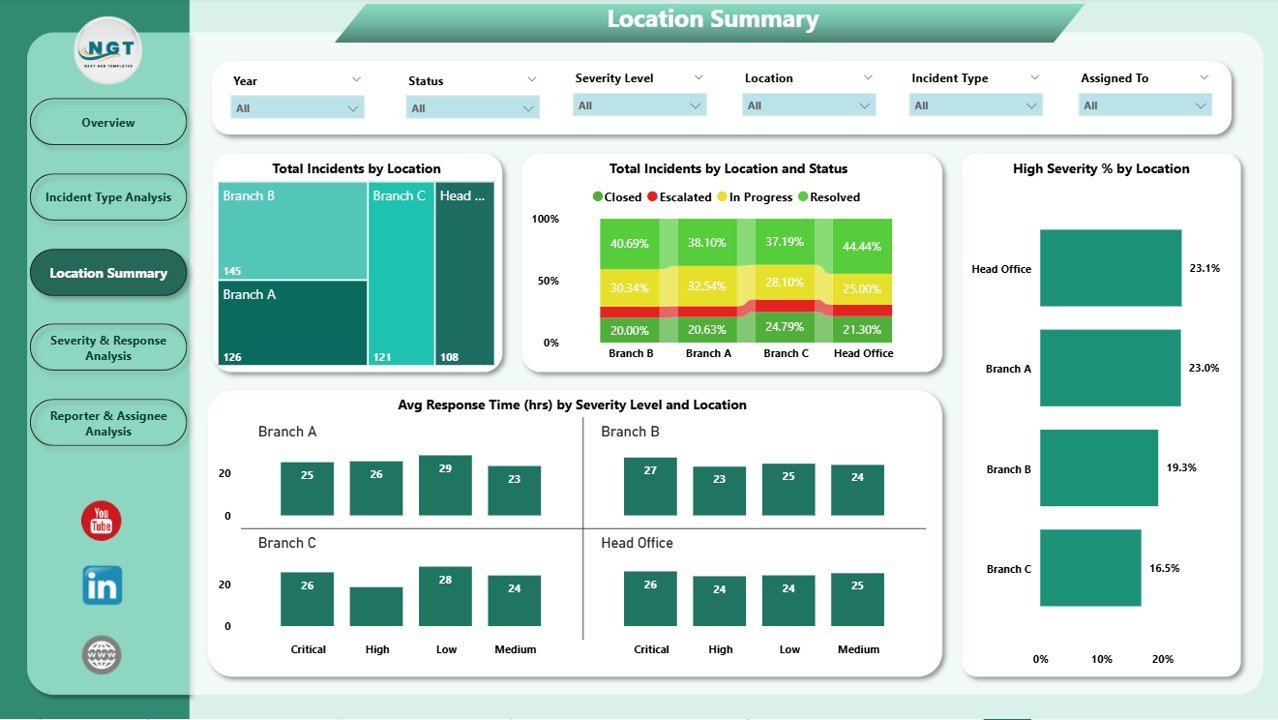
Location Summary:
-
Track incidents geographically
-
See efficiency by severity and location
-
-
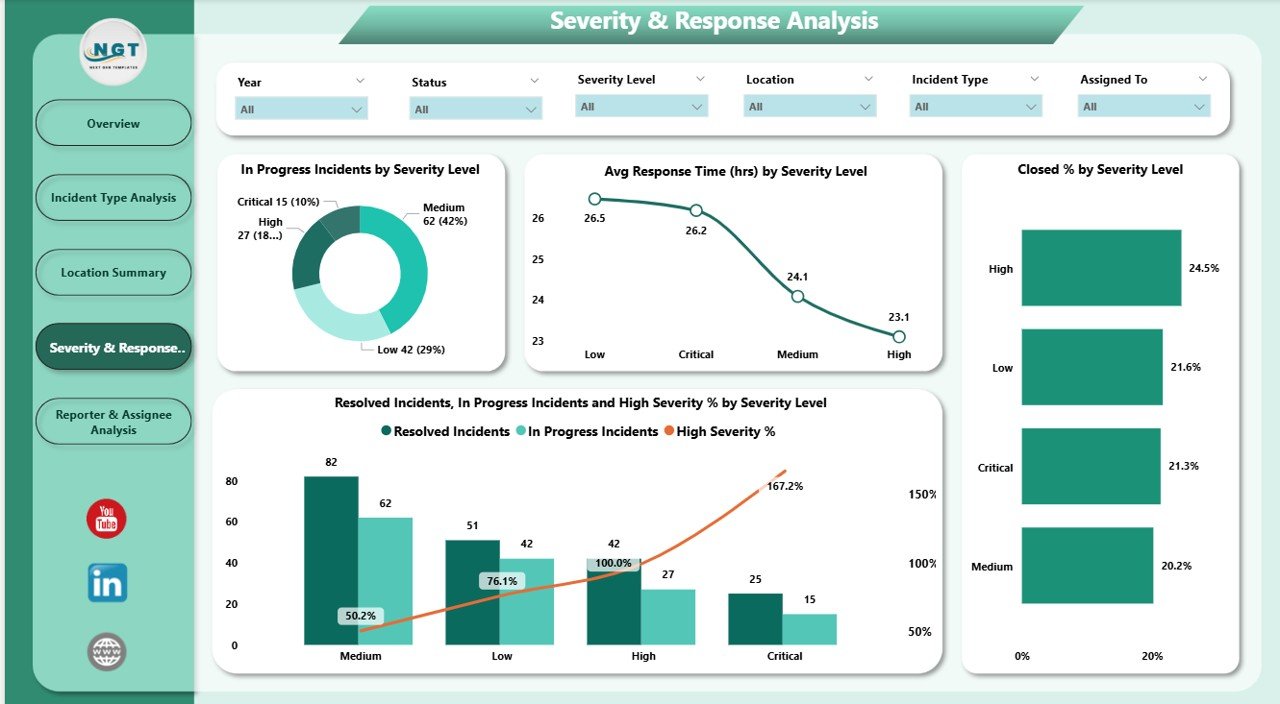
Severity & Response Analysis:
-
Monitor workload distribution by severity
-
Track closure efficiency and delays
-
-
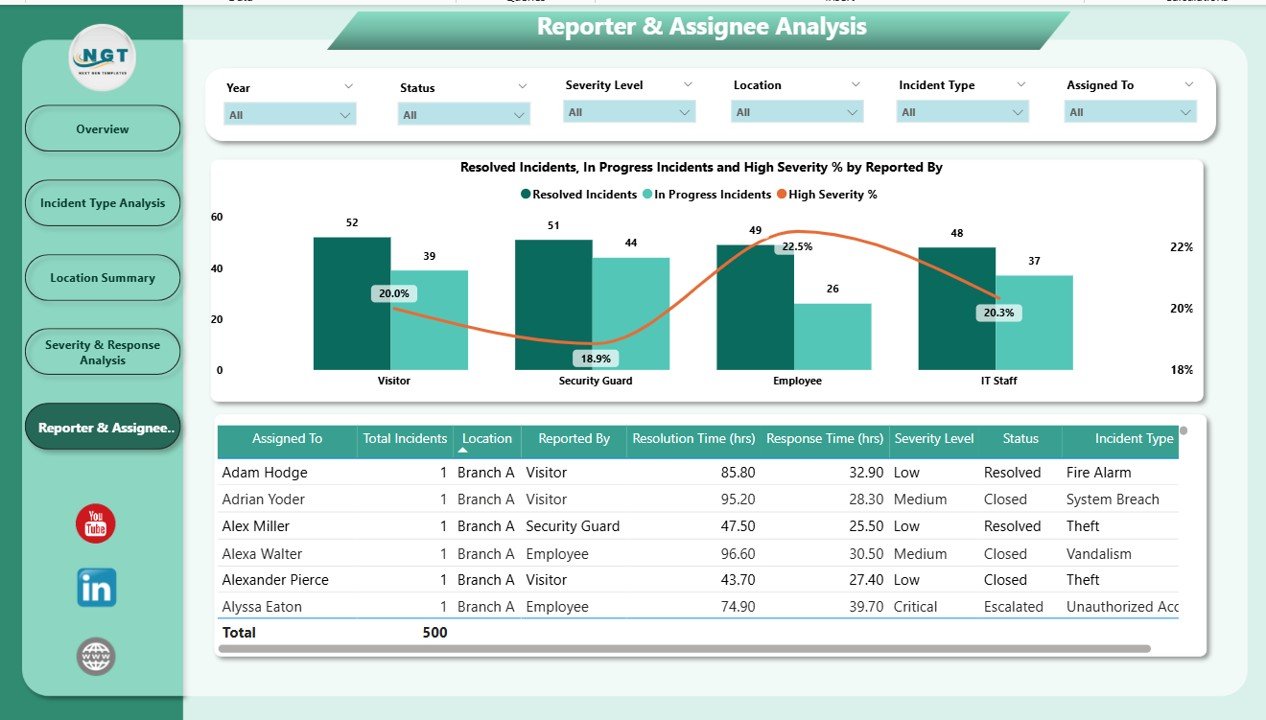
Reporter Analysis:
-
Measure reporting effectiveness by department/person
-
Optimize accountability and response
-
🛠 How to Use the Office Security Incident Dashboard
-
Connect Your Data: Link your incident log or security reports to Power BI.
-
Refresh in Real-Time: Ensure your dataset updates regularly (daily or live).
-
Use Filters & Drill-Throughs: Focus on specific incidents, regions, or severity levels.
-
Set Benchmarks: Define KPIs like max response time or resolution SLA.
-
Share Insights: Export or share live dashboards with leadership for better decision-making.
Within minutes, you’ll turn raw incident data into clear, actionable intelligence.
👥 Who Can Benefit from This Dashboard?
-
HR & Facility Managers 🏢 – Ensure workplace safety and compliance.
-
Security Teams 🚓 – Monitor efficiency, reduce delays, and prioritize high-risk cases.
-
Executives & Leadership 👔 – Gain transparency into security performance.
-
IT & Compliance Teams 💻 – Use insights to strengthen security protocols.
-
Multi-Location Offices 🌍 – Track incidents across branches for global security oversight.
🚀 Advantages of Using This Dashboard
-
Reduce Risk Exposure: Spot recurring issues before they escalate.
-
Improve Team Performance: Track response and resolution KPIs.
-
Enhance Reporting: Replace static reports with interactive insights.
-
Boost Efficiency: Save time with real-time tracking instead of manual logs.
-
Proactive Management: Anticipate high-risk trends with monthly analytics.
✅ Best Practices for Maximum Results
-
Update incident data daily or in real-time.
-
Focus on high-severity metrics for risk prioritization.
-
Segment data by type, location, and reporter for deeper insights.
-
Use monthly and quarterly trend reviews to strengthen safety strategies.
-
Integrate with ERP/incident systems for seamless updates.
📌 Click here to read the Detailed Blog Post
Watch the step-by-step video Demo:


Reviews
There are no reviews yet.