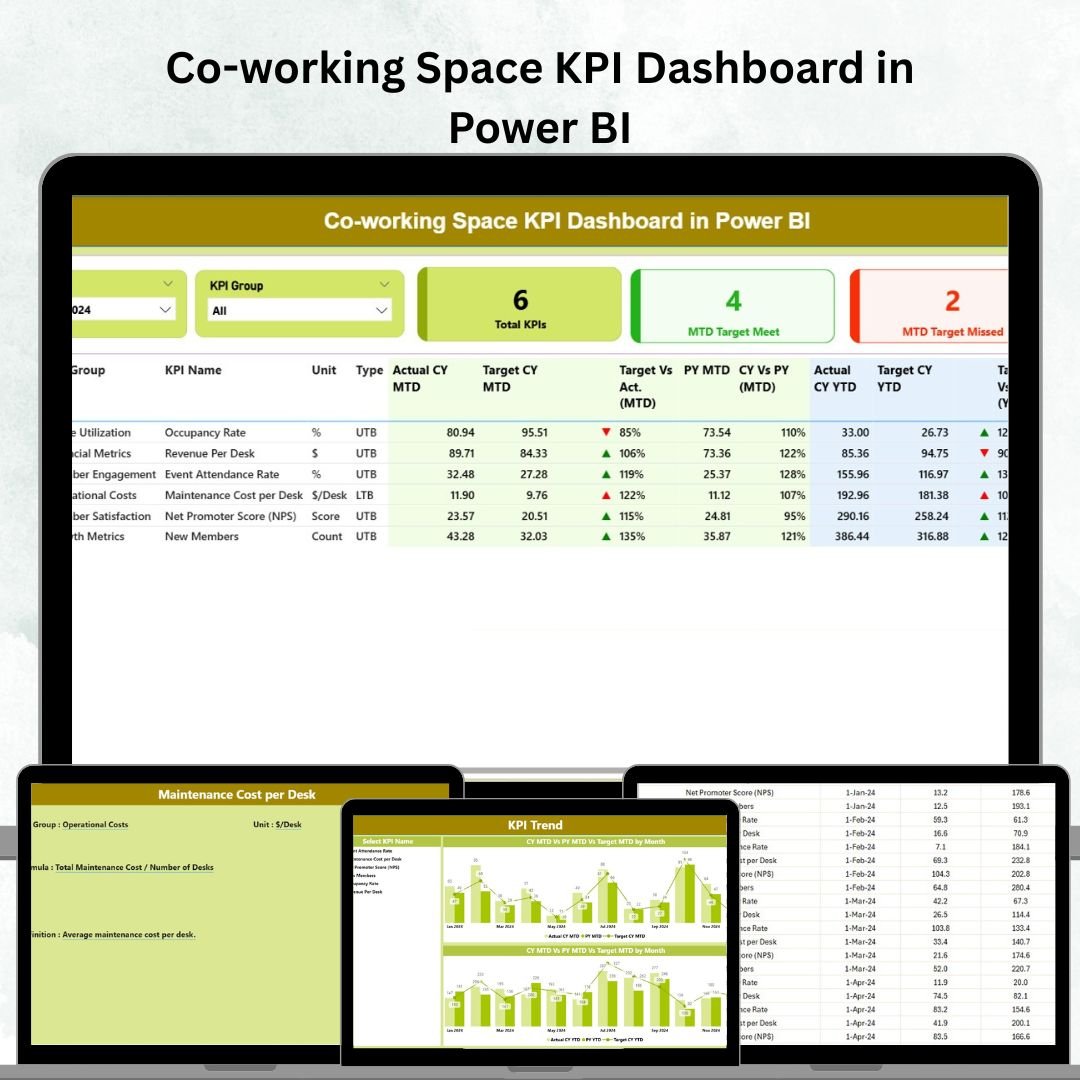
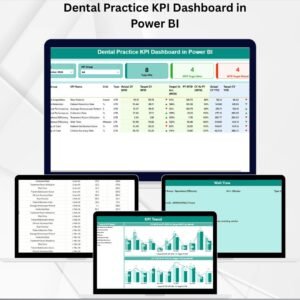
The co-working industry is booming, but growth comes with challenges—managing occupancy, revenue, customer satisfaction, and efficiency. Relying on scattered reports often leads to delays and missed opportunities. That’s why we created the Co-working Space KPI Dashboard in Power BI—a powerful, ready-to-use tool that consolidates all your performance metrics into one interactive dashboard.
With Microsoft Power BI’s advanced visuals and drill-through capabilities, this dashboard transforms raw data into actionable insights. Whether you’re a co-working operator, community manager, or finance leader, you can track progress in real-time, compare actuals vs. targets, and make smarter business decisions.
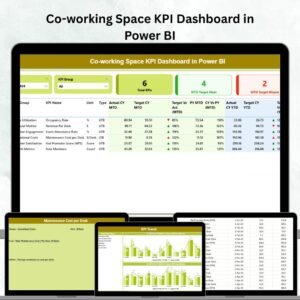
✨ Key Features of the Co-working Space KPI Dashboard
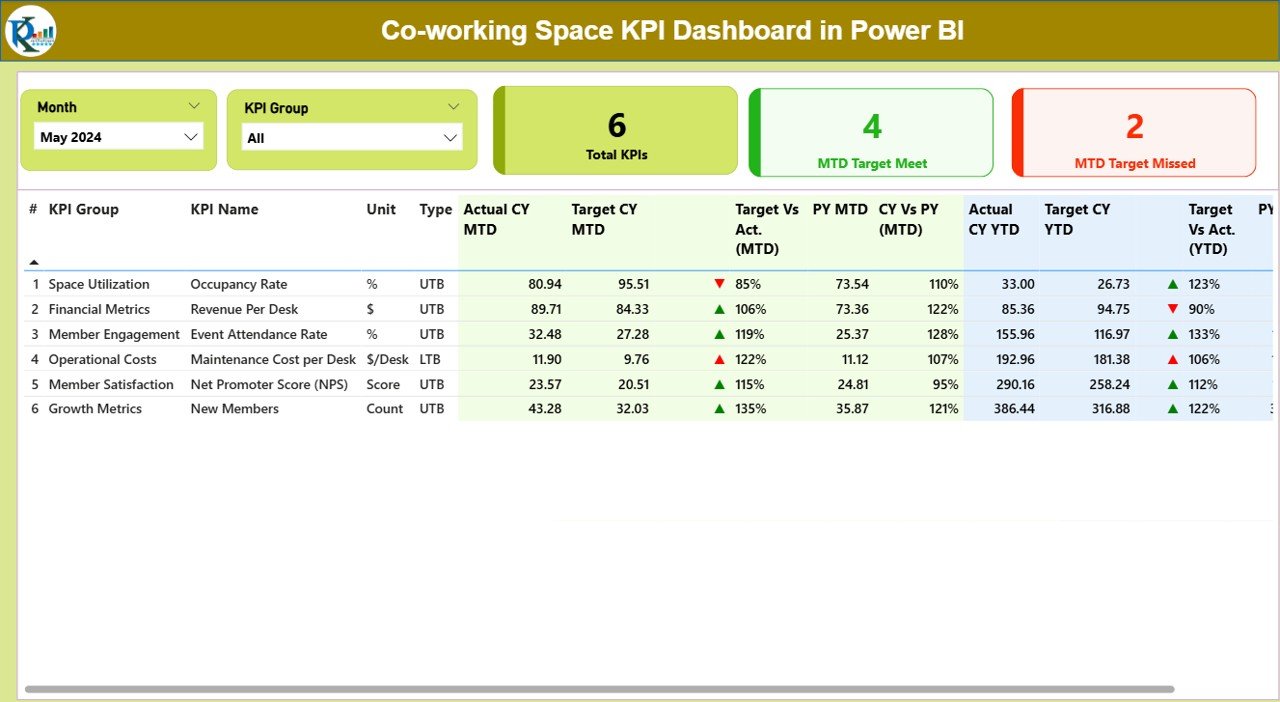
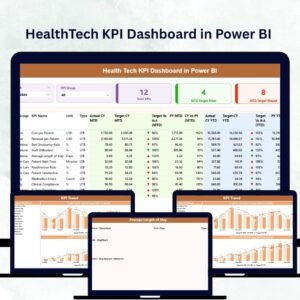
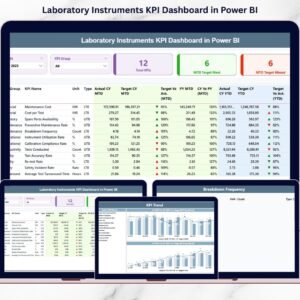
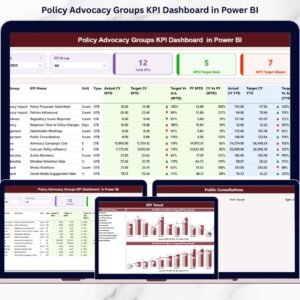
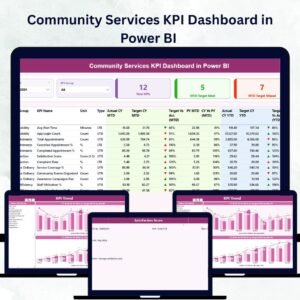
✅ Interactive Summary Page – Quick snapshot with slicers for Month & KPI Group.
✅ KPI Cards & Tables – View total KPIs, targets met vs missed, and detailed KPI breakdowns.
✅ Icons & Comparisons – Arrow indicators (▲/▼) for on-track vs off-track KPIs with Year-over-Year analysis.
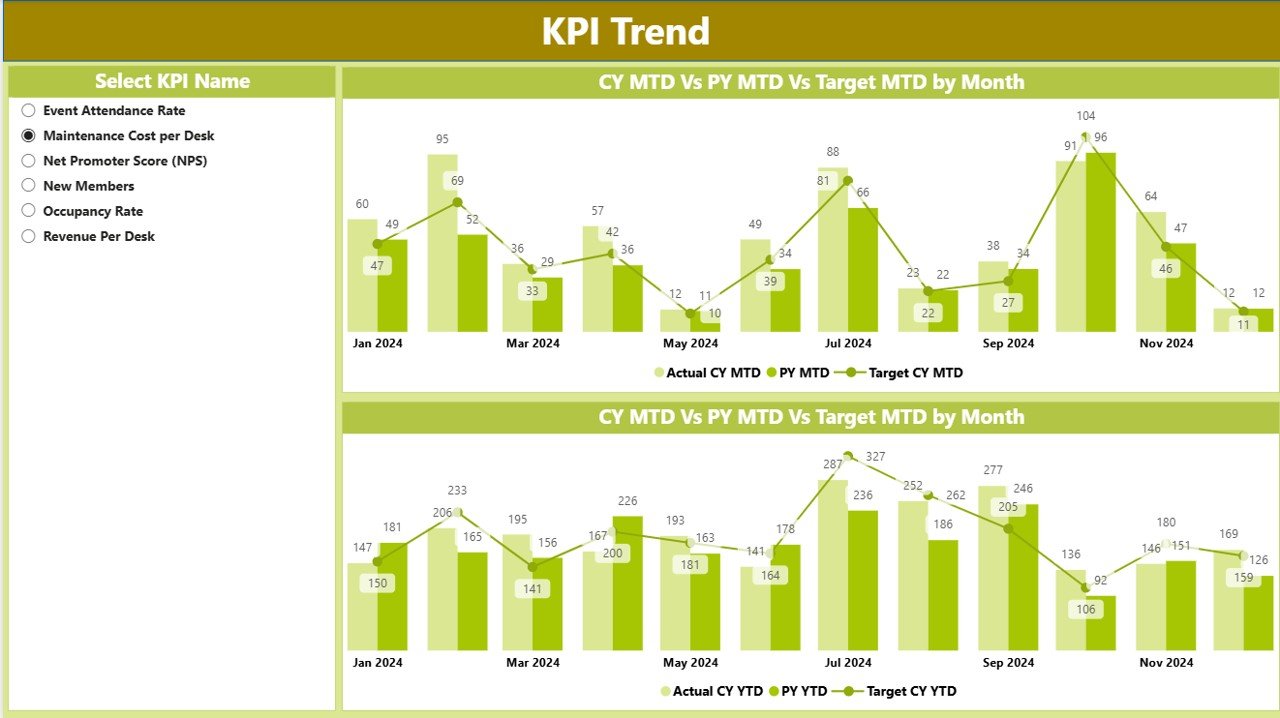
✅ KPI Trend Page – Combo charts for MTD, YTD, Target vs Actuals, and Previous Year data.
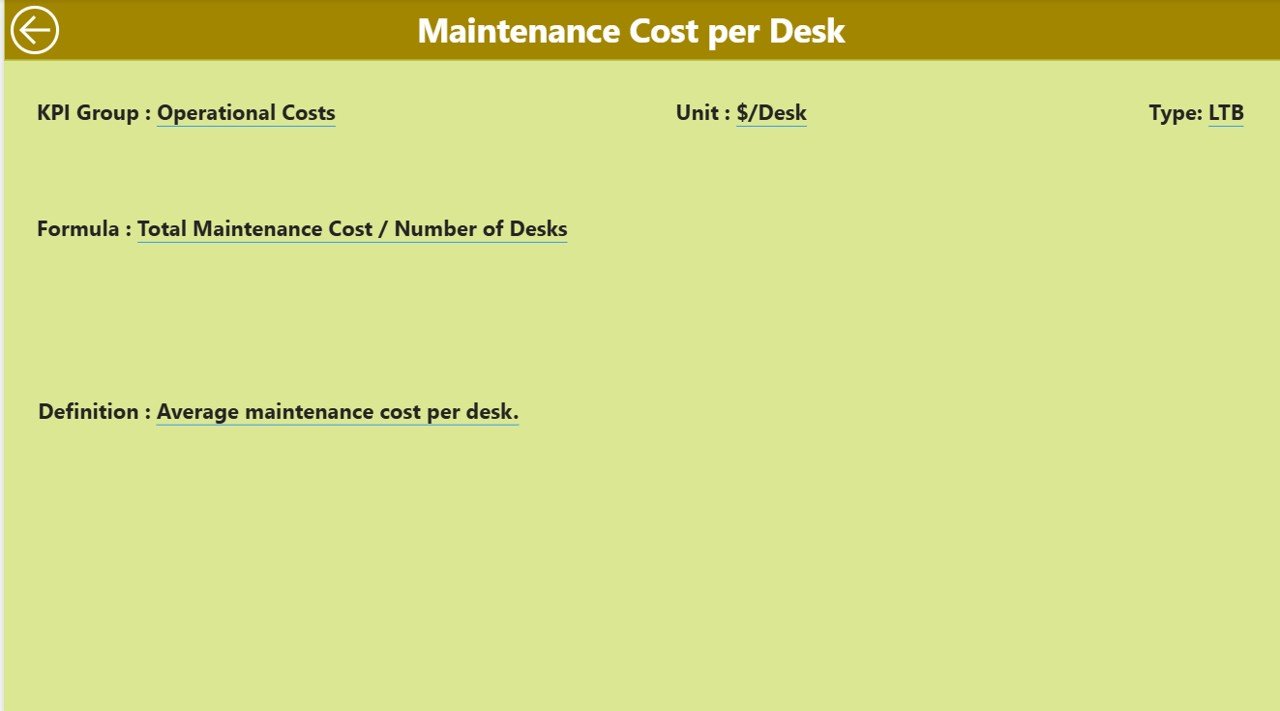
✅ KPI Definition Page – Clear formulas, units, and definitions accessible via drill-through.
✅ Excel Integration – Update one Excel file and refresh Power BI automatically.
✅ Customizable KPIs – Add or modify metrics to suit your co-working business.
✅ Scalable – Use for single locations or multi-branch operations.
📂 What’s Inside the Co-working Space KPI Dashboard
This dashboard is structured into three professional Power BI pages:
-
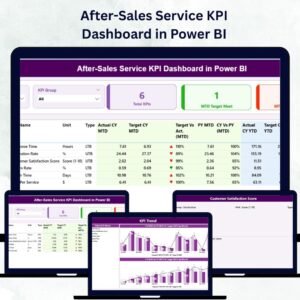
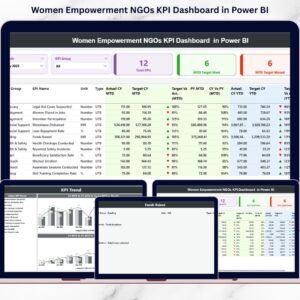
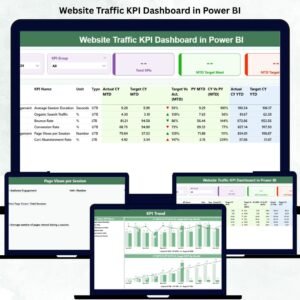
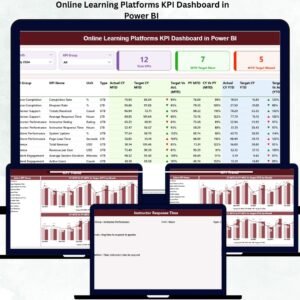
Summary Page 📊 – Your central hub with slicers, KPI cards, a detailed table (KPI Number, Group, Name, Unit, Type), and comparisons with icons.
-
KPI Trend Page 📈 – Visualize performance with combo charts. Select specific KPIs to analyze trends and patterns over time.
-
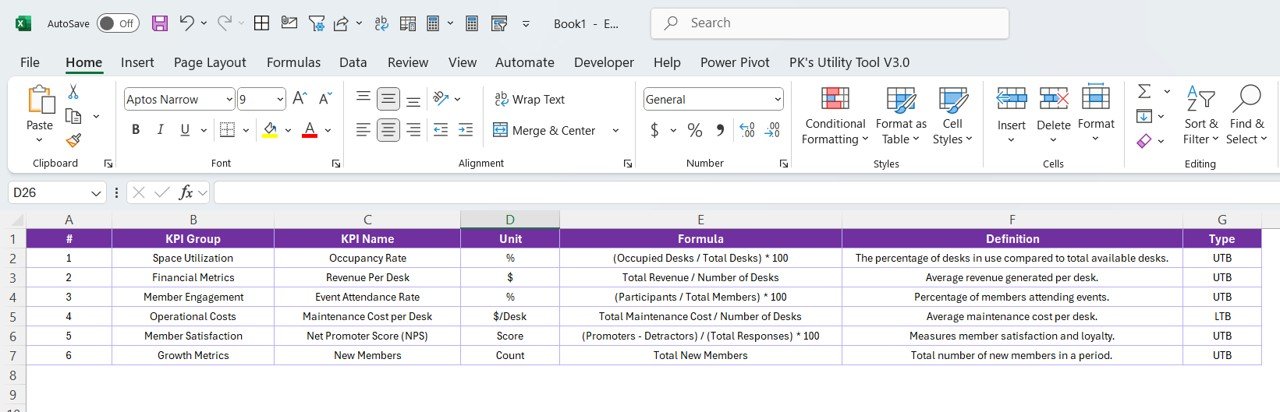
KPI Definition Page 📖 – Drill-through to review KPI details, including formulas and definitions, ensuring consistency across your organization.
🔗 Excel Data Source:
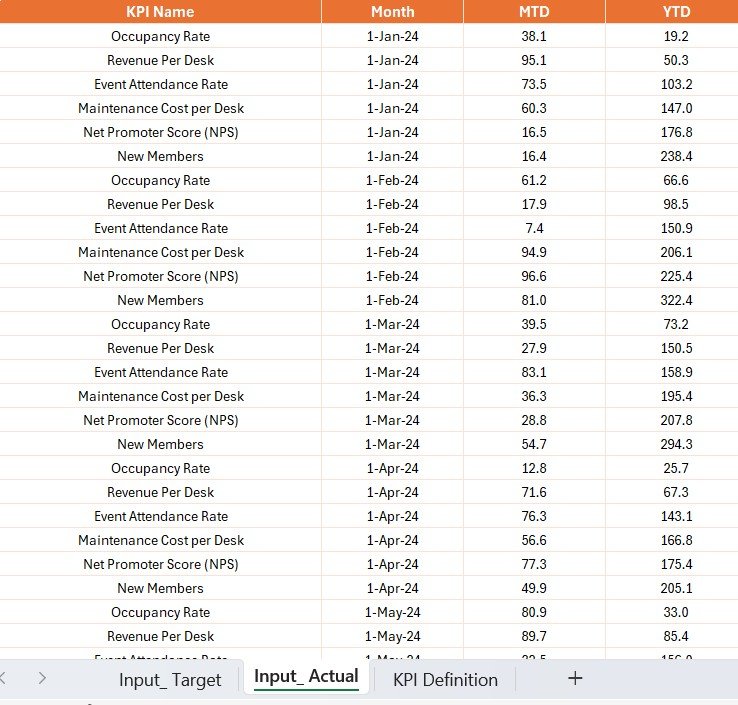
-
Input_Actual: MTD & YTD actual values.
-
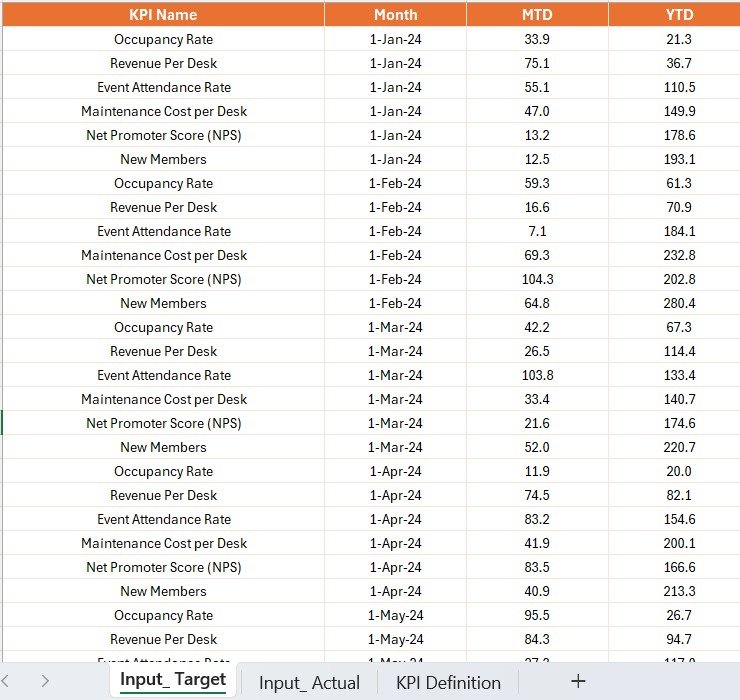
Input_Target: Monthly & yearly targets.
-
KPI Definition: Group, name, formula, unit, type (UTB/LTB).
🛠️ How to Use the Co-working Space KPI Dashboard
-
Prepare Excel Data – Enter actuals, targets, and definitions.
-
Refresh in Power BI – Import Excel data and update visuals instantly.
-
Analyze Summary Page – Get a quick overview of KPIs, progress, and YoY comparisons.
-
Explore Trends – Drill down into performance with charts.
-
Check Definitions – Validate KPIs with built-in glossary.
-
Share Insights – Distribute interactive dashboards to your team.
👥 Who Can Benefit from This Dashboard?
🏢 Co-working Operators – Monitor occupancy, revenue, and churn.
💼 Community Managers – Improve member engagement & satisfaction.
📊 Finance Leaders – Compare targets vs. actuals for accountability.
👩💻 Startups & SMEs – Scale operations with real-time insights.
📍 Multi-location Businesses – Track KPIs across different centers.
🔑 Decision-Makers – Move from reactive to proactive strategy.


Reviews
There are no reviews yet.