


Workplace safety and compliance are not just regulatory requirements—they are critical for protecting employees, building trust, and maintaining operational efficiency. Organizations today face increasing demands to ensure a safe work environment while complying with industry standards. To meet these challenges, the Safety and Compliance Dashboard in Power BI offers a ready-to-use, interactive solution that consolidates safety incidents, compliance metrics, and personnel performance into one powerful dashboard.
This tool enables safety officers, HR teams, compliance managers, and business leaders to track real-time incidents, monitor resolution progress, and analyze compliance performance across departments and locations. With intuitive visualizations and detailed reports, you can transform raw data into actionable insights for proactive risk management.

✨ Key Features of the Safety and Compliance Dashboard
-
Comprehensive Overview Page: Cards and charts summarizing incidents, resolution times, and pending cases.
-
Incident Analysis: Breakdowns by type, severity, and resolution status to pinpoint problem areas.
-
Compliance Monitoring: Department-level insights into adherence to policies and regulations.
-
Personnel Analysis: Track performance of individuals handling incidents, including severity cases and average resolution times.
-
Detailed Page: Granular tables and charts for audits, compliance reviews, and operational reporting.
-
Interactive Filters: Slicers and drill-down options to analyze data by severity, department, or personnel.
-
Real-Time Updates: Connect to your data sources for continuous monitoring.
-
Scalable Design: Suitable for single-site operations or large organizations with multiple locations.
📂 What’s Inside the Dashboard
The Safety and Compliance Dashboard in Power BI is divided into five powerful pages:
-
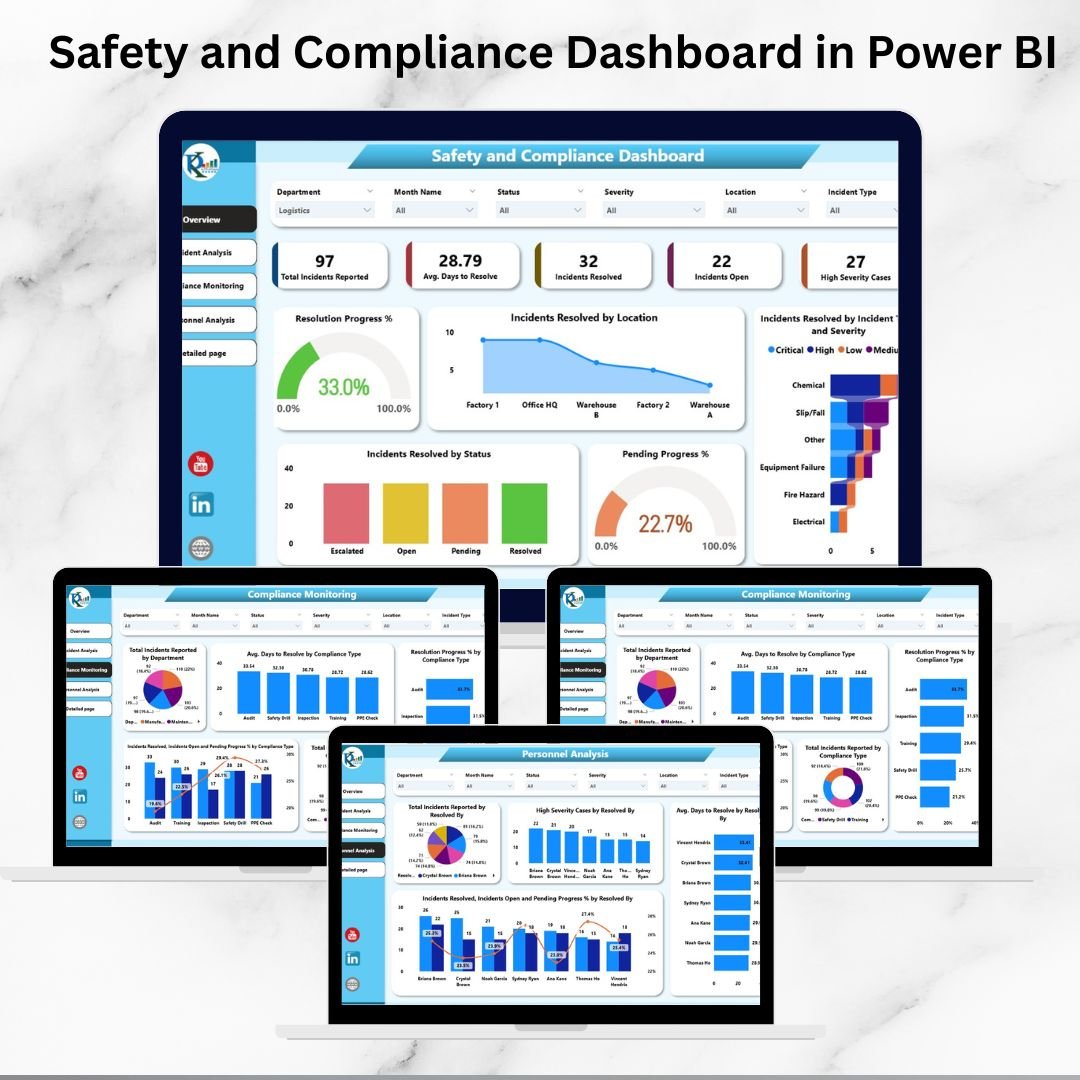
Overview Page
-
Cards: Total Incidents, Average Days to Resolve, Open vs Resolved Cases, High Severity Cases.
-
Charts: Resolution Progress %, Pending Progress %, Resolved by Type/Severity, and Location-based breakdowns.
-
-
Incident Analysis Page
-
Visuals for total incidents by type, severity, resolution status, and average resolution time.
-
Identify recurring incident categories and high-risk trends.
-
-
Compliance Monitoring Page
-
Charts for department-wise incidents, compliance type tracking, and resolution performance.
-
Compare Actual vs Target compliance across teams.
-
-
Personnel Analysis Page
-
Evaluate staff handling safety issues.
-
Metrics include total incidents resolved, severity cases handled, and resolution efficiency.
-
-
Detailed Page
-
Tables listing incident ID, type, severity, department, assigned personnel, and resolution status.
-
Perfect for audits, internal reviews, or compliance reporting.
-
🛠️ How to Use the Dashboard
-
Input or Connect Data Sources – Upload incident records with fields like type, severity, department, status, and assigned personnel.
-
Navigate Pages – Use the Overview Page for a quick snapshot and drill into Incident, Compliance, or Personnel pages for deeper analysis.
-
Apply Filters & Slicers – Filter by severity, department, or compliance type to identify trends.
-
Track Trends – Use monthly and year-over-year visuals for long-term performance evaluation.
-
Generate Reports – Export the Detailed Page for management, compliance audits, or regulatory reporting.
👥 Who Can Benefit from This Dashboard
-
Safety Officers – Monitor workplace incidents and ensure corrective actions.
-
Compliance Managers – Track adherence to policies and external regulations.
-
HR & Operations Teams – Improve employee well-being by reducing risks.
-
Executives – Gain real-time visibility into safety and compliance performance.
-
Multi-Site Organizations – Compare metrics across locations for consistency.
✅ Advantages of Using the Dashboard
-
Real-Time Monitoring – Instantly track incidents and compliance performance.
-
Data-Driven Decisions – Identify high-risk areas and act proactively.
-
Personnel Accountability – Track individual resolution efficiency.
-
Regulatory Support – Simplifies reporting for compliance audits.
-
Trend Analysis – Detect recurring issues and improve preventive measures.
-
Customizable – Add new KPIs, compliance categories, or incident types easily.
🔑 Best Practices
-
Update incident and compliance data daily or weekly.
-
Use filters to compare severity, type, and department.
-
Focus on high-severity or overdue cases to reduce risks.
-
Review monthly trends to identify recurring patterns.
-
Share dashboard insights with safety committees and leadership teams.


Reviews
There are no reviews yet.