
Key Features of Copywriting & Content Creation KPI Dashboard in Excel ✨
Content marketing is one of the strongest growth drivers for modern businesses. But without tracking and measuring results, even the most creative strategies can fall flat. The Copywriting & Content Creation KPI Dashboard in Excel is a ready-to-use solution that helps businesses analyze, optimize, and prove the ROI of their content efforts.
This dashboard empowers copywriters, marketers, and decision-makers to track performance against defined goals, compare with past results, and take data-driven actions.
Key highlights include:
-
📊 MTD & YTD Tracking – Compare actual vs. target vs. previous year.
-
✅ Target vs. Actual Analysis – Spot successes and areas needing improvement.
-
📈 KPI Trend Analysis – Visual insights for each KPI.
-
🎨 User-Friendly Design – Interactive sheets with navigation buttons.
-
💡 Customizable Structure – Add/remove KPIs based on business goals.
-
🚀 Ready to Use – No coding required, just input your data.
With this dashboard, your content strategy becomes measurable, actionable, and scalable.
What’s Inside the Copywriting & Content Creation KPI Dashboard 📂
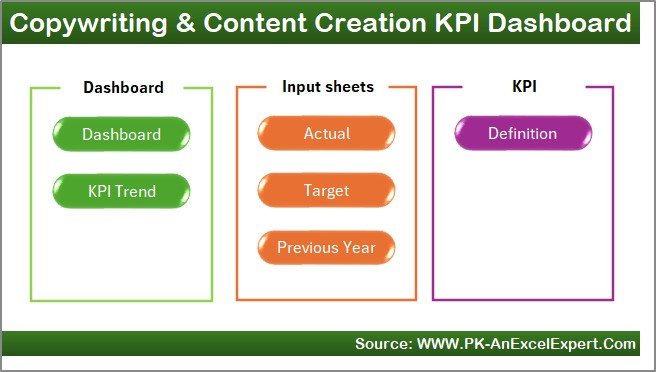
The dashboard is designed with seven worksheets, each serving a specific purpose:
-
Home Sheet
-
Acts as an index page.
-
Six navigation buttons to move quickly between sheets.
-
Saves time and improves usability.
-
-
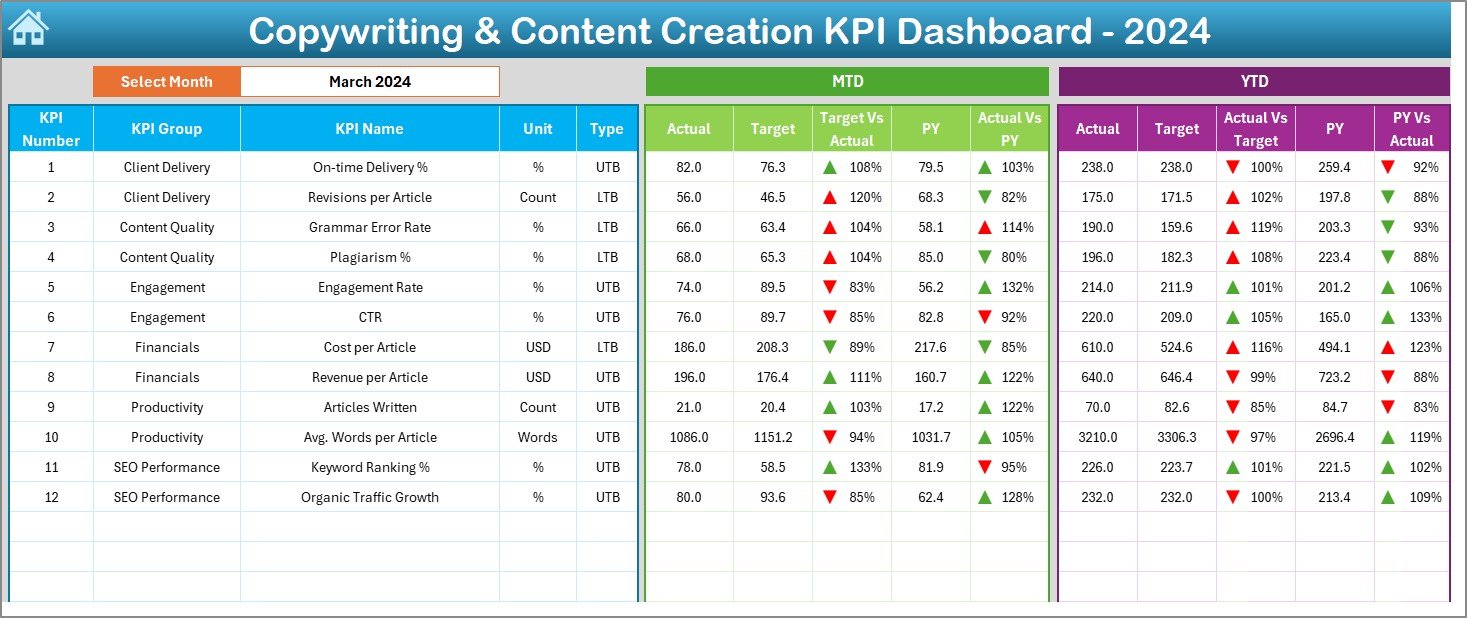
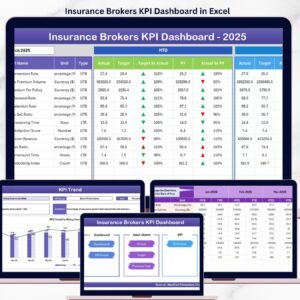
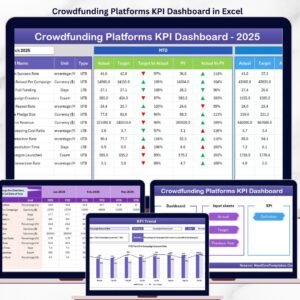
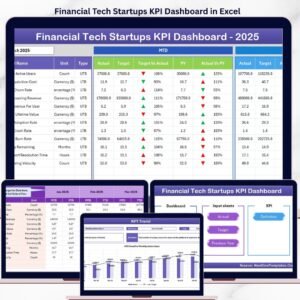
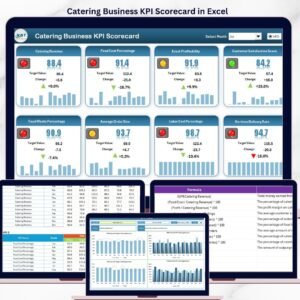
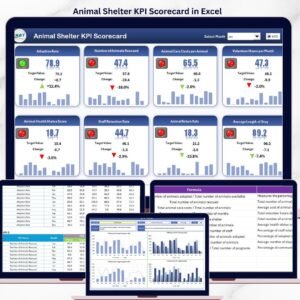
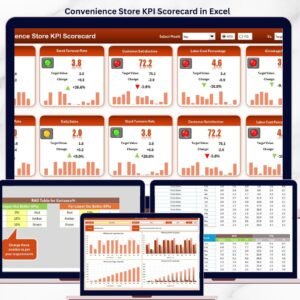
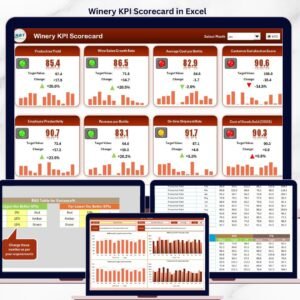
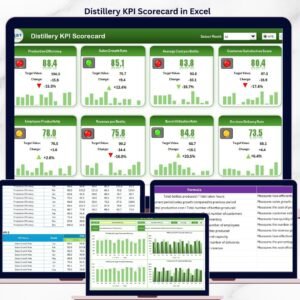
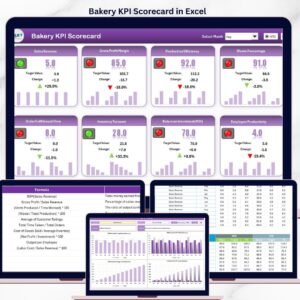
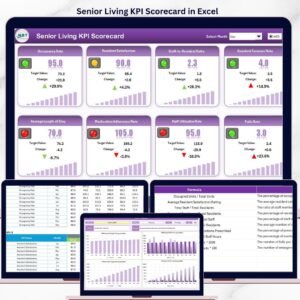
Dashboard Sheet
-
The main reporting page.
-
Drop-down at cell D3 to select a month → auto-updates data.
-
Displays:
-
MTD Analysis (Actual vs. Target vs. Previous Year).
-
YTD Analysis with arrows showing trends.
-
Target vs. Actual Performance for quick evaluation.
-
-
-
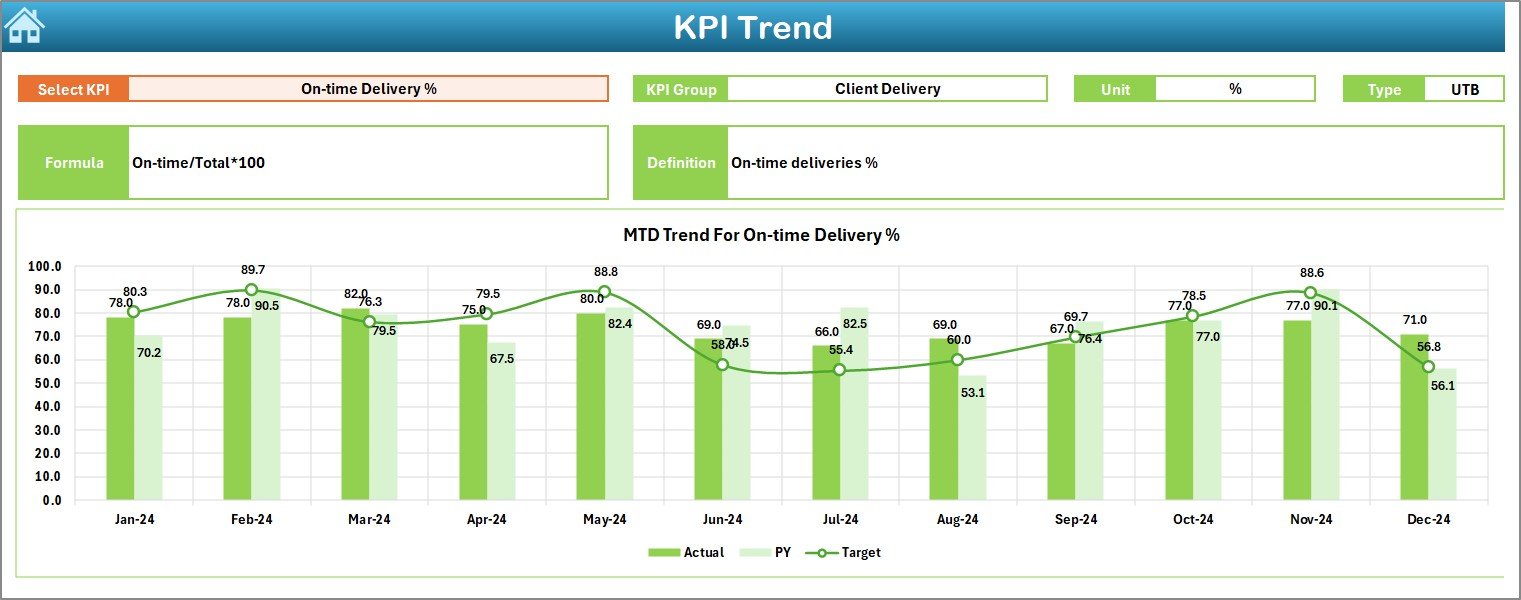
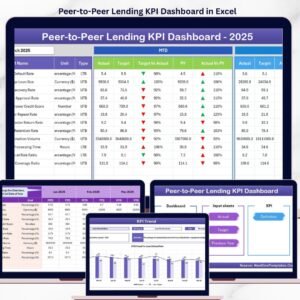
KPI Trend Sheet
-
Focuses on individual KPI analysis.
-
Drop-down at cell C3 to choose KPI.
-
Displays KPI group, unit, type (UTB/LTB), formula, and definition.
-
Trend charts for both MTD and YTD performance.
-
-
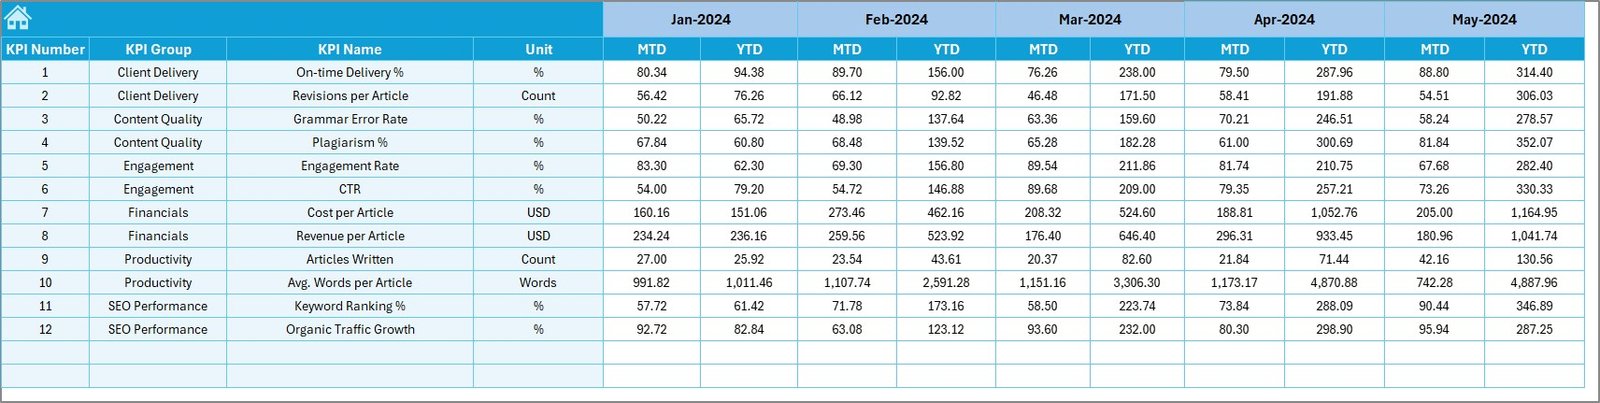
Actual Numbers Input Sheet
-
Input real-time performance data.
-
Includes MTD and YTD fields.
-
Flexible—choose your fiscal year starting month at cell E1.
-
-
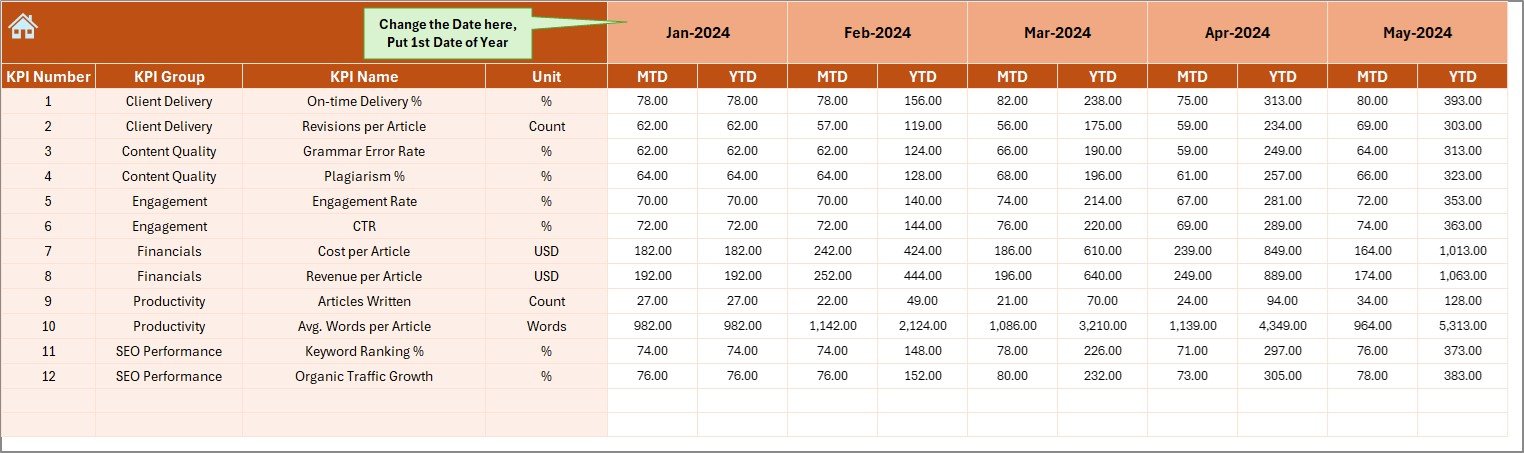
Target Sheet
-
Input monthly and yearly goals.
-
Keeps teams aligned with business objectives.
-
-
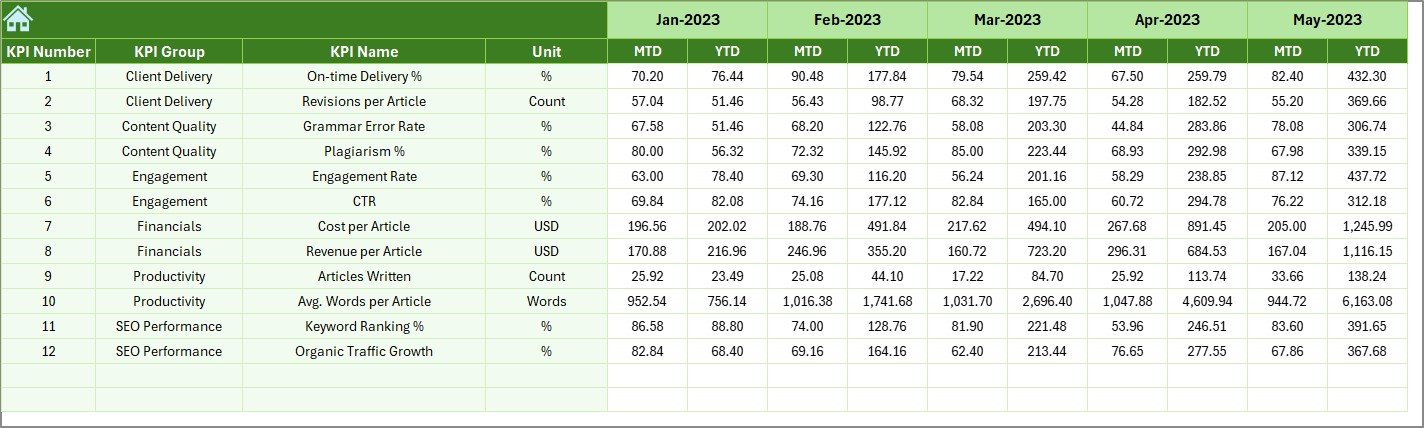
Previous Year Numbers Sheet
-
Stores historical data.
-
Helps with year-over-year comparisons.
-
-
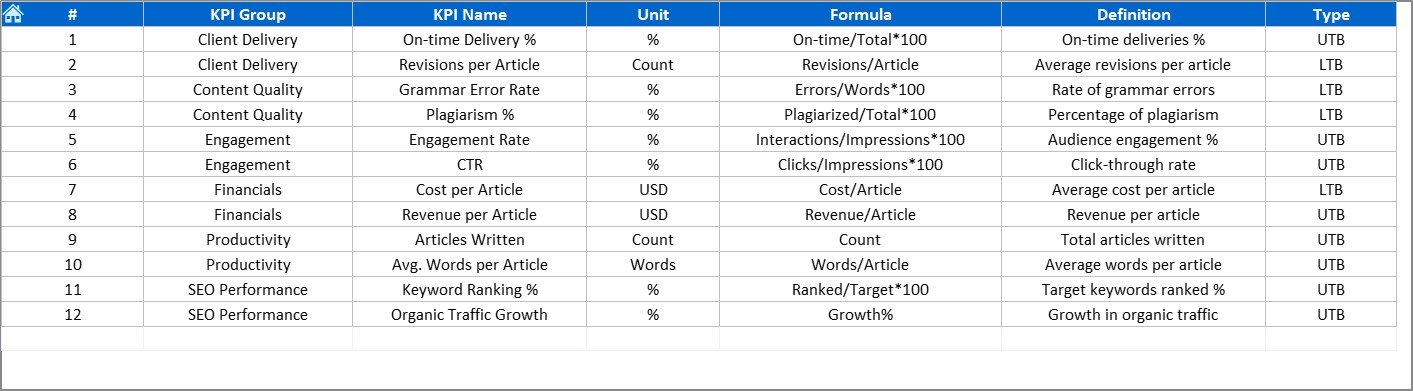
KPI Definition Sheet
-
Contains KPI groups, names, formulas, and definitions.
-
Ensures consistency and a single source of truth.
-
Why You Need a KPI Dashboard for Copywriting & Content Creation 🖊️
Content creation is more than just writing—it’s about generating measurable impact. A KPI dashboard ensures:
-
🔍 Clarity – Everyone knows what success looks like.
-
📅 Consistency – Data updated regularly for accuracy.
-
⏱️ Efficiency – Teams focus on strategies that work.
-
📊 Better Decisions – Identify gaps and optimize campaigns.
Advantages of the Copywriting & Content Creation KPI Dashboard 🌟
-
📌 Centralized Data – All metrics in one file.
-
⏳ Saves Time – Automated updates reduce manual work.
-
🎯 Customizable – Tailor KPIs to your goals.
-
📊 Visual Insights – Conditional formatting & charts make analysis easy.
-
🔄 Performance Tracking – MTD & YTD comparisons ensure timely action.
-
🤝 Goal Alignment – Keeps writers, marketers, and managers on the same page.
Common KPIs for Copywriting & Content Creation ✍️
This dashboard works best with KPIs like:
-
Website Traffic 🌐
-
Conversion Rate 💰
-
Bounce Rate ↩️
-
Engagement Rate ❤️
-
Click-Through Rate (CTR) 🔗
-
Content Production Volume 📝
-
Keyword Rankings 📈
-
Return on Content Investment (ROCI) 📊
Best Practices for Using the KPI Dashboard 💡
-
✅ Choose relevant KPIs that match business goals.
-
📅 Update data weekly or monthly.
-
🎯 Set realistic targets.
-
📊 Compare year-over-year trends.
-
🖼️ Use visuals (charts, arrows, colors) for clarity.
-
🤝 Share dashboard access with team members.
-
⚙️ Automate with formulas where possible.
Opportunities for Improvement 🔧
While already powerful, you can enhance this dashboard by:
-
🔔 Adding Automated Alerts for KPIs off-track.
-
🌐 Integrating with Google Analytics for live data.
-
📊 Building Power BI Visuals for advanced storytelling.
-
📱 Creating a Mobile Version for on-the-go tracking.
-
🤖 AI Forecasting to predict trends.
✅ Click here to read the Detailed blog post
📺 Visit our YouTube channel to learn step-by-step video tutorials
Watch the step-by-step video tutorial:


Reviews
There are no reviews yet.