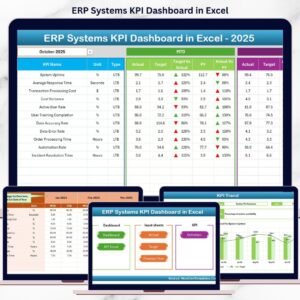
The Finance and Accounting Revenue Tracking KPI Dashboard in Excel is a comprehensive tool designed to help businesses and finance teams track and analyze their revenue streams effectively. This Excel-based dashboard provides real-time insights into key performance indicators (KPIs) such as total revenue, revenue by department or product line, monthly performance, and year-over-year growth, enabling you to make informed financial decisions.
This dashboard simplifies the process of monitoring revenue generation, helping you identify trends, track performance against targets, and make data-driven decisions to improve business profitability. Whether you’re managing a small business, a large enterprise, or any organization with multiple revenue sources, this dashboard will streamline your revenue tracking and reporting efforts.
Key Features of the Finance and Accounting Revenue Tracking KPI Dashboard in Excel
📊 Comprehensive Revenue Tracking
Monitor total revenue across different departments, products, or services. Track overall revenue performance, including monthly and yearly comparisons, to identify growth trends.
📈 Revenue Growth & Performance Analysis
Evaluate your revenue growth over time. Compare current revenue figures with previous months or years to assess overall performance and identify areas for improvement.
📅 Monthly & Year-to-Date Performance
Monitor monthly revenue performance and year-to-date (YTD) growth. This helps you evaluate both short-term and long-term performance trends.
📉 Revenue Targets vs. Actuals
Set revenue targets and track actual revenue against those goals. This feature helps identify whether your business is meeting its revenue goals and where adjustments are needed.
💡 Departmental or Product-Specific Revenue
Track revenue by different departments or product lines. This allows you to pinpoint high-performing areas and focus your efforts on driving growth in underperforming segments.
⚙️ Customizable Revenue Metrics
Tailor the dashboard to track revenue-specific KPIs that matter most to your business. Add or modify the fields based on your organization’s revenue structure and goals.
Why You’ll Love the Finance and Accounting Revenue Tracking KPI Dashboard in Excel
✅ Track Revenue Performance Efficiently
Keep track of total revenue and individual revenue streams with ease. This dashboard gives you a clear overview of your financial performance, from overall revenue to specific products or departments.
✅ Monitor Growth & Identify Trends
Use the revenue growth and performance analysis features to identify positive or negative trends. Make strategic adjustments based on data-driven insights to improve revenue generation.
✅ Stay On Track with Revenue Targets
Monitor progress towards your revenue targets with the targets vs. actuals comparison. This ensures that your business stays on track to meet financial goals.
✅ Simplify Financial Reporting
Easily generate reports based on real-time data. This dashboard helps you compile financial reports for stakeholders and internal decision-making without manual data entry.
✅ Customizable & Scalable
Adapt the dashboard to your business’s unique revenue model. Whether you’re a small business or a large corporation, this tool can scale and adjust to meet your needs.
What’s Inside the Finance and Accounting Revenue Tracking KPI Dashboard in Excel?
-
Total Revenue Tracking: Monitor overall revenue performance across time periods.
-
Revenue Growth & Performance Analysis: Compare current revenue figures with historical data.
-
Monthly & Year-to-Date Performance: Track both monthly revenue and YTD growth.
-
Revenue Targets vs. Actuals: Set targets and compare them with actual results.
-
Departmental/Product-Specific Revenue: Track revenue by department or product line.
-
Customizable KPIs: Adjust the dashboard to reflect your specific revenue tracking needs.
How to Use the Finance and Accounting Revenue Tracking KPI Dashboard in Excel
1️⃣ Download the Template: Instantly access the Finance and Accounting Revenue Tracking KPI Dashboard in Excel.
2️⃣ Input Revenue Data: Enter data for total revenue, departmental performance, and product-specific revenue.
3️⃣ Monitor KPIs & Performance: Track overall revenue and compare it to your targets and past performance.
4️⃣ Analyze Growth & Trends: Use time-based analysis to understand your revenue trends and growth.
5️⃣ Generate Reports & Insights: Create data-driven reports to guide financial decisions and optimize revenue generation strategies.
Who Can Benefit from the Finance and Accounting Revenue Tracking KPI Dashboard in Excel?
🔹 Finance Teams & Analysts
🔹 Business Owners & Entrepreneurs
🔹 Accounting Departments
🔹 Small & Medium Enterprises (SMBs)
🔹 Large Corporations
🔹 E-commerce Platforms & Online Retailers
🔹 Revenue Optimization Teams
Optimize your revenue tracking and analysis process with the Finance and Accounting Revenue Tracking KPI Dashboard in Excel. Stay on top of your financial performance, monitor growth, and make informed decisions to improve your bottom line.
Click here to read the Detailed blog post
Visit our YouTube channel to learn step-by-step video tutorials
Youtube.com/@PKAnExcelExpert


Reviews
There are no reviews yet.