


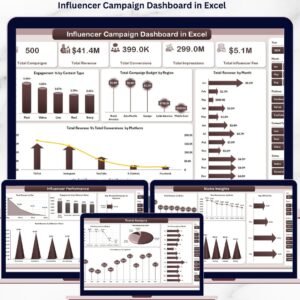
The Influencer ROI KPI Dashboard in Excel is a comprehensive tool designed to help marketers and brands measure the effectiveness of their influencer marketing campaigns. This dashboard tracks key performance indicators (KPIs) such as engagement rates, reach, impressions, ROI, and cost-per-engagement, providing valuable insights into campaign performance. With this data, teams can make informed decisions to optimize their marketing strategies and maximize ROI.
Using this Excel-based dashboard, users can input actual, target, and historical data to monitor month-to-date (MTD) and year-to-date (YTD) performance, compare with previous year data, and visualize trends through dynamic charts. The dashboard offers a centralized solution for tracking influencer campaign results, ensuring better strategy execution and continuous improvement.

Key Features of the Influencer ROI KPI Dashboard in Excel
📊 Multi-Worksheet Interface
Organized Worksheets: The dashboard comes with multiple sheets, such as the main dashboard, data entry sheets, and analysis pages, to keep all information organized and easily accessible.
Data Visualization: View KPIs in a visually engaging format with charts, graphs, and conditional formatting, helping to highlight trends and performance gaps.
📈 Dynamic Dashboards and Tracking
Month-to-Date (MTD) and Year-to-Date (YTD) Tracking: Easily track influencer campaign performance over different periods, comparing actuals with targets and historical data.
Customizable Dropdowns: Select any month from a dropdown to update the dashboard and metrics, providing flexibility and ease in tracking campaign progress.
🔧 Customizable KPIs and Reporting
Input and Customize Data: Enter actual performance data, set targets, and analyze historical performance. Customize KPIs to match your campaign objectives, making the dashboard suitable for various types of influencer campaigns.
Performance Comparison: Compare current performance with previous years, showing progress or areas that need attention.
💡 User-Friendly Interface
Simplicity and Clarity: Designed with user-friendliness in mind, the dashboard allows easy navigation, even for non-technical users.
Customizable Layout: Modify and personalize the dashboard layout to suit your specific needs and preferences.
Benefits of Using the Influencer ROI KPI Dashboard in Excel
✅ Informed Decision-Making
By consolidating KPIs in one easy-to-use dashboard, marketing teams can make informed, data-driven decisions to enhance campaign effectiveness and optimize strategies.
✅ Improved Campaign Performance
Easily identify which influencer campaigns are performing well and which need adjustments. With real-time data, you can adjust tactics quickly to improve results.
✅ Greater Accountability
Having a transparent, centralized view of campaign performance ensures accountability within teams and with influencers, ensuring clear expectations and results.
✅ Time-Efficient Reporting
The automated data visualization and tracking features reduce the time spent on manual reporting, enabling faster decision-making.
Getting Started with Your Influencer ROI KPI Dashboard in Excel
Download the Template: Get started by downloading the Influencer ROI KPI Dashboard template to begin tracking your influencer campaigns.
Define Your KPIs: Customize the dashboard to track the metrics that matter most for your campaigns, such as engagement rate, ROI, and reach.
Import Data: Import data from your influencer platforms or analytics tools to keep the dashboard updated with the most current information.
Monitor Performance: Use the dashboard to regularly monitor campaign performance, identify trends, and make necessary adjustments.
Collaborate with Your Team: Share the dashboard with stakeholders and team members to keep everyone aligned on goals and performance.
By utilizing the Influencer ROI KPI Dashboard in Excel, your team can optimize influencer campaigns, measure effectiveness, and enhance overall marketing strategy.
Click here to read the Detailed blog post
Influencer ROI KPI Dashboard in Excel
Visit our YouTube channel to learn step-by-step video tutorials
YouTube.com/@PKAnExcelExpert
Watch the step-by-step video Demo:
Compatibility and Requirements
- Works in Microsoft Excel desktop (Excel 2016 or later, or Microsoft 365).
- Conditional formatting highlights trends and performance gaps. Microsoft explains it in Use conditional formatting to highlight information.
Frequently Asked Questions
Which influencer KPIs does the dashboard track?
It tracks engagement rate, reach, impressions, ROI and cost per engagement.
Can I see month-to-date and year-to-date results?
Yes. It shows MTD and YTD performance against targets and against the previous year.
How do I change the month?
Pick a month from the dropdown and the dashboard and metrics update.
What data do I enter?
You enter actual, target and previous year data on the data entry sheets.
Is there a Google Sheets version?
Yes. The Influencer ROI KPI Dashboard in Google Sheets covers the same KPIs in Google Sheets.
Related Influencer Marketing Templates
- Influencer ROI KPI Dashboard in Google Sheets: the same KPIs in Google Sheets
- Influencer Engagement KPI Dashboard in Excel: focus on engagement KPIs
- Influencer Marketing KPI Dashboard in Excel: wider influencer marketing KPIs
- Influencer Campaign Dashboard in Excel: track each campaign on a dashboard
- Marketing and Social Media Analytics Kit: 7 marketing templates in one download
Browse all Excel KPI dashboards or the Excel sales and marketing templates.

















Reviews
There are no reviews yet.