
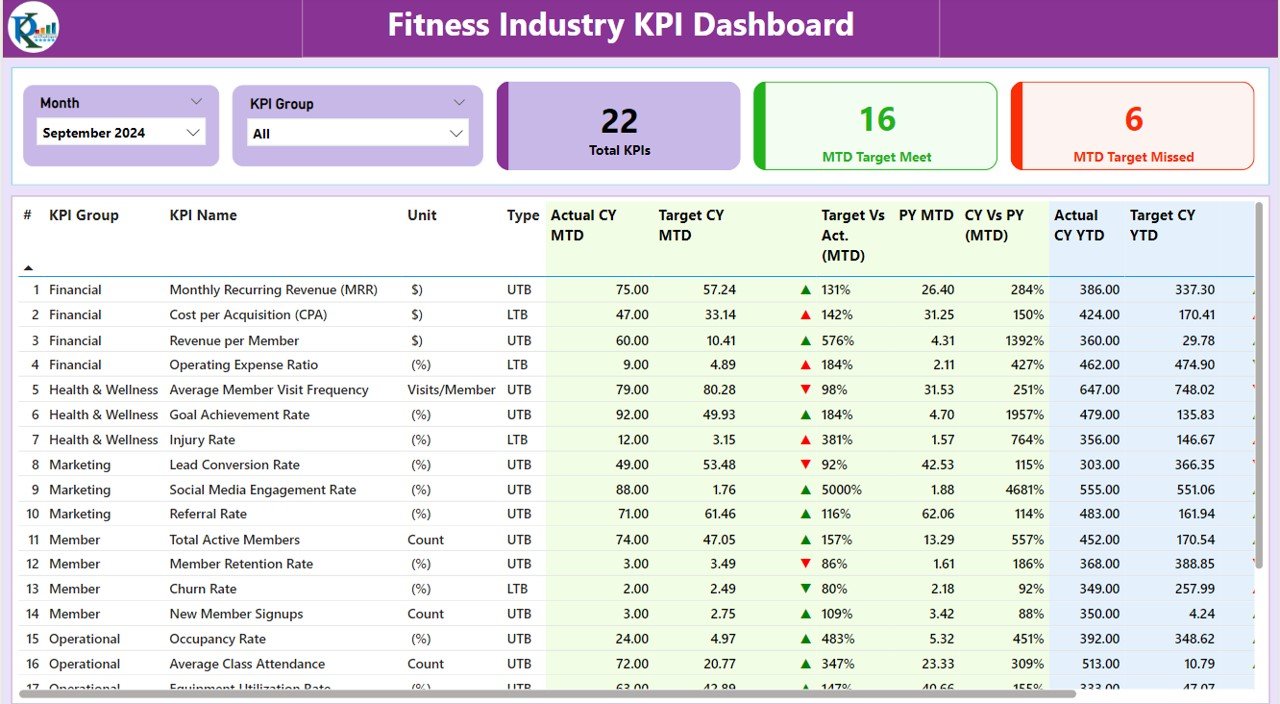
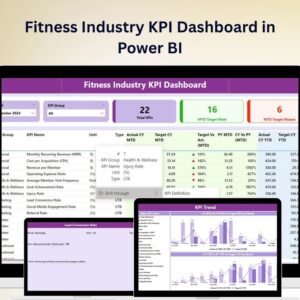
The Fitness Industry KPI Dashboard in Power BI is a comprehensive tool designed for fitness business owners, managers, and analysts to track key performance indicators (KPIs) in the fitness industry. Whether you’re managing a gym, fitness studio, or wellness center, this Power BI-based dashboard helps you monitor all aspects of your business, from membership growth and revenue generation to customer satisfaction and operational efficiency.
With real-time tracking and customizable features, this dashboard provides a holistic view of your fitness business, allowing you to make data-driven decisions to drive growth, improve member retention, and optimize overall performance.
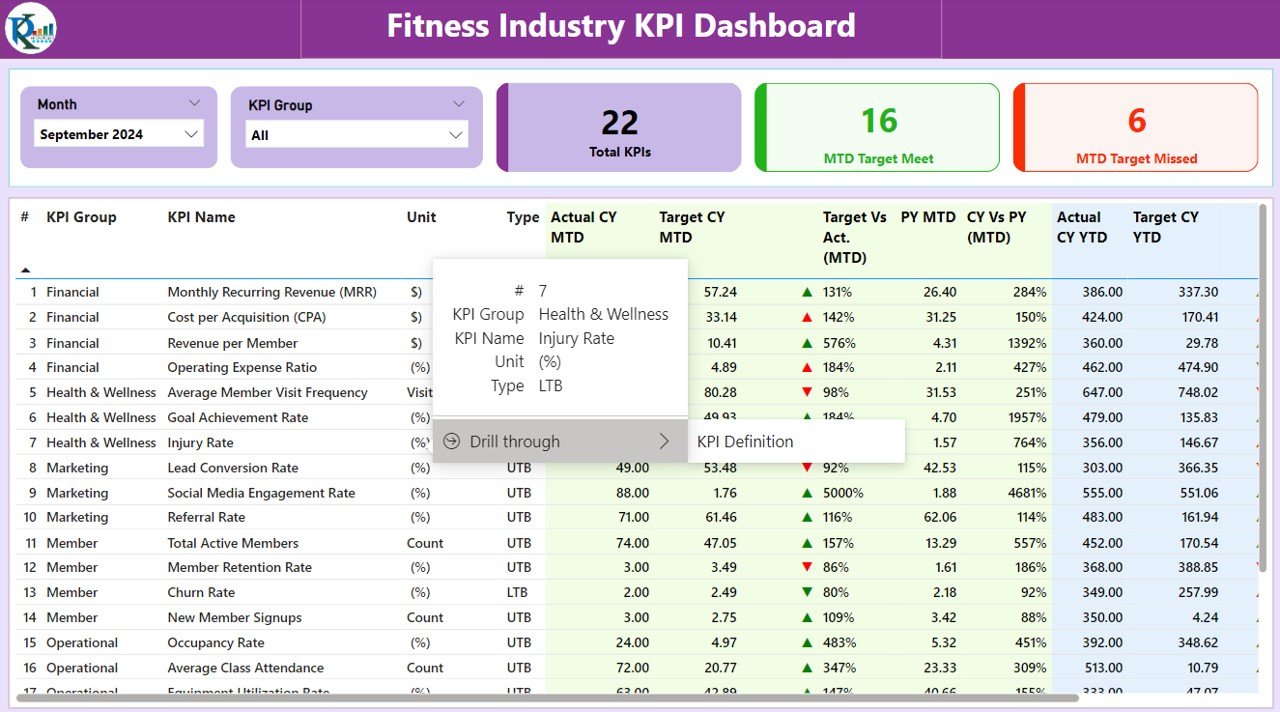
Key Features of the Fitness Industry KPI Dashboard in Power BI:
🏋️ Membership and Enrollment Tracking
Monitor membership sign-ups, renewals, cancellations, and overall retention rates to gauge the health of your fitness business.
💰 Revenue and Sales Tracking
Track total revenue, membership fees, personal training sales, merchandise, and other revenue streams to evaluate financial performance.
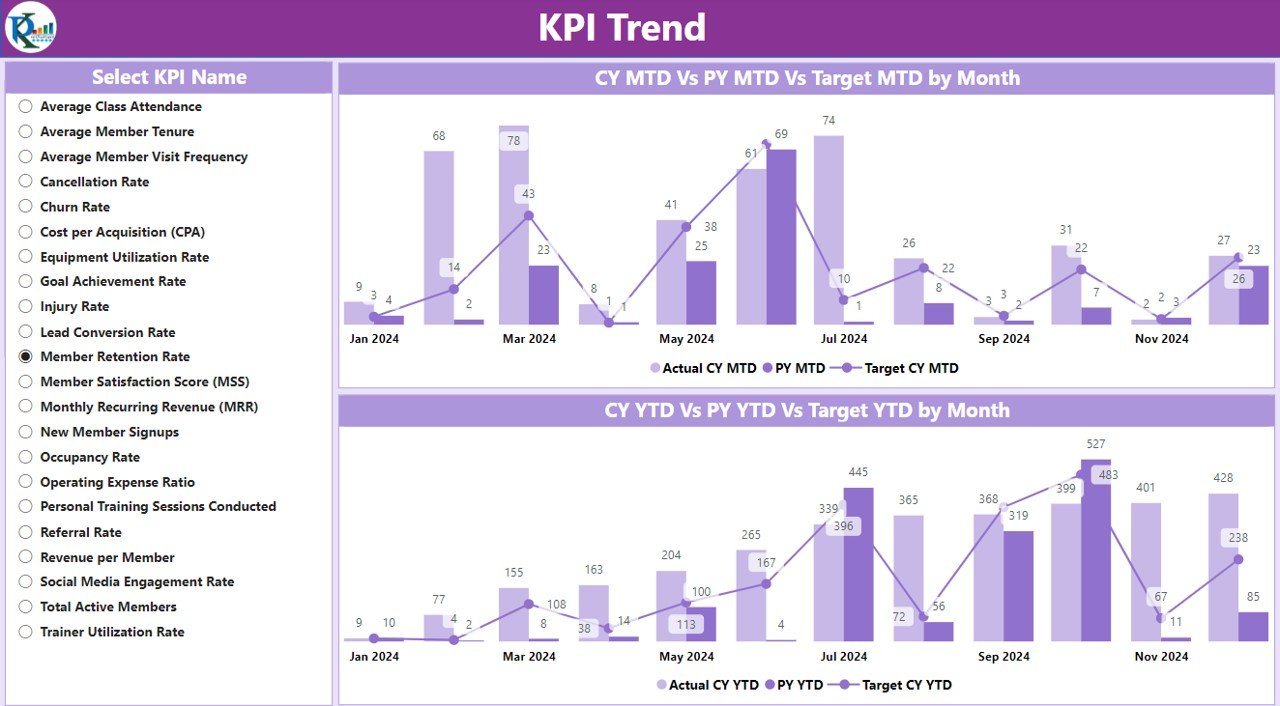
📊 Member Engagement and Attendance
Monitor member attendance, session bookings, and engagement in fitness programs to assess how actively your clients are participating.
💬 Customer Satisfaction and Retention
Track customer satisfaction scores, reviews, and member feedback to measure retention rates and identify areas for improvement in your services.
⚙️ Operational Efficiency
Analyze key operational metrics such as staff performance, equipment usage, and facility maintenance to ensure smooth and efficient operations.
🚀 Why You’ll Love the Fitness Industry KPI Dashboard in Power BI:
✅ Track Membership Growth – Monitor membership sign-ups, cancellations, and renewals to understand business growth and member retention trends.
✅ Optimize Revenue Streams – Track revenue from memberships, personal training, merchandise, and additional services to ensure maximum profitability.
✅ Improve Member Engagement – Track member attendance and engagement to assess which programs are most popular and which need improvement.
✅ Enhance Customer Satisfaction – Monitor customer satisfaction ratings, reviews, and feedback to improve services and boost member retention.
✅ Streamline Operations – Track operational performance, including staff efficiency, equipment usage, and maintenance needs, to optimize day-to-day operations.
✅ Fully Customizable and Interactive – Tailor the dashboard to your specific fitness business needs with interactive features and real-time tracking for better insights.
What’s Inside the Fitness Industry KPI Dashboard in Power BI:
-
Membership Tracking: Track member sign-ups, renewals, cancellations, and retention rates to monitor business growth.
-
Revenue and Sales Monitoring: Track total revenue, membership fees, personal training sales, and additional revenue streams.
-
Member Engagement: Monitor member attendance, session bookings, and participation in fitness programs to improve engagement.
-
Customer Satisfaction: Track feedback and satisfaction ratings from members to identify areas for improvement and increase retention.
-
Operational Insights: Track staff performance, equipment usage, and facility maintenance to optimize operations and ensure high-quality service delivery.
-
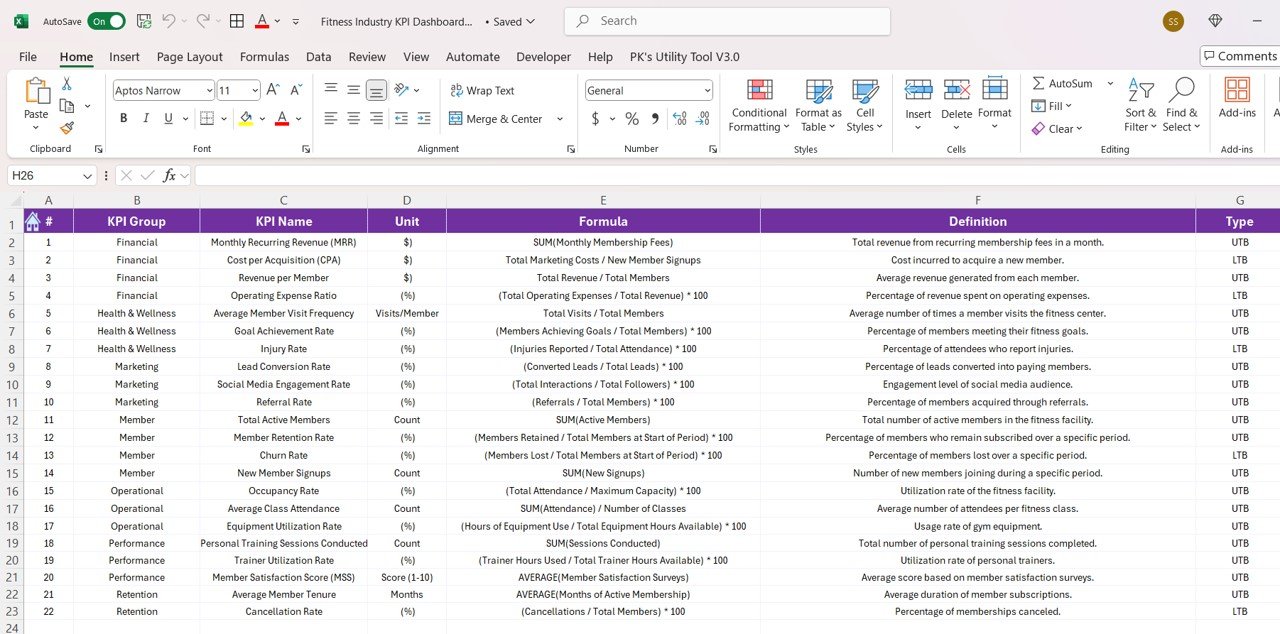
Custom Reports: Generate reports summarizing key performance metrics such as revenue, engagement, satisfaction, and operational efficiency.
How to Use the Fitness Industry KPI Dashboard in Power BI:
1️⃣ Download the Template – Access your Power BI file instantly after purchase.
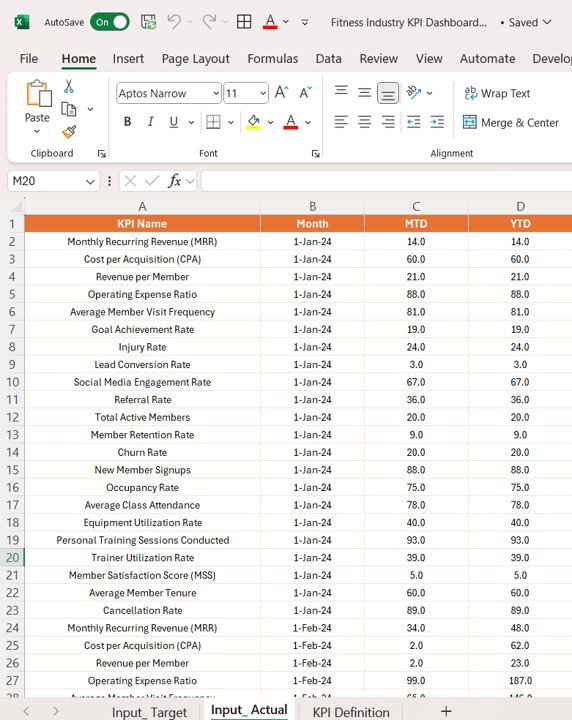
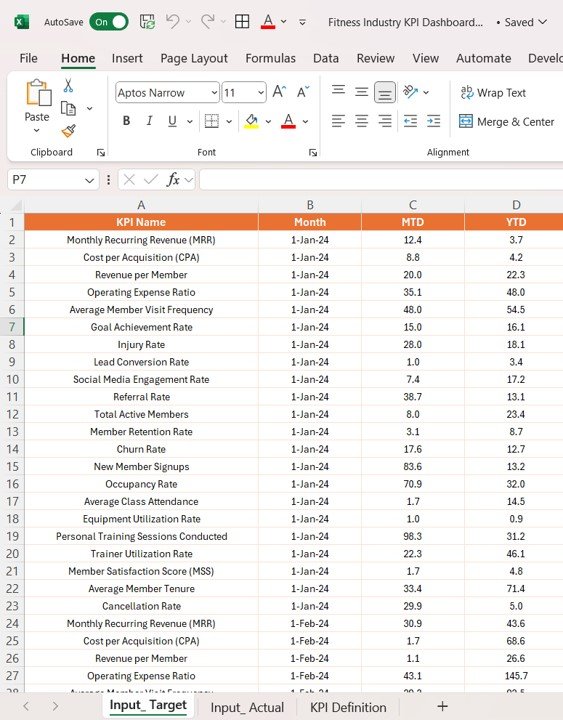
2️⃣ Input Membership and Revenue Data – Enter membership details, revenue, and sales data to begin tracking key KPIs.
3️⃣ Monitor Member Engagement – Use the dashboard to track member attendance, bookings, and engagement levels across fitness programs.
4️⃣ Evaluate Customer Satisfaction – Track customer satisfaction ratings, feedback, and retention rates to ensure a high level of service and member loyalty.
5️⃣ Generate Reports – Create customized reports summarizing your business performance, financial metrics, and operational efficiency to make informed decisions.
Who Can Benefit from the Fitness Industry KPI Dashboard in Power BI:
-
Gym Owners and Managers
-
Fitness Studio Operators
-
Personal Trainers
-
Sales and Marketing Teams
-
Financial Analysts in the Fitness Industry
-
Customer Service Teams
-
Operations Managers
-
Wellness Center Managers
-
Fitness Consultants and Advisors
The Fitness Industry KPI Dashboard in Power BI is the ideal tool for monitoring and optimizing your fitness business. With its ability to track memberships, revenue, customer satisfaction, and operational efficiency, this dashboard ensures you make informed decisions to improve performance and grow your business.
Click here to read the Detailed blog post
https://www.pk-anexcelexpert.com/fitness-industry-kpi-dashboard-in-power-bi/
Visit our YouTube channel to learn step-by-step video tutorials
Youtube.com/@PKAnExcelExpert


Reviews
There are no reviews yet.