

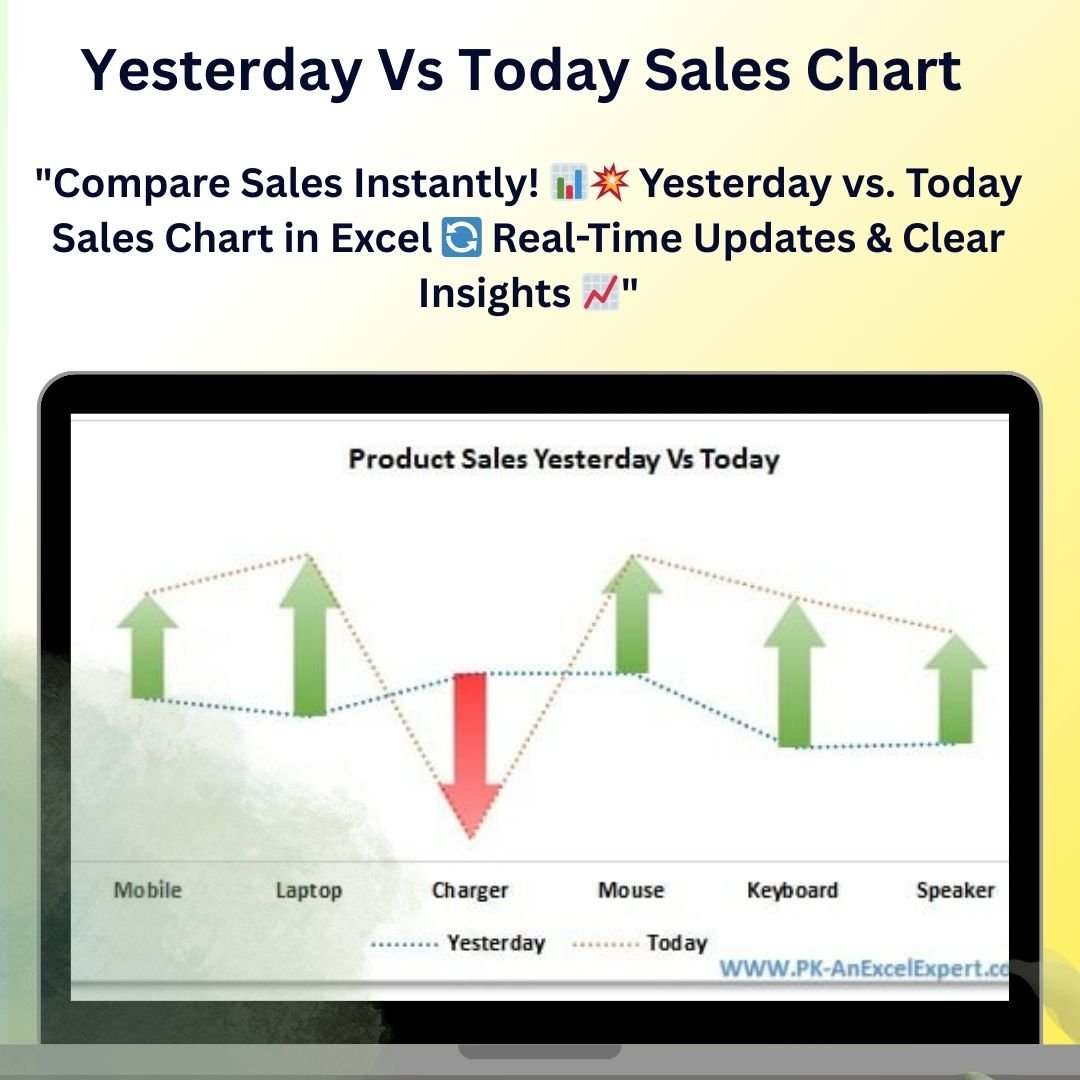

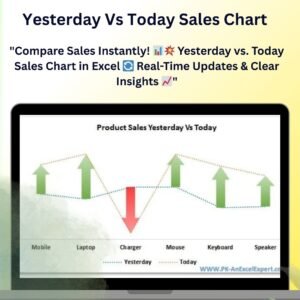
The Yesterday vs. Today Sales Chart in Excel is an essential tool for businesses and sales teams looking to track sales performance over time. This dynamic chart provides an easy way to compare sales data from yesterday and today, helping you quickly identify trends, measure performance, and make informed decisions. Whether you’re tracking daily, weekly, or monthly sales data, this chart offers an intuitive visual representation that allows you to assess your sales performance at a glance.
With its clear and visually engaging design, the Yesterday vs. Today Sales Chart helps you easily spot improvements, declines, and patterns in sales, enabling you to make data-driven decisions to drive growth. The chart is fully customizable, so you can tailor it to fit your specific sales data needs and business requirements.
Key Features of the Yesterday vs. Today Sales Chart
📌 Clear Comparison of Sales
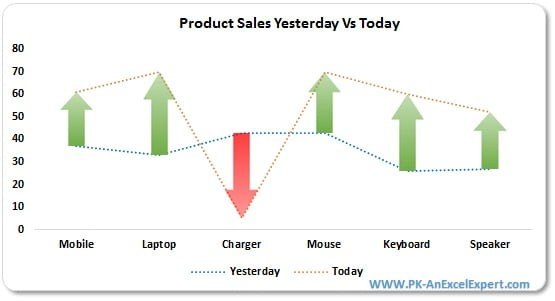
This chart allows you to easily compare sales from two time periods: yesterday and today. The side-by-side visualization provides a clear view of how your sales have changed, helping you quickly assess performance.
🛠 Customizable Design
Customize the chart to match your business needs. You can adjust the colors, labels, and chart elements to reflect your sales data and branding, making it a versatile tool for any business.
💡 Real-Time Data Updates
As you input new sales data, the chart updates automatically in real-time, ensuring that you always have the most current information at hand for accurate analysis and decision-making.
🔢 Track Daily Sales Trends
This chart is perfect for tracking daily sales trends, enabling you to compare sales performance day-over-day and identify any significant changes or patterns. It’s a great way to measure the impact of promotions, marketing campaigns, or seasonal fluctuations.
🚀 Simple and Clear Visualization
The chart uses a simple yet effective design to present data clearly. With distinct color coding and labels, the Yesterday vs. Today Sales Chart allows for easy interpretation of the data, even for individuals with minimal experience in data analysis.
📊 Visual Sales Insights
With easy-to-read visuals, this chart helps you quickly spot areas of improvement or decline. It’s a useful tool for sales managers, business owners, and analysts to make informed decisions and take timely actions.
⚙ Easy Setup and Customization
Setting up the Yesterday vs. Today Sales Chart is straightforward. With clear instructions and easy-to-follow customization options, you can get the chart up and running in minutes without needing advanced Excel skills.
🚀 Why You’ll Love the Yesterday vs. Today Sales Chart
✅ Easy Sales Comparison – Compare sales from two time periods at a glance. ✅ Real-Time Updates – Watch the chart update automatically as new data is entered. ✅ Customizable Design – Modify colors, labels, and chart elements to suit your needs. ✅ Track Daily Trends – Track daily sales and measure performance day-over-day. ✅ Simple Visualization – Quick, clear interpretation of your sales data.
📂 What’s Inside the Yesterday vs. Today Sales Chart?
- Sales Comparison Chart: A visual tool to compare sales from yesterday and today.
- Customizable Design: Adjust colors, labels, and other elements to reflect your needs.
- Real-Time Data Updates: The chart updates automatically as new data is entered.
- Clear Setup Instructions: Simple, easy-to-follow steps to get the chart up and running.
🔍 How to Use the Yesterday vs. Today Sales Chart
1️⃣ Download the Template – Instant access to the Excel file upon purchase. 2️⃣ Enter Your Sales Data – Input your sales data for yesterday and today. 3️⃣ Customize the Chart – Adjust colors, labels, and chart elements to fit your needs. 4️⃣ Monitor and Analyze – Use the chart to track daily sales performance and spot trends. 5️⃣ Present and Share – Use the chart in reports or presentations to share insights.
🎯 Who Can Benefit from the Yesterday vs. Today Sales Chart? 🔹 Sales Managers
🔹 Business Owners
🔹 Marketing Teams
🔹 Project Managers
🔹 Analysts
🔹 Anyone looking to track and compare daily sales performance
Compare and track your sales with the Yesterday vs. Today Sales Chart. With real-time updates, easy customization, and clear visual representation, this chart helps you make better business decisions and monitor sales trends effectively.
Click here to read the Detailed blog post
https://www.pk-anexcelexpert.com/yesterday-vs-today-sales-chart/








Reviews
There are no reviews yet.