🚀 Unlock Powerful Insights to Empower Women in Tech Communities!
Tracking participation, diversity, and engagement across women-led tech communities can be challenging. But what if you could monitor everything in one smart, interactive dashboard?
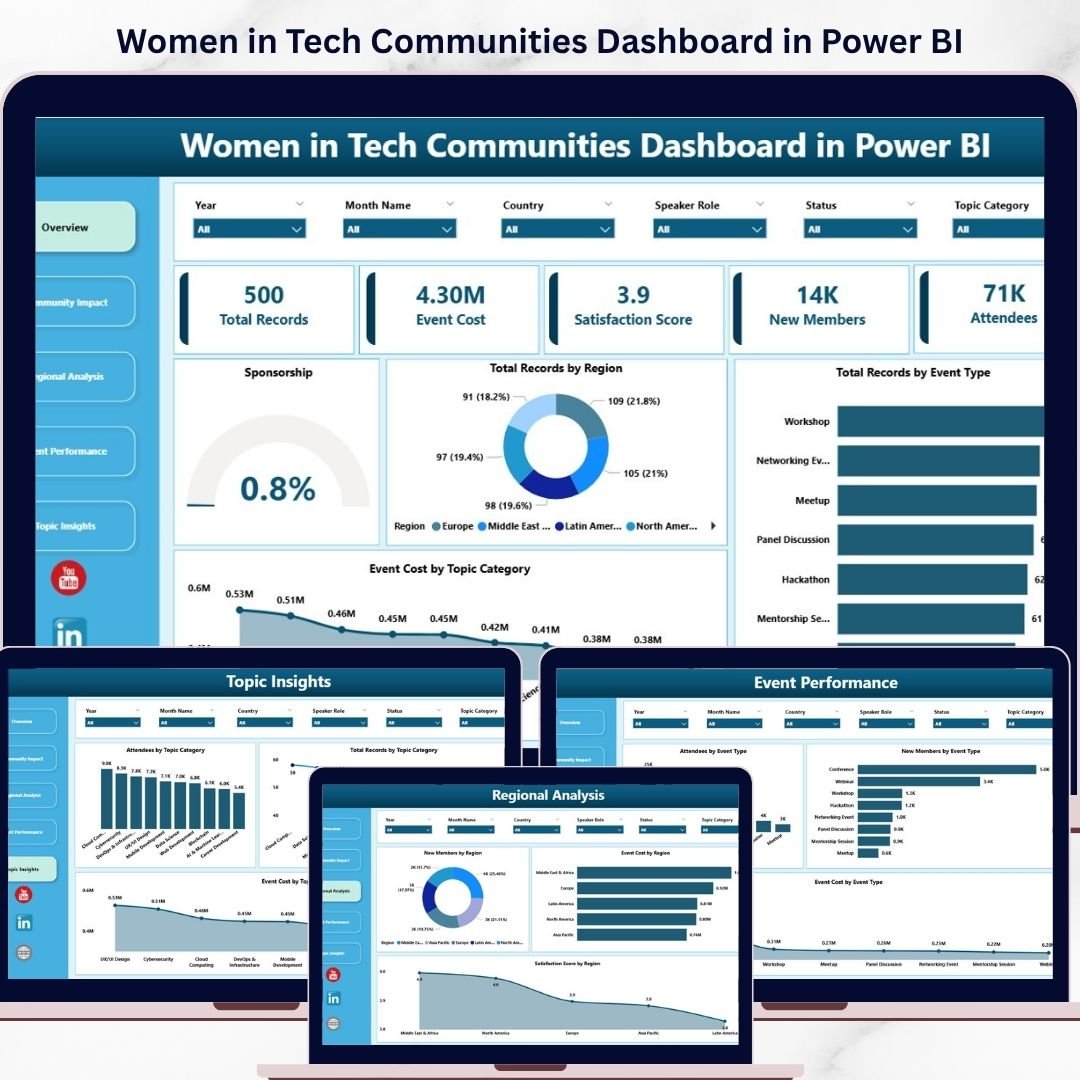
👉 The Women in Tech Communities Dashboard in Power BI is your ultimate solution to analyze, visualize, and grow women’s participation in technology—all in one place.
This ready-to-use dashboard helps organizations, community leaders, and sponsors turn complex datasets into clear, actionable insights. Whether you want to track event participation, measure community growth, or analyze diversity metrics, this dashboard gives you everything you need to make impactful, data-driven decisions.
With a simple data update and refresh, you can instantly view real-time insights without any manual effort. No complicated setup—just powerful analytics at your fingertips.
🔑 Key Features of Women in Tech Communities Dashboard in Power BI
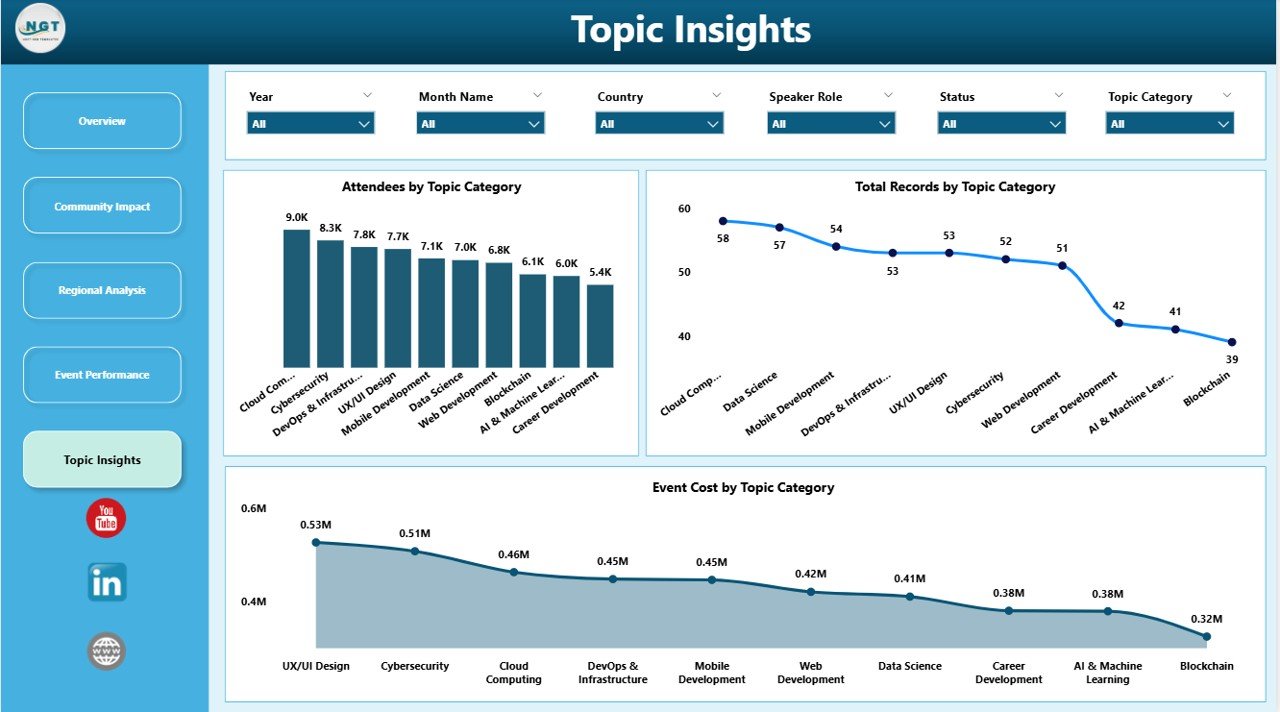
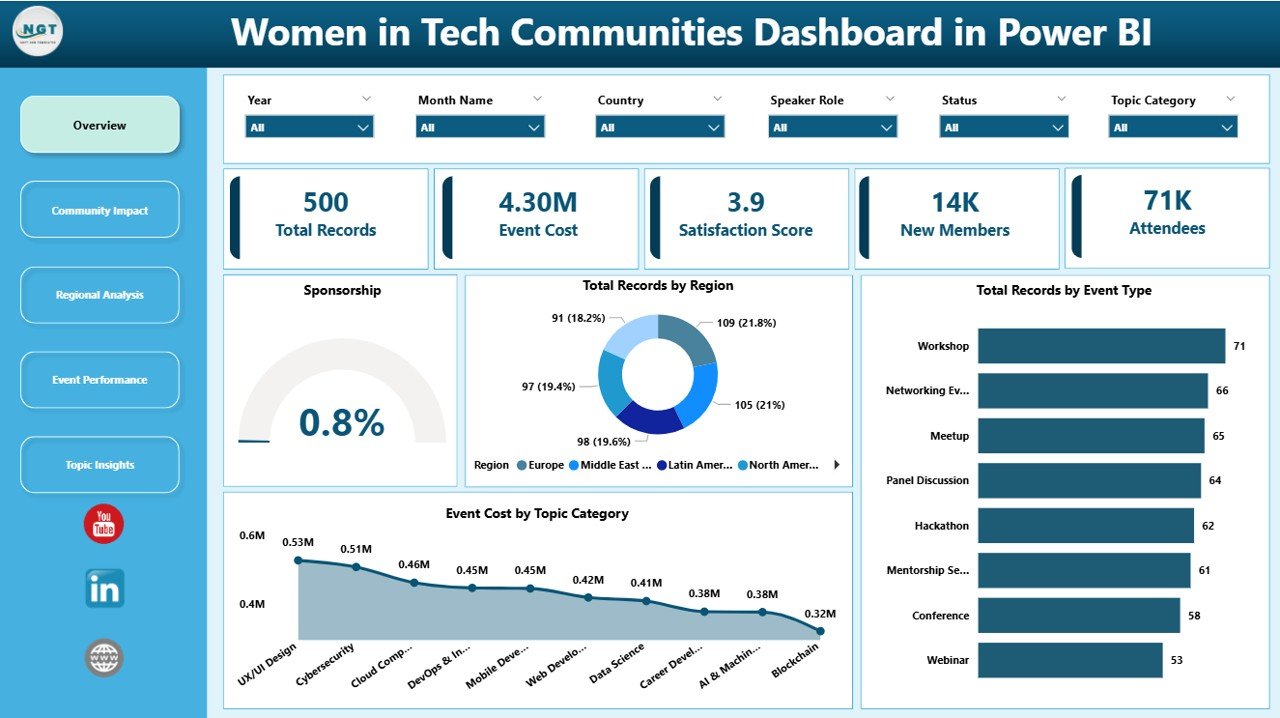
✨ Interactive Multi-Page Dashboard – Explore insights across Overview, Participation Metrics, Diversity Insights, Growth Analysis, and Engagement pages.
📊 Comprehensive KPI Tracking – Monitor participation, growth rate, event attendance, and diversity metrics easily.
🎯 Advanced Filters & Slicers – Drill down into data by region, role, age group, and more.
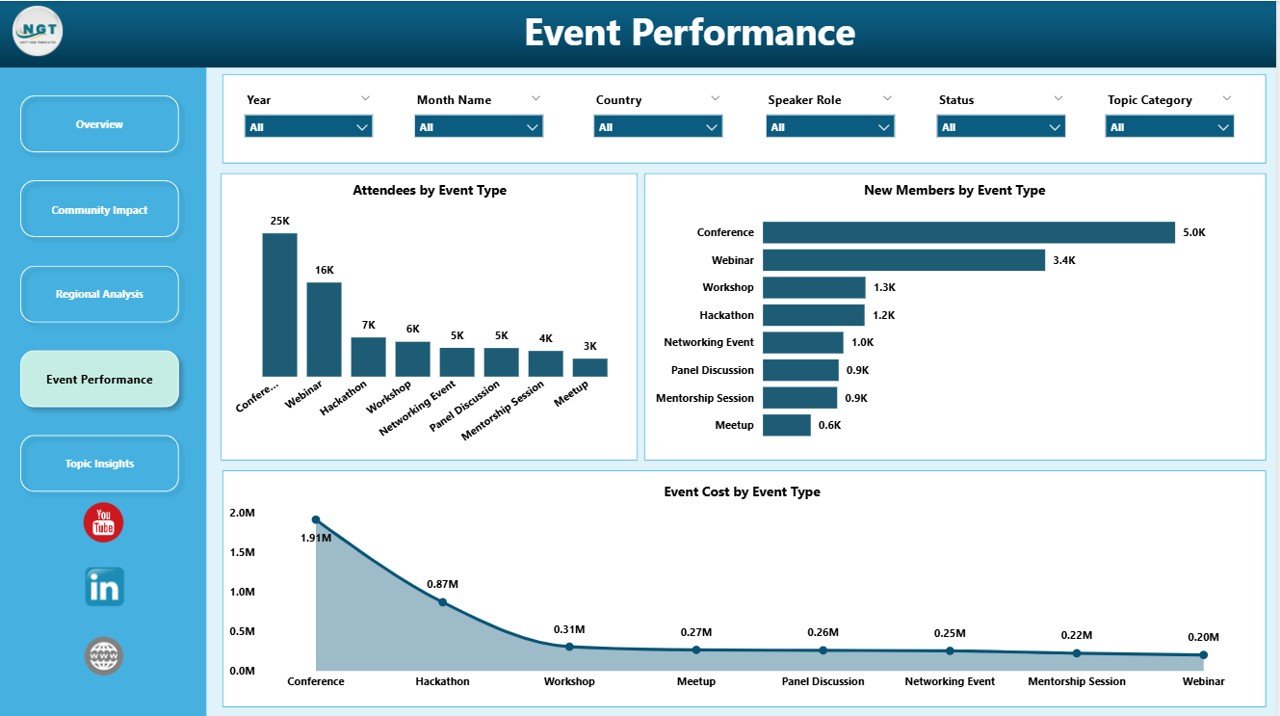
📈 Dynamic Visualizations – Understand trends, patterns, and performance with interactive charts.
⚡ Instant Data Refresh – Update your Excel data and refresh the dashboard with one click.
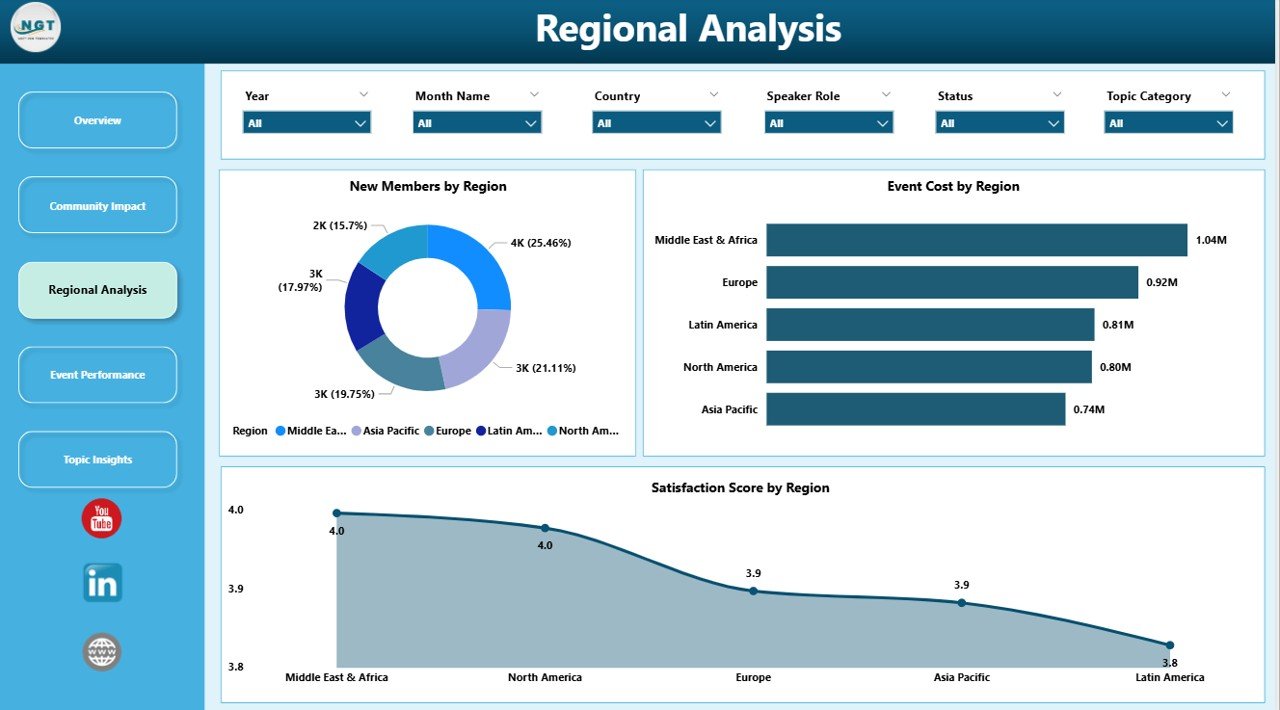
🌍 Diversity & Inclusion Insights – Track representation across demographics and identify gaps.
📅 Trend Analysis Over Time – Monitor growth and engagement patterns for long-term planning.
🧠 User-Friendly Interface – Designed for both beginners and professionals to use effortlessly.
📦 What’s Inside the Women in Tech Communities Dashboard in Power BI
📁 5 Fully Interactive Dashboard Pages
- Overview Dashboard
- Participation Metrics Analysis
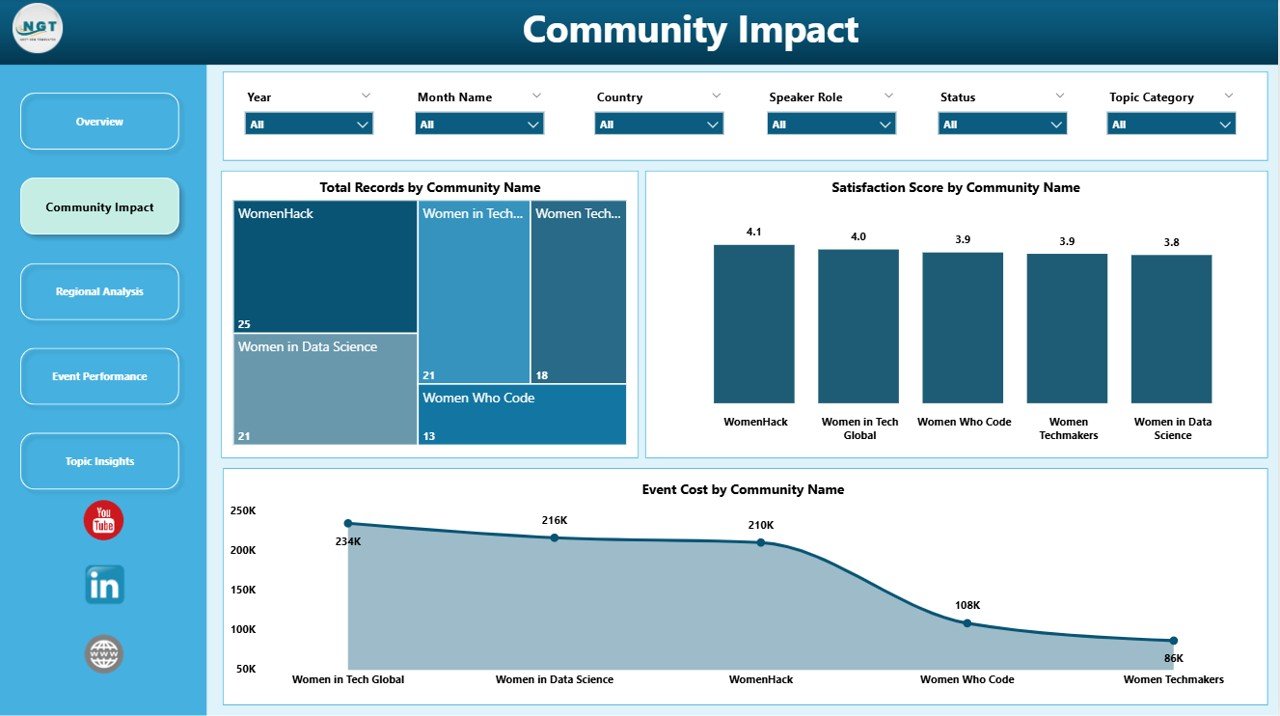
- Diversity & Inclusion Insights
- Growth and Impact Analysis
- Feedback & Engagement Analysis
📊 Pre-Built Charts & KPIs
- Total Members & Growth Rate
- Event Attendance Metrics
- Diversity Statistics (Age, Role, Education)
- Engagement & Feedback Scores
🎛️ Interactive Filters & Slicers
- Filter by Region
- Filter by Role
- Filter by Demographics
📂 Ready-to-Use Power BI File
- Fully designed dashboard
- Plug-and-play setup
- Easy customization
⚙️ How to Use the Women in Tech Communities Dashboard in Power BI
1️⃣ Open the Power BI file after downloading
2️⃣ Update your data in the connected Excel Data sheet
3️⃣ Click Refresh to update visuals instantly
4️⃣ Use slicers to explore specific segments
5️⃣ Analyze KPIs and trends to make impactful decisions
💡 No advanced technical skills required—this dashboard is designed for simplicity and efficiency.
👥 Who Can Benefit from This Women in Tech Communities Dashboard in Power BI
👩💻 Community Managers – Track engagement and improve community growth
🎤 Event Organizers – Analyze participation and event success
🏢 Organizations & NGOs – Promote diversity and inclusion initiatives
📊 Data Analysts – Gain deeper insights into community performance
💼 Sponsors & Stakeholders – Measure impact and optimize investments
This dashboard empowers you to transform community data into meaningful insights. As a result, you can identify opportunities, improve engagement, and drive stronger participation of women in technology.
Instead of relying on scattered reports, you can now manage everything in one centralized dashboard—efficiently and professionally.


