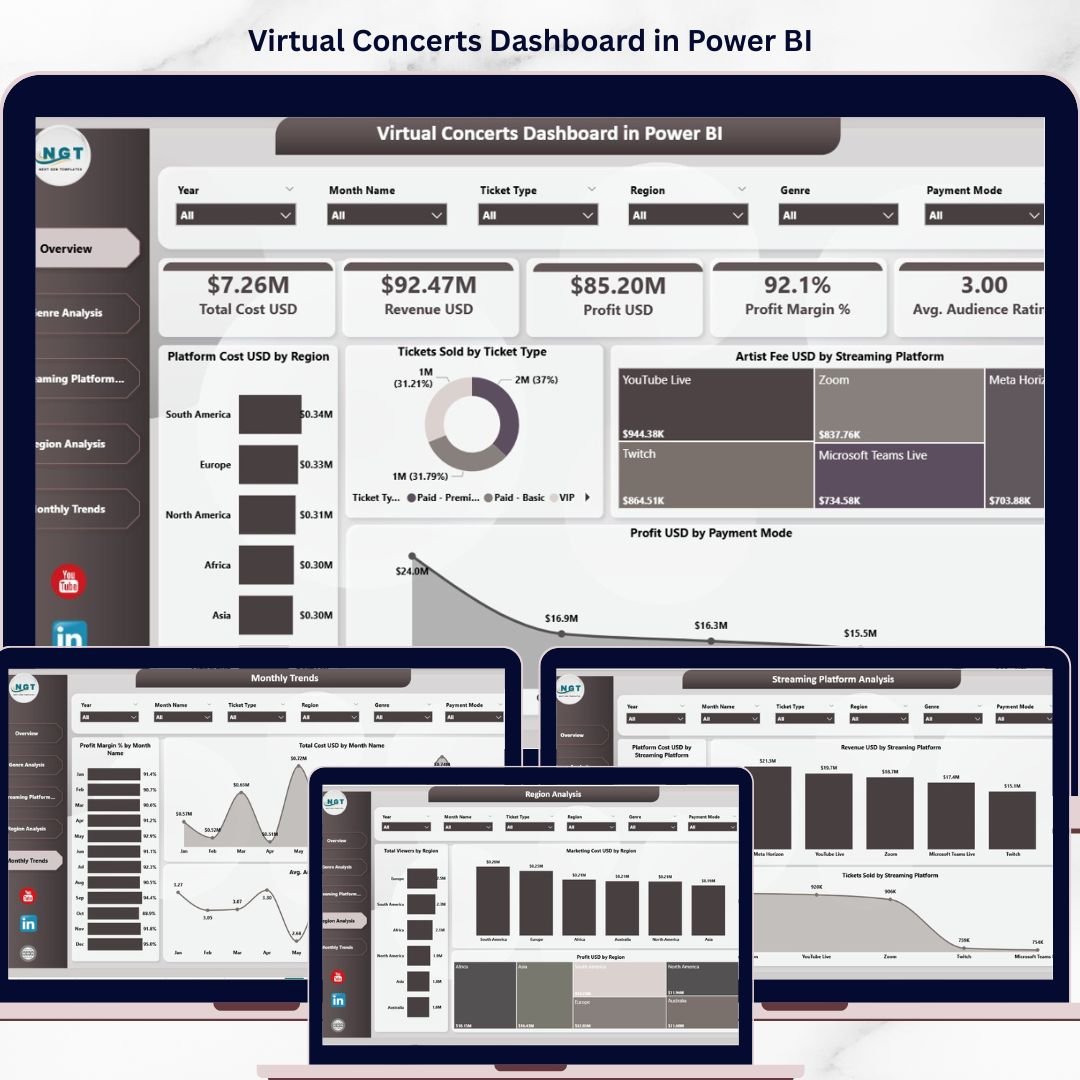


Virtual Concerts Dashboard in Power BI is a professionally designed, ready-to-use analytics template built for event organizers, music production companies, streaming platforms, and artist managers who want to monitor ticket sales, revenue, platform costs, artist fees, audience engagement, and profitability across virtual concert operations. If you are still managing virtual event data in scattered spreadsheets, this Power BI dashboard will completely transform the way you track, analyze, and optimize your virtual concert business 🎵📊.
This interactive dashboard features 5 beautifully designed analysis pages covering an overview of key financial metrics, genre-level performance, streaming platform comparisons, regional breakdowns, and monthly trend tracking. With dynamic slicers and filters, you can instantly drill down into any dimension — genre, region, streaming platform, payment mode, ticket type — and uncover the insights that drive better business decisions.
🔑 Key Features of Virtual Concerts Dashboard in Power BI
🎤 5 Interactive Dashboard Pages – Overview, Genre Analysis, Streaming Platform Analysis, Region Analysis, and Monthly Trends provide a complete 360-degree view of your virtual concert operations.
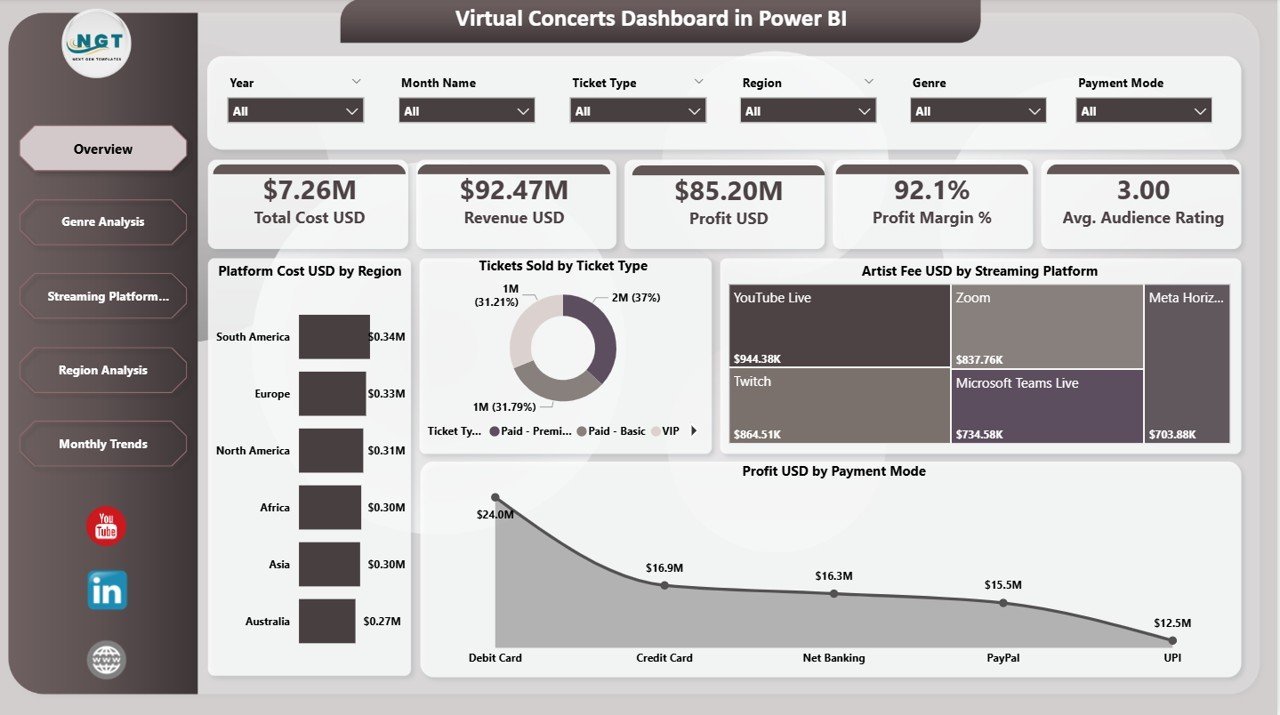
📊 High-Level KPI Cards – Instantly track Total Cost USD, Revenue USD, Profit USD, Profit Margin %, and Avg. Audience Rating at the top of the Overview page for executive-level insights.
🎛️ Dynamic Slicers and Filters – Apply filters instantly by genre, region, streaming platform, ticket type, and payment mode to explore specific data segments with one click.
💰 Revenue and Profit Tracking – Monitor platform costs, artist fees, revenue, and profit across multiple dimensions including genre, region, and streaming platform.
🎶 Genre Performance Insights – Compare Marketing Cost, Revenue, and Profit Margin % across different music genres to identify your most profitable content categories.
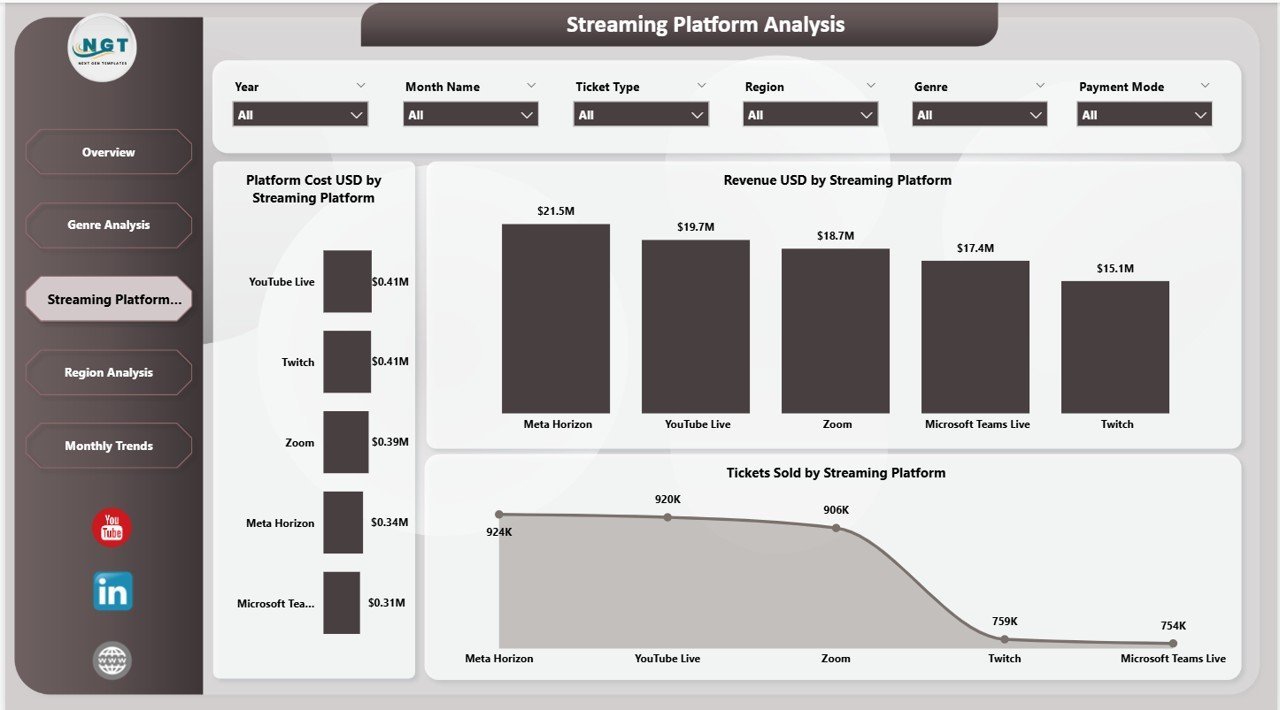
📡 Streaming Platform Evaluation – Analyze Platform Cost, Revenue, and Tickets Sold by Streaming Platform to determine which platforms deliver the best return on investment.
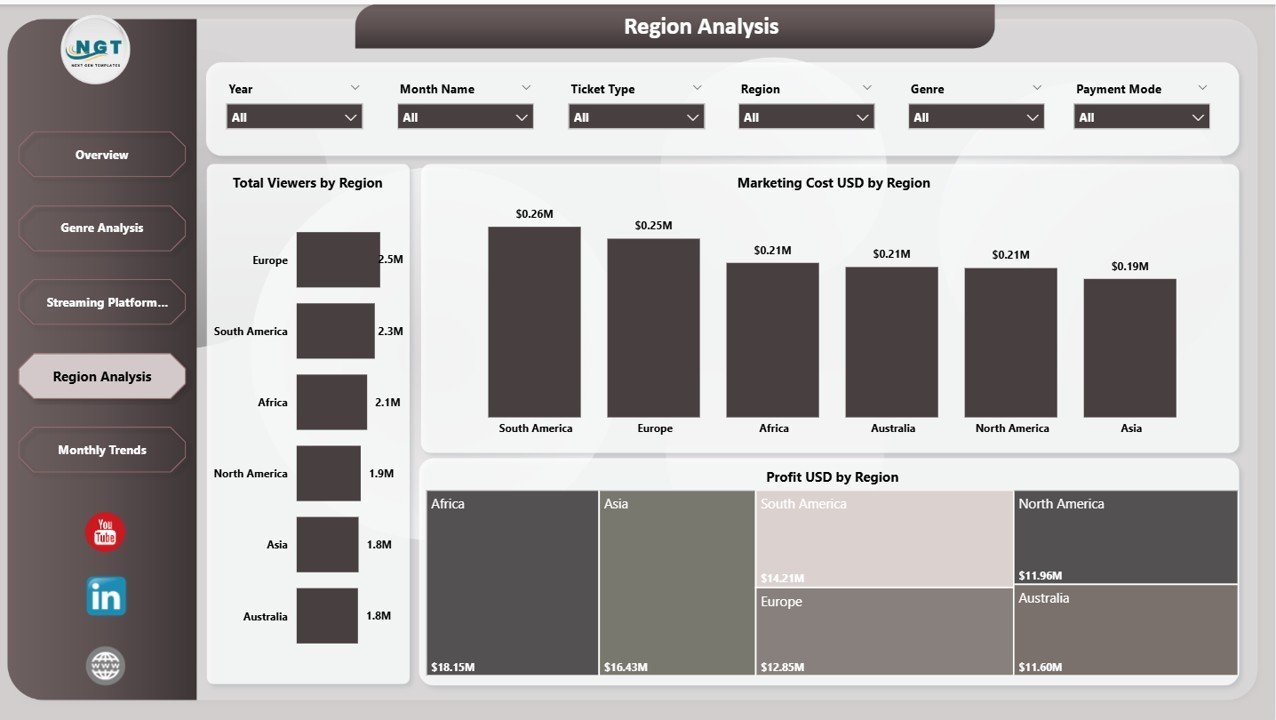
🌍 Regional Performance Analysis – Track Total Viewers, Marketing Cost, and Profit by Region to identify top-performing geographic markets for virtual events.
📅 Monthly Trend Monitoring – Spot seasonal patterns with Profit Margin %, Total Cost, and Avg. Audience Rating trends by month for smarter planning and forecasting.
📦 What’s Inside the Virtual Concerts Dashboard in Power BI
This dashboard includes 5 interactive analytical pages designed to provide comprehensive virtual concert performance insights:
📊 Page 1 – Overview Page
Your command center for virtual concert monitoring. At the top, KPI cards display Total Cost USD, Revenue USD, Profit USD, Profit Margin %, and Avg. Audience Rating. Below, interactive charts present Platform Cost USD by Region showing regional spending patterns, Tickets Sold by Ticket Type revealing ticket category distribution, Artist Fee USD by Streaming Platform comparing platform-wise artist costs, and Profit USD by Payment Mode tracking payment channel profitability. Multiple slicers allow instant filtering for focused analysis.

Overview Page
🎶 Page 2 – Genre Analysis
Dive deep into genre-level performance with charts showing Marketing Cost USD by Genre comparing promotional spending across music categories, Revenue USD by Genre identifying top-earning genres, and Profit Margin % by Genre revealing which genres deliver the highest returns. This page helps you optimize your genre strategy and marketing budget allocation.
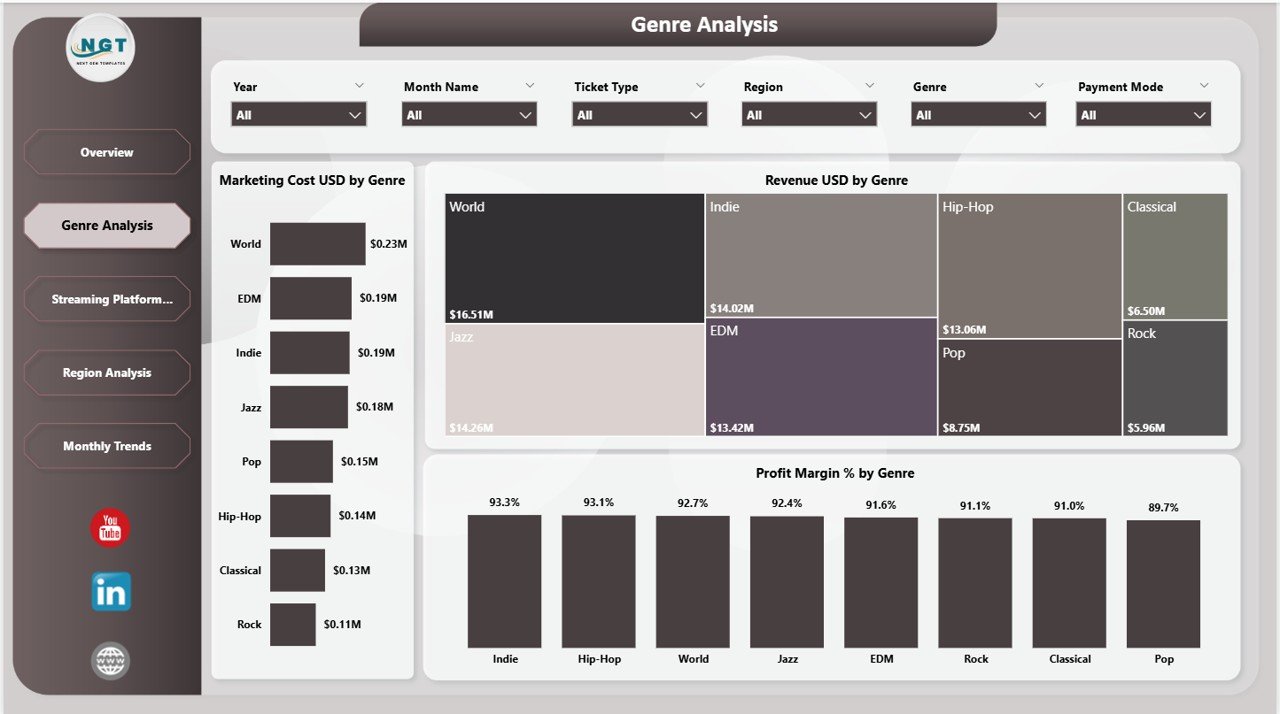
Genre Analysis
📡 Page 3 – Streaming Platform Analysis
Evaluate streaming platform effectiveness with Platform Cost USD by Streaming Platform tracking operational costs per platform, Revenue USD by Streaming Platform comparing revenue generation, and Tickets Sold by Streaming Platform measuring audience reach across platforms. Perfect for deciding where to invest your streaming resources. Explore more Power BI Dashboard Templates for additional analytics solutions.

Streaming Platform Analysis
🌍 Page 4 – Region Analysis
Understand geographic performance with Total Viewers by Region measuring audience reach, Marketing Cost USD by Region tracking promotional spend by geography, and Profit USD by Region identifying your most profitable markets. Also check out the Virtual Concerts Dashboard in Excel for a spreadsheet-based alternative.

Region Analysis
📅 Page 5 – Monthly Trends
Track time-based performance with Profit Margin % by Month Name monitoring profitability trends, Total Cost USD by Month Name tracking expense patterns, and Avg. Audience Rating by Month Name measuring viewer satisfaction over time. Essential for seasonal planning and long-term event strategy.
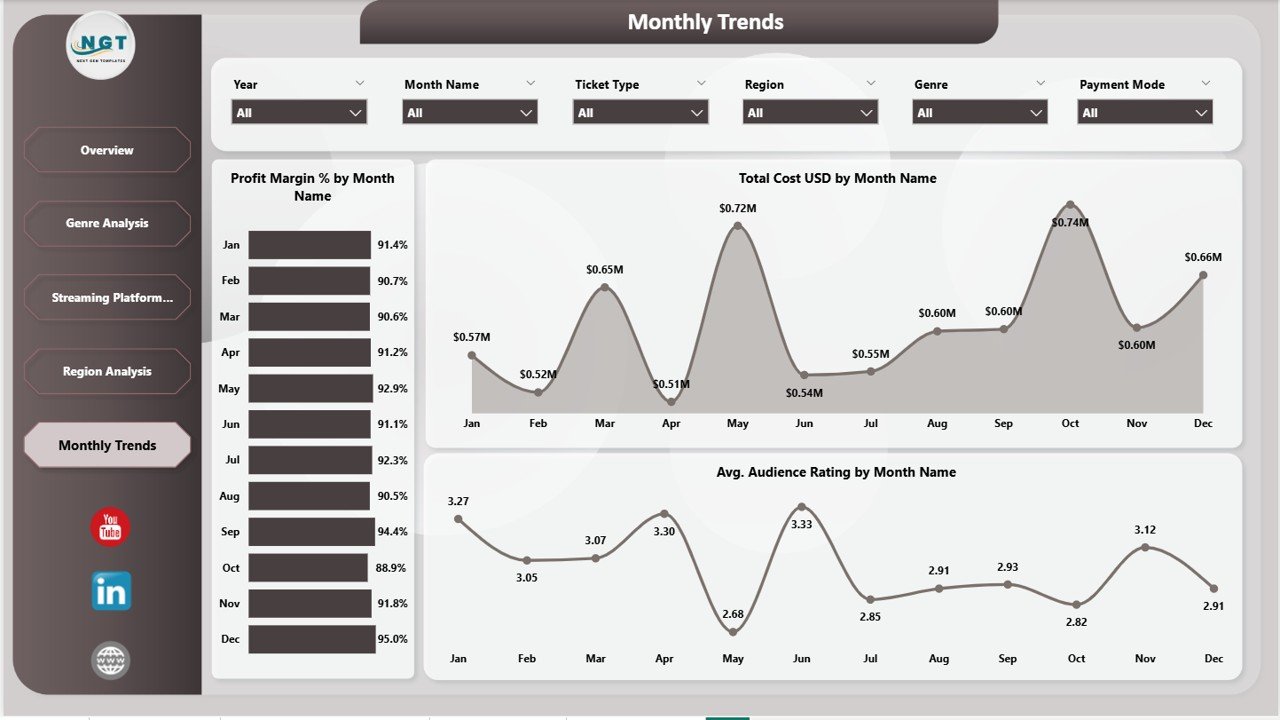
Monthly Trends
⚙️ How to Use the Virtual Concerts Dashboard in Power BI
1️⃣ Download and Open – Download the .pbix file and open it in Power BI Desktop (free from Microsoft).
2️⃣ Review Sample Data – Explore the preloaded sample data to understand all 5 dashboard pages and their features.
3️⃣ Replace with Your Data – Update the data source with your actual virtual concert records in the same column format.
4️⃣ Refresh the Dashboard – Click Refresh in Power BI to update all charts and KPI cards automatically.
5️⃣ Apply Filters – Use the slicers on each page to filter by genre, region, streaming platform, ticket type, and payment mode.
6️⃣ Present and Decide – Share insights with your team and make data-backed decisions to improve profitability and audience engagement.
👥 Who Can Benefit from This Virtual Concerts Dashboard in Power BI
🎤 Virtual Event Organizers – Track profitability, platform costs, and audience response across all virtual concerts.
🎵 Music Production Companies – Analyze genre and platform performance to optimize content strategy.
🎸 Artist Management Teams – Understand revenue and engagement trends to negotiate better streaming deals.
📡 Streaming Platforms – Compare platform-wise performance metrics and viewer satisfaction ratings.
📊 Marketing and Finance Teams – Optimize marketing spend, pricing strategies, and revenue forecasting for virtual events.
❓ Frequently Asked Questions
What KPIs does the Virtual Concerts Dashboard in Power BI track?
The Virtual Concerts Dashboard in Power BI tracks 5 key metrics including Total Cost USD, Revenue USD, Profit USD, Profit Margin %, and Avg. Audience Rating across 5 interactive pages covering genre, platform, region, and monthly trends.
Can I use this dashboard to compare streaming platform performance?
Yes. The Streaming Platform Analysis page lets you compare Platform Cost, Revenue, and Tickets Sold across different streaming platforms to identify which channels deliver the best ROI for your virtual concerts.
Do I need advanced Power BI skills to use this template?
No. Simply replace the sample data with your own virtual concert records and click Refresh. All charts, KPI cards, and slicers update automatically with zero manual effort.
How is this different from the Virtual Concerts Dashboard in Excel?
The Power BI version offers more advanced interactive filtering, richer visual capabilities, and the ability to publish dashboards to the Power BI Service for team-wide cloud access. The Excel version is ideal if you prefer working offline in spreadsheets.
What types of virtual events can this dashboard track?
This dashboard is designed for any virtual or hybrid live event including online concerts, virtual music festivals, live streaming shows, webcast performances, and digital entertainment events across any genre or platform.
🔗 Explore Related Templates
🎵 Virtual Concerts Dashboard in Excel – The Excel version of this dashboard with pivot-powered charts and interactive slicers.
🎭 Music and Performing Arts Dashboard in Power BI – Track concerts, theatre shows, and live event performance with venue analytics.
📖 Click here to read the Detailed Blog Post
🎥 Visit our YouTube channel to learn step-by-step video tutorials
👉 YouTube.com/@NextGenTemplates
Watch the step-by-step video tutorial:
YouTube


Reviews
There are no reviews yet.