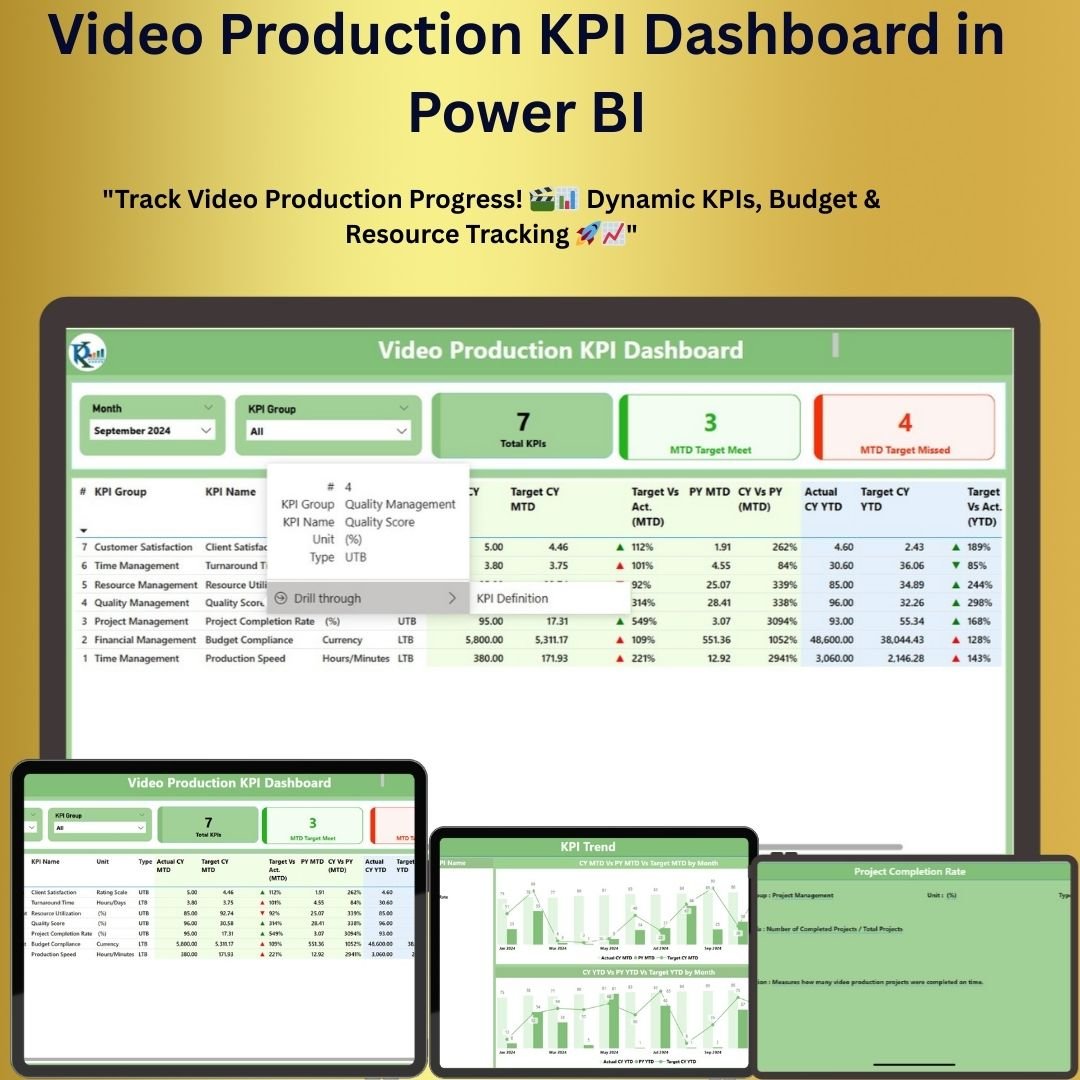
The Video Production KPI Dashboard in Power BI is a comprehensive tool designed to help video production teams track key performance indicators (KPIs) throughout the production process. This dynamic dashboard provides a clear and visually engaging way to monitor production progress, resource utilization, and performance metrics, ensuring that every aspect of the production is optimized for efficiency and quality.
With a clean and customizable design, this dashboard allows production managers to monitor various KPIs such as video completion rates, time spent on different stages of production, resource allocation, and budget adherence. Whether you’re managing a single project or multiple productions, the Video Production KPI Dashboard in Power BI helps you stay on top of every detail.

Key Features of the Video Production KPI Dashboard in Power BI
📌 Comprehensive KPI Tracking
Track essential KPIs for video production, including video completion rates, production costs, time spent in each phase, and resource utilization. This gives you a 360-degree view of your production process.
🛠 Customizable Dashboard
Tailor the dashboard to suit your production team’s needs by adjusting KPIs, charts, and visuals. Whether you’re focused on timelines, budgets, or team performance, you can easily modify the dashboard to meet your specific requirements.
💡 Real-Time Updates
As new data is entered, the dashboard automatically updates, ensuring you always have the most current information available. This real-time functionality allows for better decision-making and more effective project management.
🔢 Dynamic Visualizations
The dashboard includes interactive charts and graphs that dynamically represent your KPIs, making it easier to identify trends, track progress, and spot areas that need attention. Visualizing your data enhances comprehension and accelerates decision-making.
🚀 Resource and Budget Management
Keep track of budget usage and resource allocation across various stages of the video production process. The dashboard helps you ensure that your production stays within budget while optimizing resource utilization.
📊 Clear and Professional Design
The Video Production KPI Dashboard is designed with a professional and easy-to-understand layout. With clear visual indicators, such as progress bars, pie charts, and line graphs, the dashboard ensures that complex data is presented in a simple and digestible format.
⚙ Easy Setup and Customization
The template is user-friendly, with clear instructions that make setting up and customizing the dashboard easy, even for those with little to no Excel experience.
🚀 Why You’ll Love the Video Production KPI Dashboard
✅ Track Key KPIs – Monitor completion rates, budgets, and resource allocation in one place. ✅ Real-Time Updates – Keep your production on track with automatically updated data. ✅ Customizable and Flexible – Tailor the dashboard to meet the unique needs of your production team. ✅ Dynamic Visualizations – Visualize your data with interactive charts and graphs for better insights. ✅ Professional Design – Present your data in a clear, visually appealing way for stakeholders.
📂 What’s Inside the Video Production KPI Dashboard?
- KPI Tracking: Monitor critical KPIs, including production timelines, costs, and team performance.
- Interactive Charts and Graphs: Visualize your data in real-time with dynamic, interactive visuals.
- Budget and Resource Management: Track production costs and resource allocation.
- Customizable Layout: Adjust the dashboard to suit your specific production process.
- Clear Setup Instructions: Easy steps to get started and personalize your dashboard.
🔍 How to Use the Video Production KPI Dashboard
1️⃣ Download the Template – Instant access to the Excel file upon purchase. 2️⃣ Enter Your Data – Input key data such as project milestones, costs, and resource usage. 3️⃣ Customize the Dashboard – Adjust KPIs and visuals to match your production team’s needs. 4️⃣ Track Performance – Use the interactive charts to track the progress of your production in real-time. 5️⃣ Share and Present – Present the dashboard in meetings, reports, or with stakeholders to showcase production progress.
🎯 Who Can Benefit from the Video Production KPI Dashboard? 🔹 Video Production Managers
🔹 Project Managers
🔹 Production Teams
🔹 Budget Analysts
🔹 Marketing and Creative Teams
🔹 Anyone involved in video production project management
Stay on top of your video production process with the Video Production KPI Dashboard. Track KPIs, manage resources and budgets, and ensure your production stays on schedule with this easy-to-use, customizable Excel dashboard.
Click here to read the Detailed blog post
https://www.pk-anexcelexpert.com/video-production-kpi-dashboard/
Visit our YouTube channel to learn step-by-step video tutorials












Reviews
There are no reviews yet.