The video game industry moves fast—and so do development risks. Studios juggle multiple platforms, large creative teams, tight milestones, and rising quality expectations. Yet many teams still rely on disconnected Excel files, manual status updates, and static reports. The result? Limited visibility, late surprises, effort overruns, and missed deadlines.
That’s exactly where the Video Game Development Dashboard in Power BI steps in 🎮📊.
This ready-to-use Power BI dashboard converts raw development data into interactive, visual, and actionable insights. It gives producers, project managers, leads, and studio heads a single, centralized view of tasks, effort, overruns, and priorities—so teams can make faster decisions and deliver games on time and within budget.
🔑 Key Features of Video Game Development Dashboard in Power BI
📊 Centralized Development Visibility
Track tasks, effort, priorities, and progress in one interactive Power BI dashboard—no more scattered reports.
⏱️ Planned vs Actual Effort Tracking
Compare estimated effort with actual hours to spot overruns early and protect timelines.
🚦 Overrun & Risk Detection
Identify phases, platforms, or task types that are driving delays before they escalate.
📈 Multi-Dimensional Analysis
Analyze performance by platform, development phase, task type, priority, and month using slicers.
🧭 Executive-Ready Visuals
KPI cards, trend charts, and comparative visuals provide instant clarity for reviews.
🔄 Dynamic & Scalable
Power BI refreshes visuals automatically as data updates, supporting single or multiple projects.
📦 What’s Inside the Video Game Development Dashboard in Power BI
This solution includes five analytical pages, each focused on a critical area of game development performance:
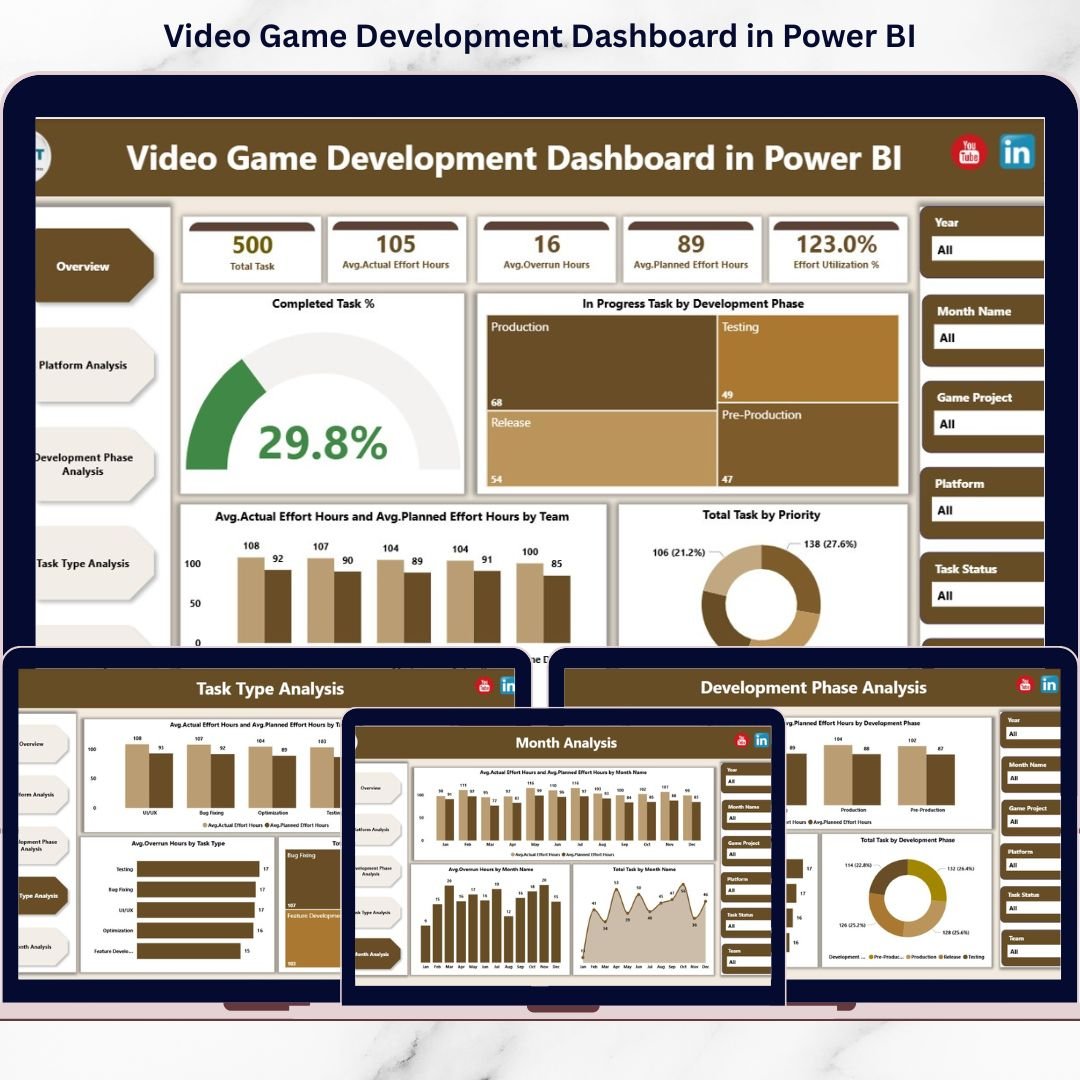
📌 Overview Page
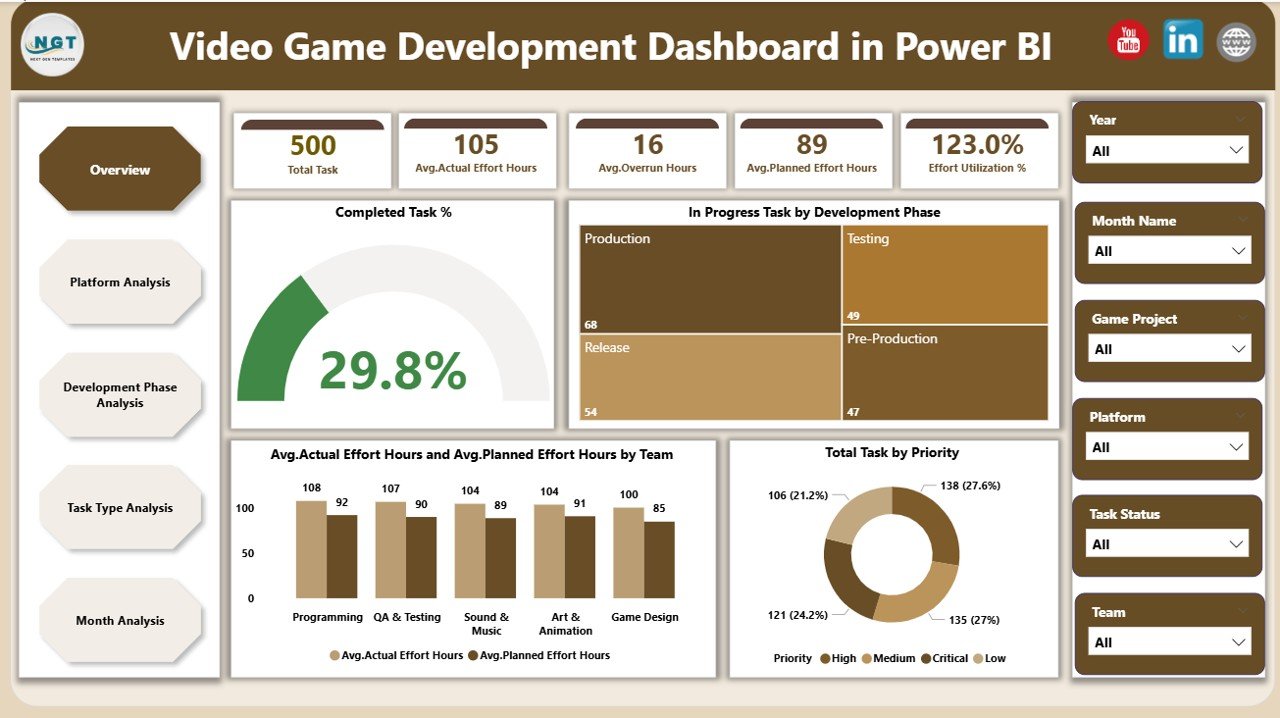
Your command center for project health.
-
KPI cards for completed tasks, in-progress workload, and effort metrics
-
Charts for task distribution by priority, phase-wise progress, and effort comparison
-
Slicers for instant filtering
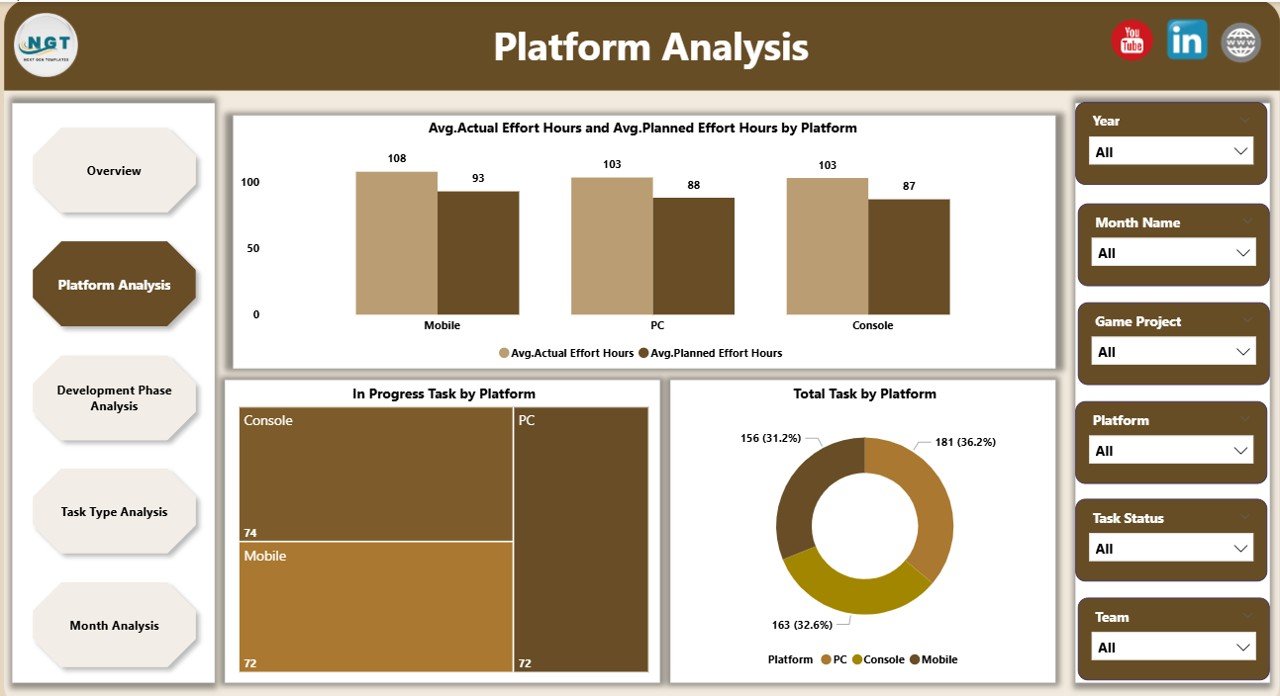
🕹️ Platform Analysis Page
Understand how different platforms impact effort and timelines.
-
Avg. Actual vs Avg. Planned Effort by Platform
-
In-Progress Tasks by Platform
-
Total Tasks by Platform
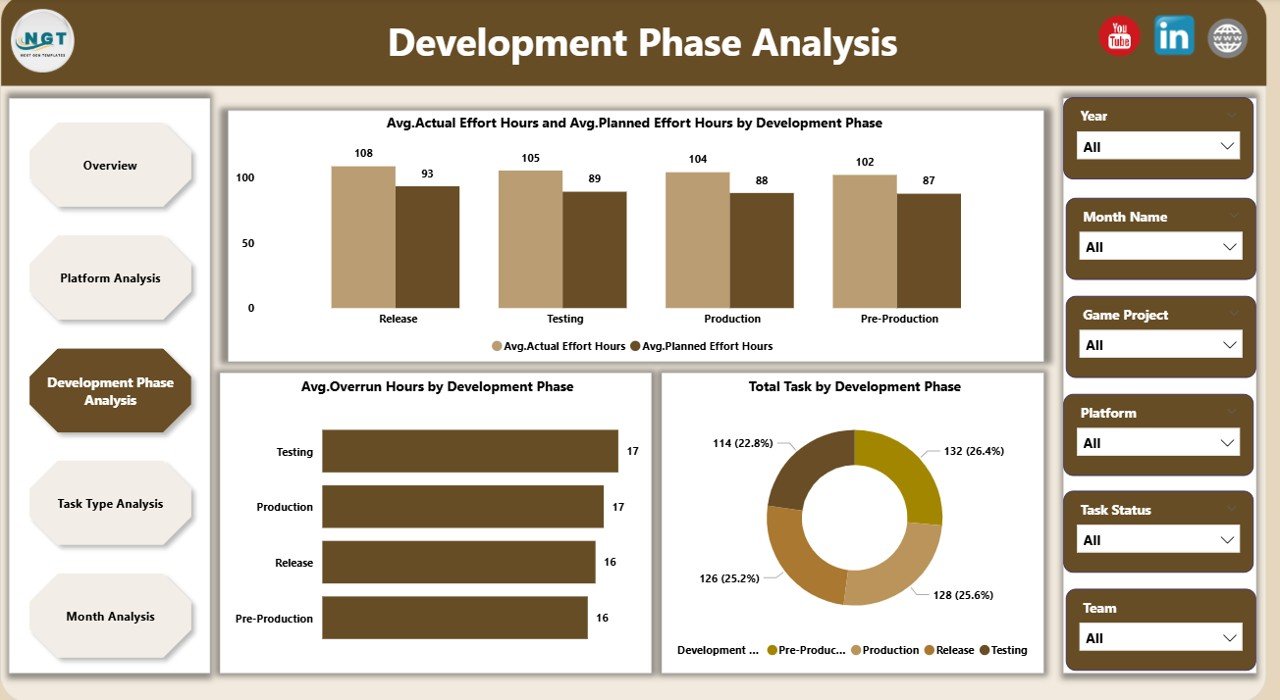
🧩 Development Phase Analysis Page
Track performance across concept, design, development, testing, and release.
-
Avg. Actual vs Avg. Planned Effort by Phase
-
Avg. Overrun Hours by Phase
-
Total Tasks by Phase
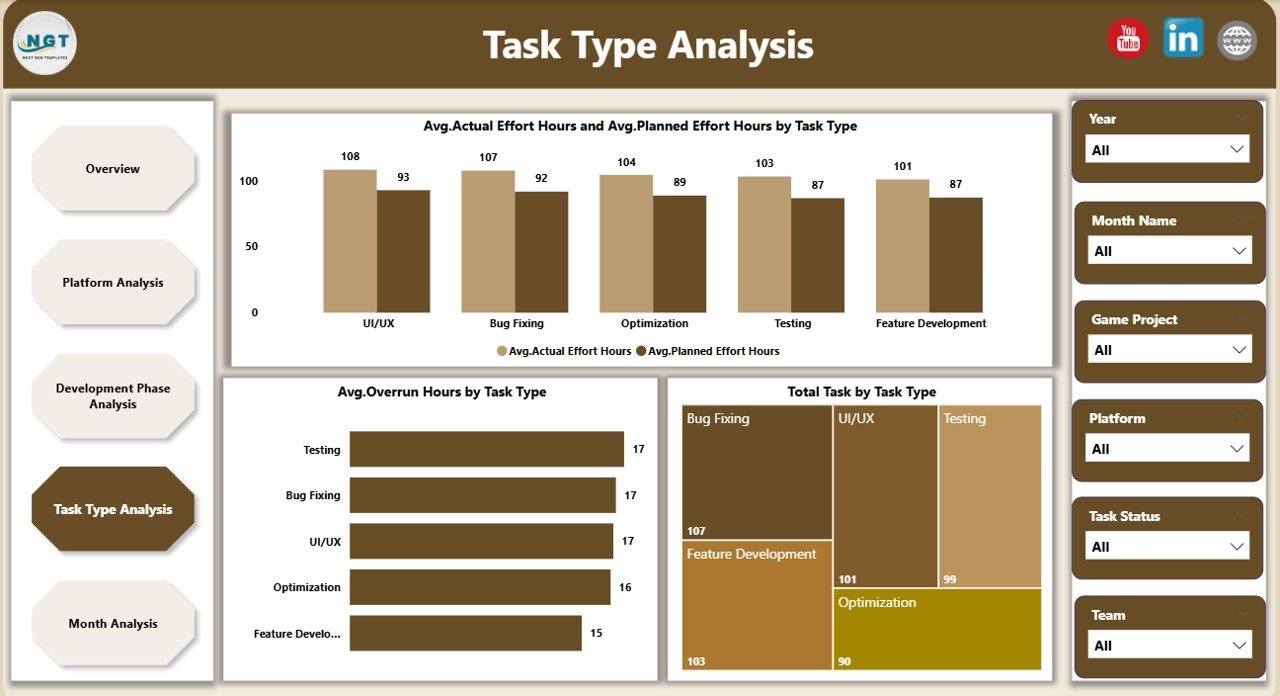
🧠 Task Type Analysis Page
Optimize productivity across task categories.
-
Avg. Actual vs Avg. Planned Effort by Task Type
-
Avg. Overrun Hours by Task Type
-
Total Tasks by Task Type
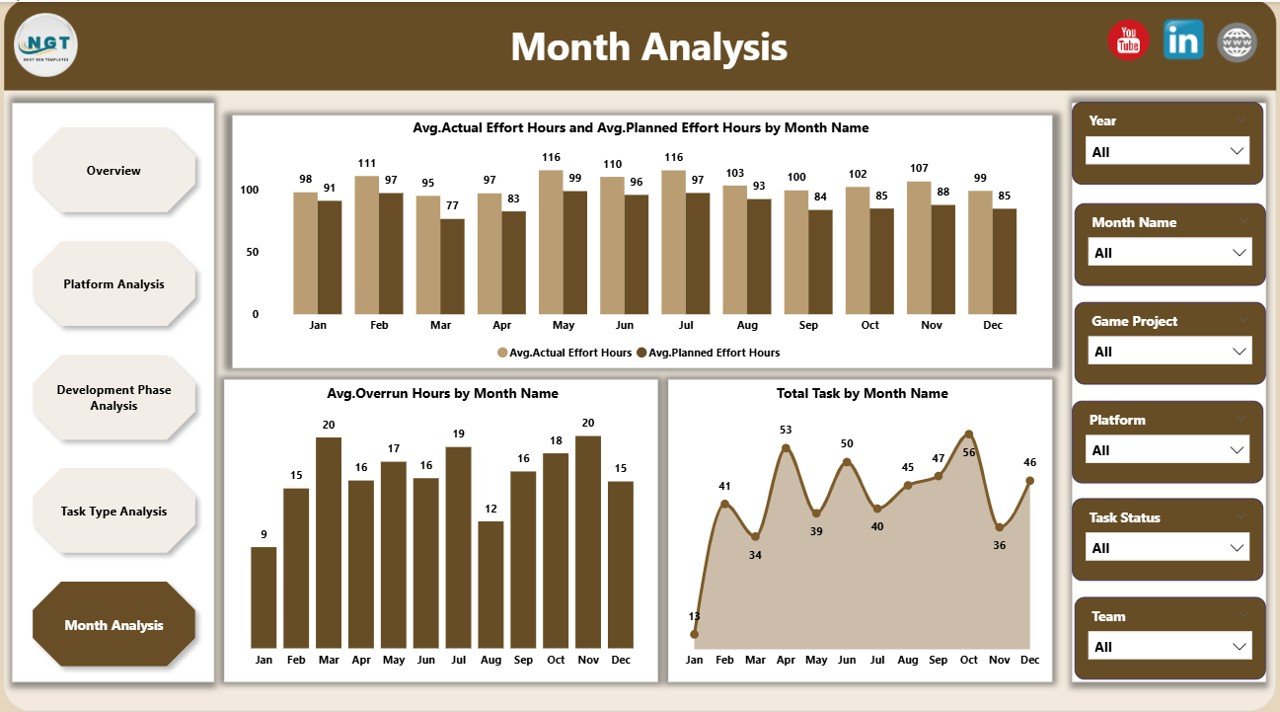
📅 Month Analysis Page
Monitor trends and seasonality.
-
Avg. Actual vs Avg. Planned Effort by Month
-
Avg. Overrun Hours by Month
-
Total Tasks by Month
Together, these pages deliver full-spectrum visibility—from daily execution to long-term planning.
🛠️ How to Use the Video Game Development Dashboard in Power BI
Getting started is simple:
1️⃣ Update development data (tasks, effort, phases, platforms) in your source file
2️⃣ Refresh the Power BI dashboard
3️⃣ Use slicers to filter by platform, phase, task type, or month
4️⃣ Review KPIs, trends, and overrun indicators
5️⃣ Identify risks and reallocate resources
6️⃣ Make confident, data-driven decisions
Within minutes, your project data turns into insights you can act on.
👥 Who Can Benefit from This Video Game Development Dashboard in Power BI
🎮 Game Producers
📋 Project Managers
🧑💻 Development Leads
🏢 Studio Heads
⚙️ Operations & PMO Teams
💰 Finance & Planning Teams
Whether you’re an indie studio or a growing publisher, this dashboard scales with your needs.