TV Channels Dashboard one of the most influential media channels for advertising, branding, and audience engagement. Broadcasters and media planners manage multiple TV channels, platforms, regions, and content genres every day. At the same time, they must track TRP ratings, ad revenue, impressions, viewers, and ad duration accurately. However, when this data stays scattered across spreadsheets and static reports, insights remain hidden and decisions slow down.
That is exactly why the TV Channels Dashboard in Excel becomes a powerful and practical analytical solution 🚀.
This ready-to-use Excel dashboard transforms raw television data into clear, interactive, and actionable insights. Instead of juggling multiple Excel files, you get a single, structured dashboard that consolidates all critical TV performance metrics. Because it is built entirely in Excel, teams can analyze performance quickly without relying on expensive BI tools or complex setups.
Whether your goal is improving ad revenue, understanding audience behavior, optimizing content strategy, or comparing platform performance, this dashboard helps media teams move from reactive reporting to proactive decision-making.
🔑 Key Features of TV Channels Dashboard in Excel
📊 Centralized TV Performance Analytics – Track TRP, ad revenue, impressions, viewers, and ad duration in one dashboard
🎯 Interactive Slicers – Filter data by channel, genre, region, platform, and month
🧭 Page Navigator – Seamlessly switch between dashboard pages from the left-side navigation
💰 Ad Revenue Insights – Analyze revenue by platform, ad type, genre, and region
📈 Audience & Engagement Tracking – Monitor TRP ratings, viewers, and impressions
🌍 Multi-Dimensional Analysis – Compare performance across regions, genres, and platforms
⚡ Auto-Updating Excel Visuals – Update the data sheet and refresh the entire dashboard instantly
🧩 Fully Customizable – Modify KPIs, charts, and slicers without technical complexity
📂 What’s Inside the TV Channels Dashboard in Excel
This digital product includes five structured analytical pages, each designed to answer a specific media performance question:
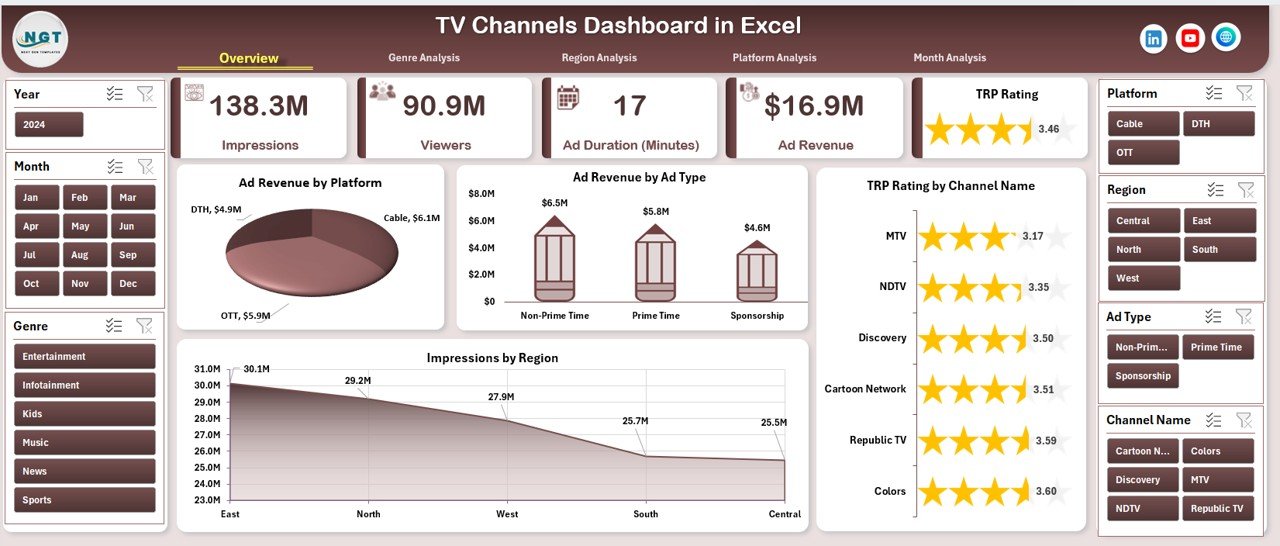
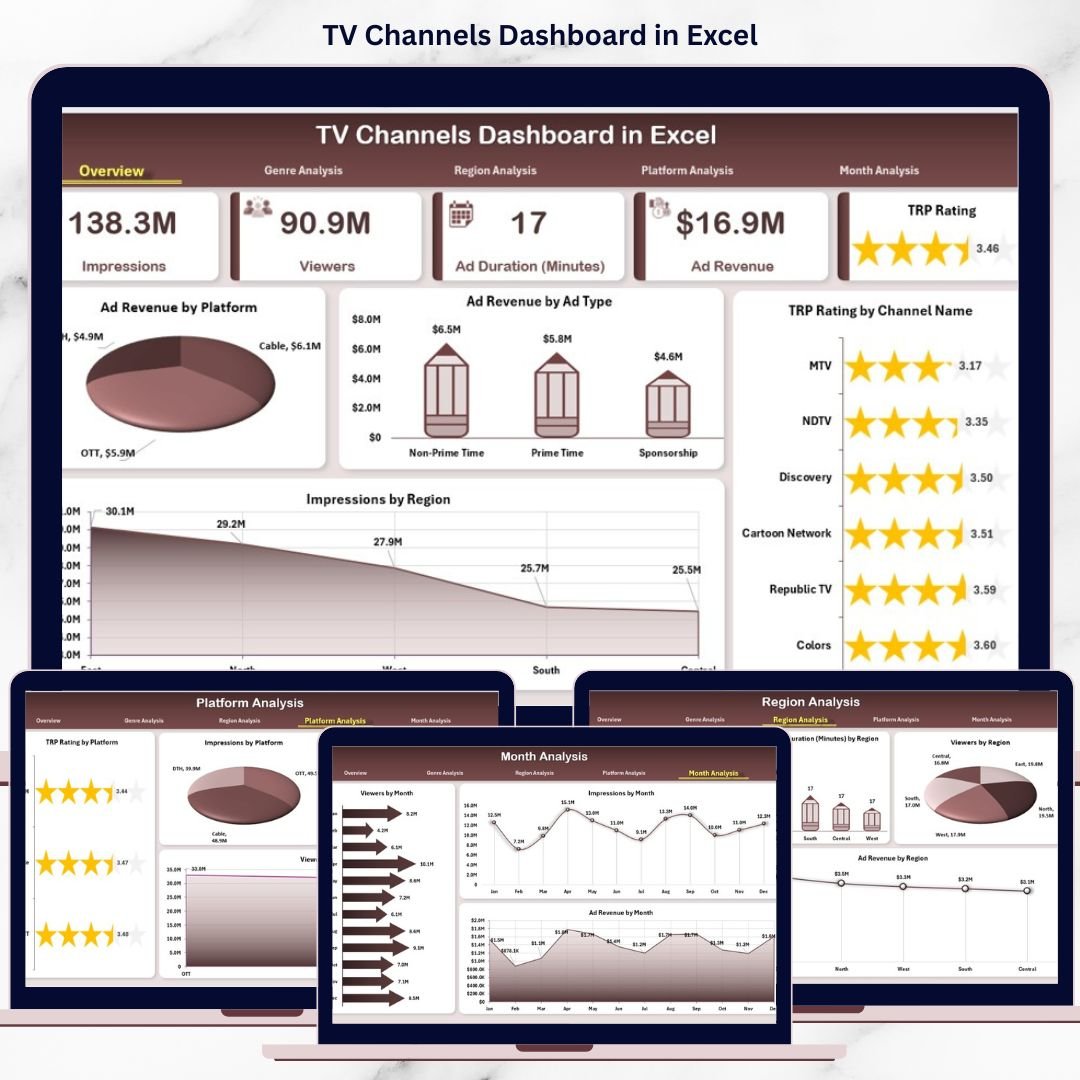
📌 Overview Page – High-level snapshot with KPI cards and charts showing ad revenue by platform, ad revenue by ad type, TRP rating by channel name, and impressions by region
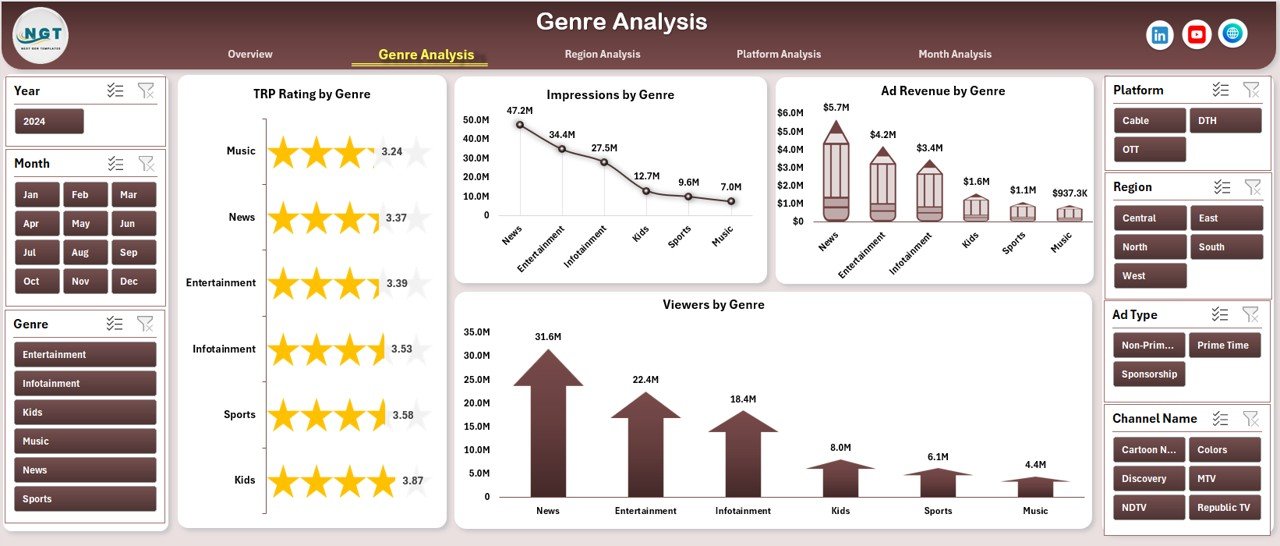
📌 Genre Analysis Page – Analyze TRP ratings, impressions, ad revenue, and viewers by genre
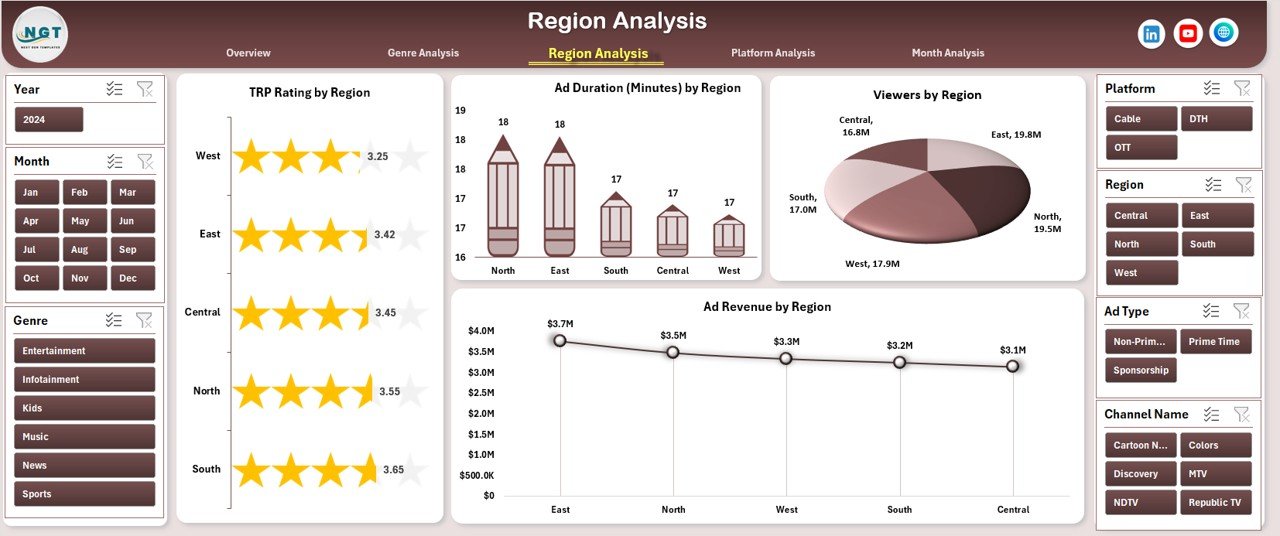
📌 Region Analysis Page – Compare TRP ratings, ad duration, viewers, and ad revenue across regions
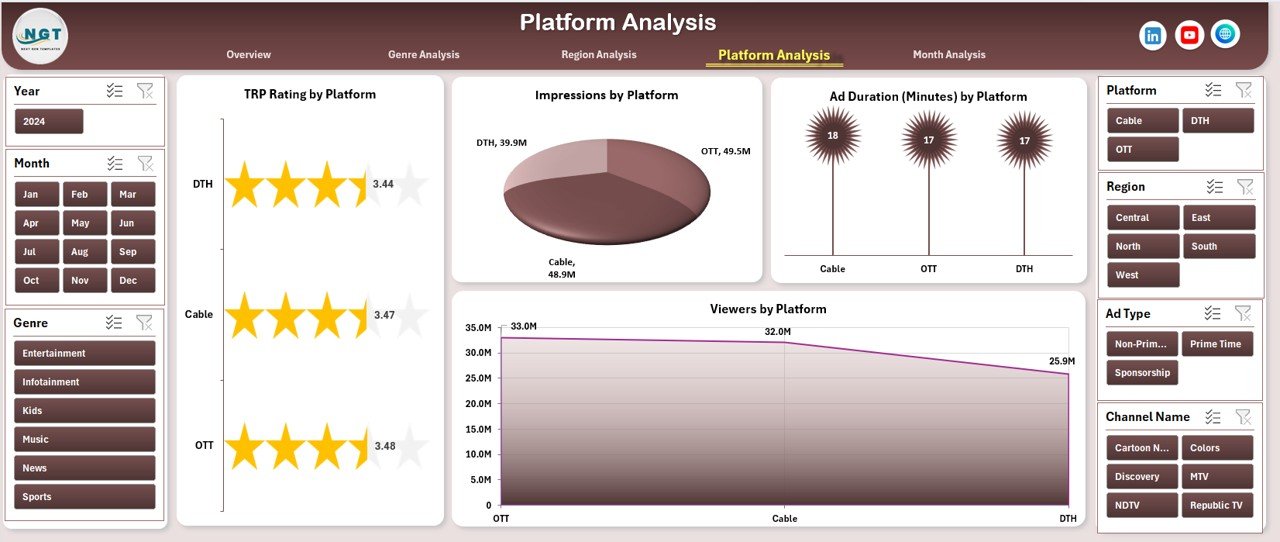
📌 Platform Analysis Page – Evaluate TRP ratings, ad duration, viewers, and impressions by platform
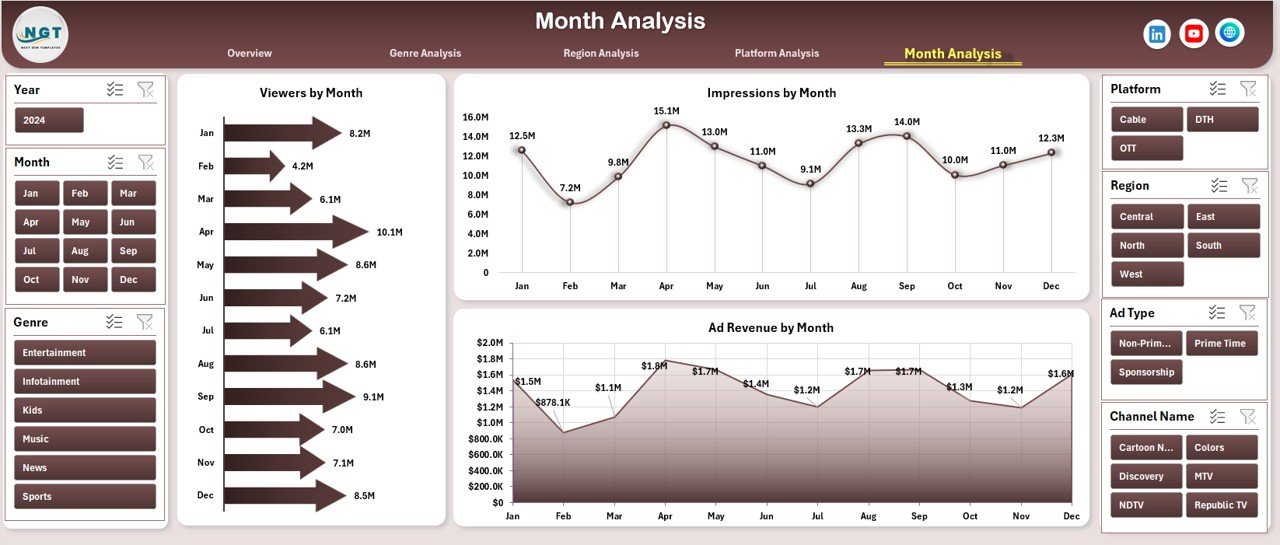
📌 Month Analysis Page – Track viewers, impressions, and ad revenue trends over time
In addition, the dashboard uses a Data Sheet as the single source of truth and a Support Sheet for helper calculations, ensuring accuracy and easy maintenance.
🛠️ How to Use the TV Channels Dashboard in Excel
Using this dashboard is simple and intuitive:
1️⃣ Enter or update TV channel data in the Data Sheet
2️⃣ Use the Page Navigator to move between analysis pages
3️⃣ Apply slicers to filter by channel, genre, region, platform, or month
4️⃣ Start with the Overview Page for instant performance clarity
5️⃣ Drill into genre, region, or platform insights
6️⃣ Review monthly trends for forecasting and planning
7️⃣ Share insights with stakeholders using one professional Excel dashboard
No macros. No advanced Excel skills. Just fast, reliable insights.
👥 Who Can Benefit from This TV Channels Dashboard in Excel
This dashboard is ideal for:
📺 TV Broadcasters & Channel Managers – Monitor performance across channels
📢 Advertising Agencies – Optimize ad placement and revenue strategies
📊 Media Planners & Analysts – Compare platforms, genres, and regions
🏢 Media Networks & Production Houses – Improve content and scheduling decisions
📈 Marketing & Brand Teams – Understand audience reach and engagement
🚀 Non-Technical Users – Gain insights quickly using Excel
Because Excel is widely used, adoption is fast and seamless.


Reviews
There are no reviews yet.