
Managing transportation services is one of the toughest challenges in today’s fast-moving world. Every delay, extra fuel cost, or missed delivery can trigger a chain reaction that disrupts the entire supply chain. Transportation Services KPI Dashboard in Excel That’s why companies need more than scattered reports—they need a single, smart tool to track, analyze, and improve performance.
✨ Introducing the Transportation Services KPI Dashboard in Excel – your all-in-one solution for tracking logistics and transport performance. Whether you run a small fleet or a global logistics network, this dashboard helps you monitor KPIs, control costs, and deliver better customer service—all from a single, easy-to-use platform.
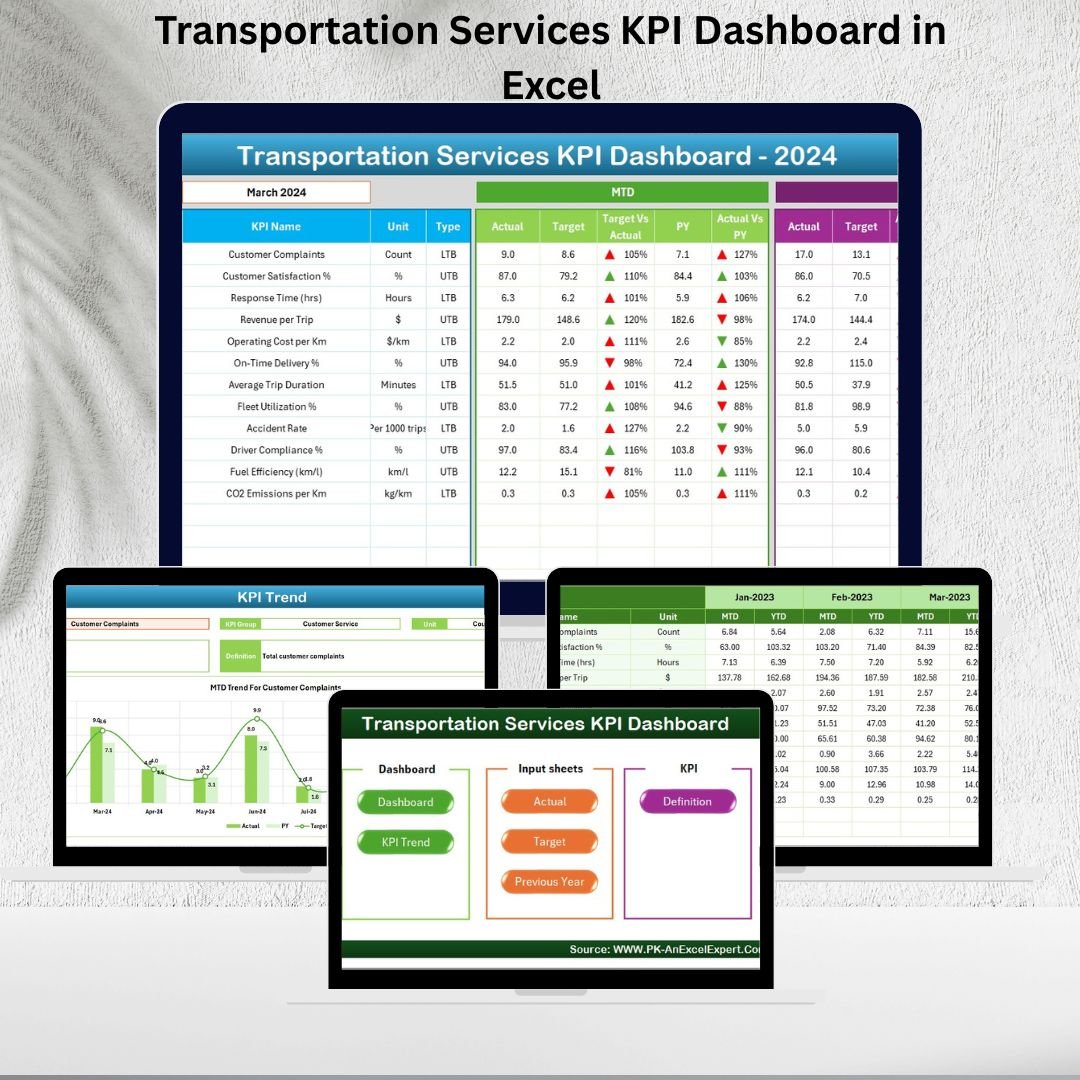
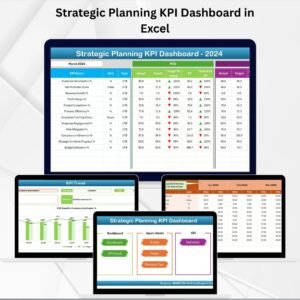
✅ Key Features of the Transportation Services KPI Dashboard
-
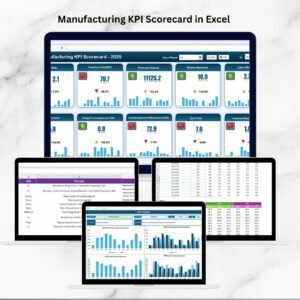
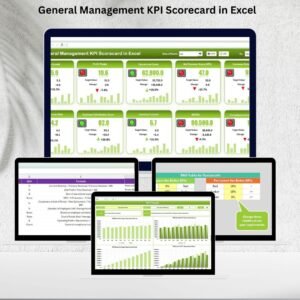
📊 Centralized KPI Dashboard – Monitor all transport KPIs in one place.
-
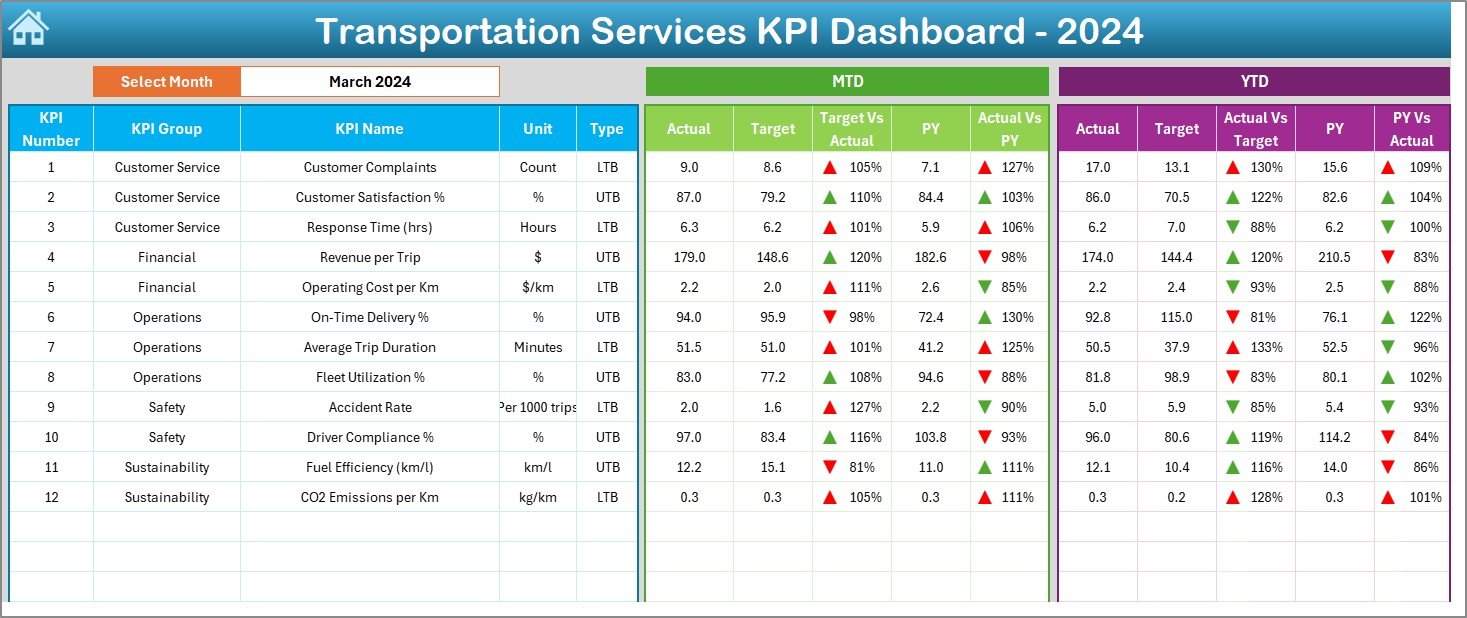
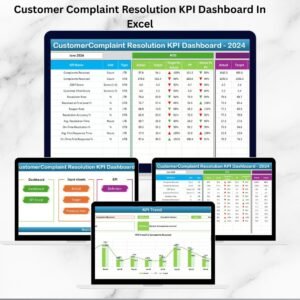
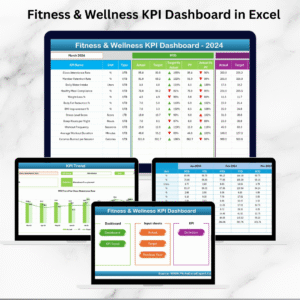
🎯 Target vs. Actual Tracking – Instantly see gaps and achievements.
-
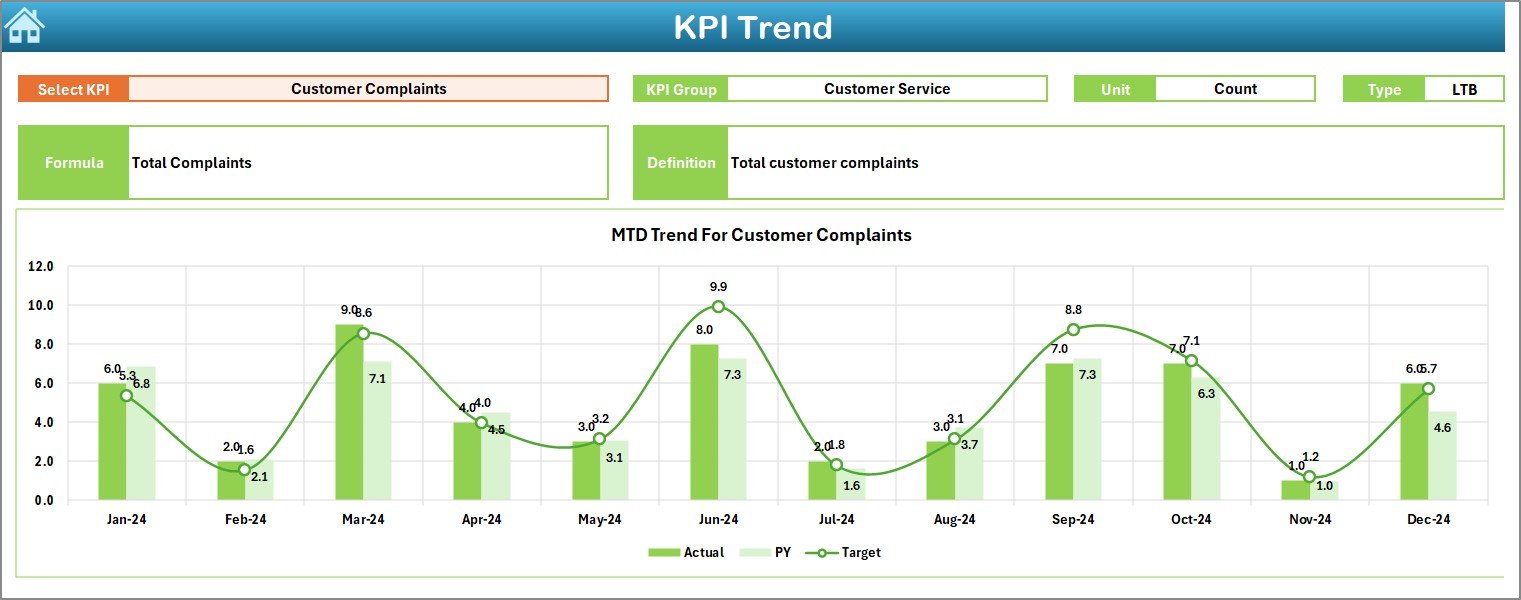
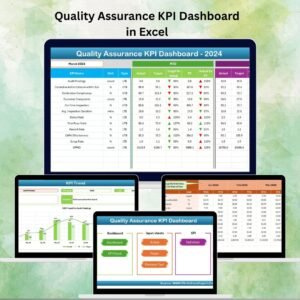
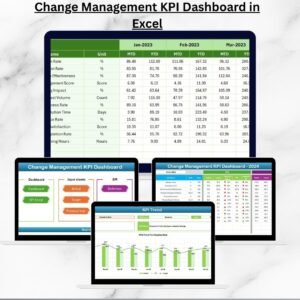
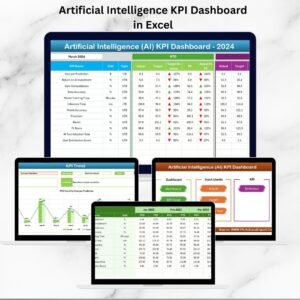
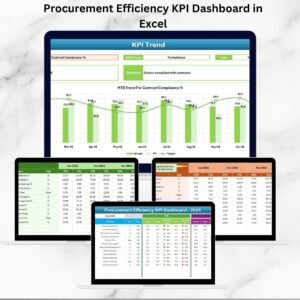
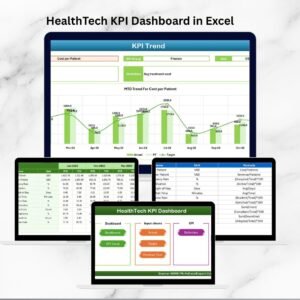
📈 Trend Charts – Analyze MTD & YTD performance with visuals.
-
🟢 Conditional Formatting – Red/green arrows for quick insights.
-
🔄 Dynamic Month Selector – Switch reporting periods with one click.
-
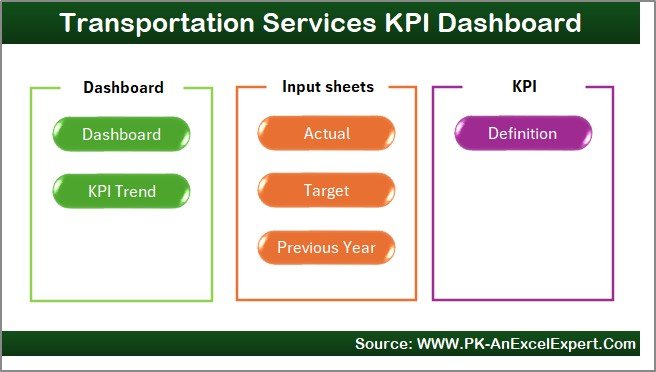
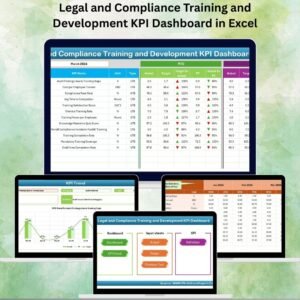
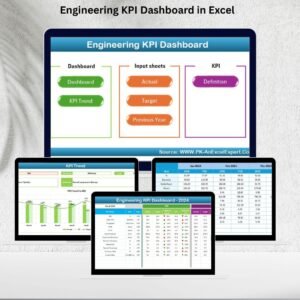
📂 Well-Structured Sheets – Home, Dashboard, KPI Trend, Targets, and more.
-
🕒 Time-Saving Automation – Auto-updates reduce manual errors.
-
🛠 Customizable – Add or remove KPIs as per your business needs.
📂 What’s Inside the Transportation Services KPI Dashboard
When you download this template, you’ll receive seven organized worksheets:
-
🏠 Home Sheet – Index page with quick navigation buttons.
-
📊 Dashboard Tab – The main view showing MTD, YTD, Target vs. Actual, and Previous Year comparisons.
-
📈 KPI Trend Sheet – Drop-down based KPI trends with charts, units, and definitions.
-
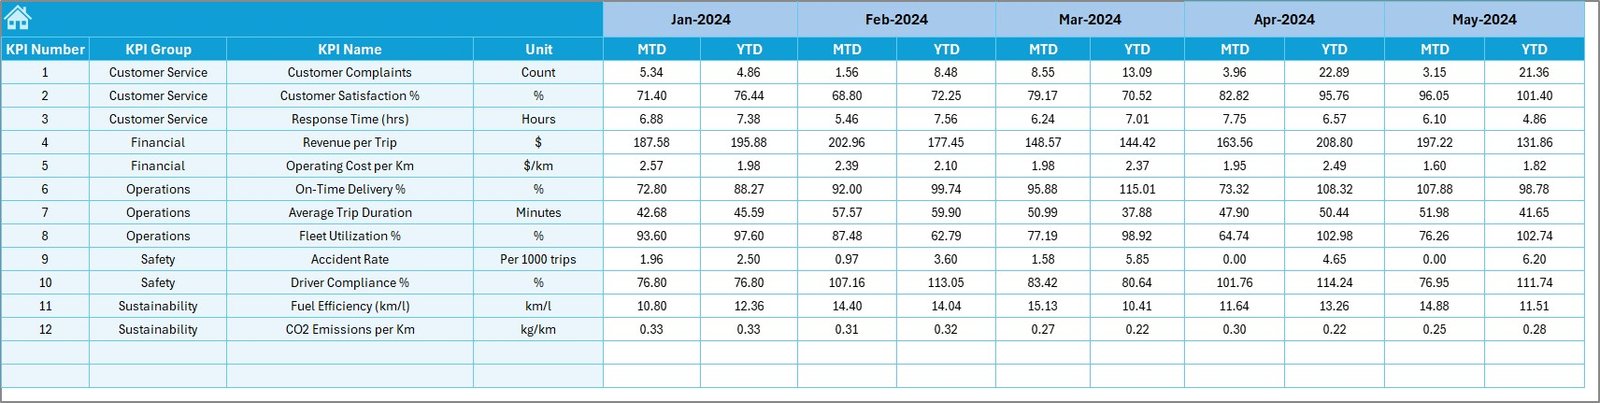
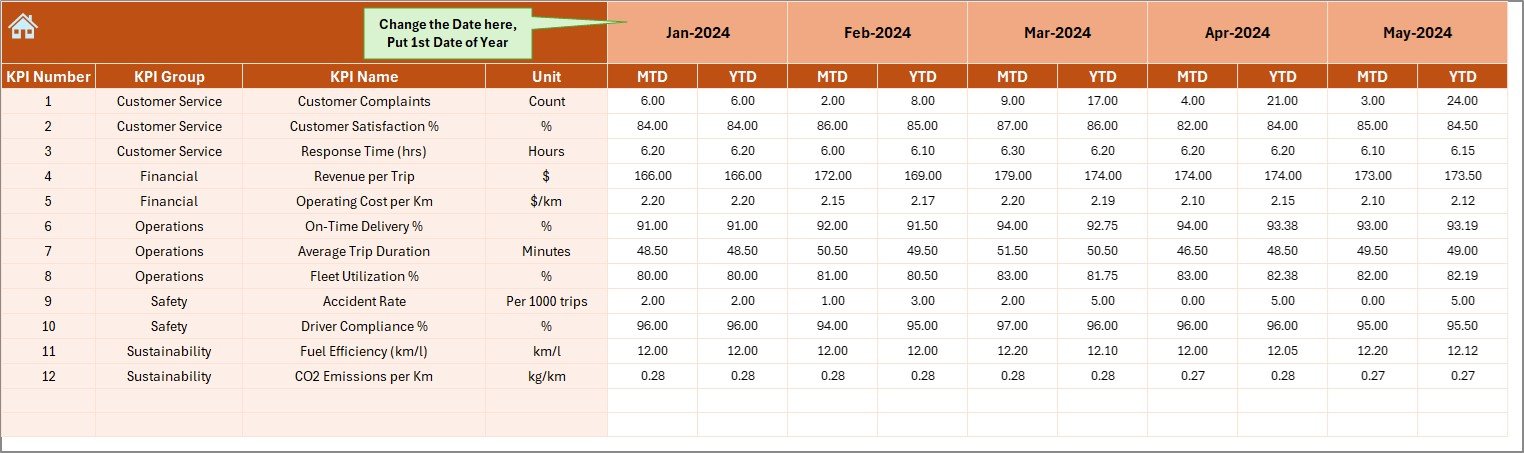
✍ Actual Numbers Input – Enter monthly MTD & YTD actuals in one place.
-
🎯 Target Sheet – Define monthly & yearly performance targets.
-
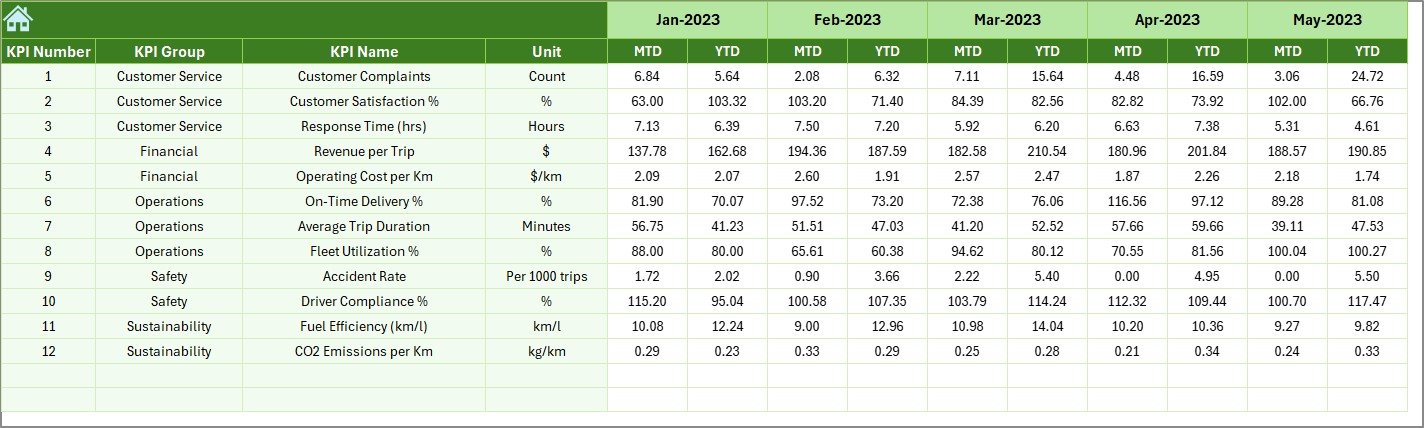
📅 Previous Year Numbers – Benchmark progress against historical data.
-
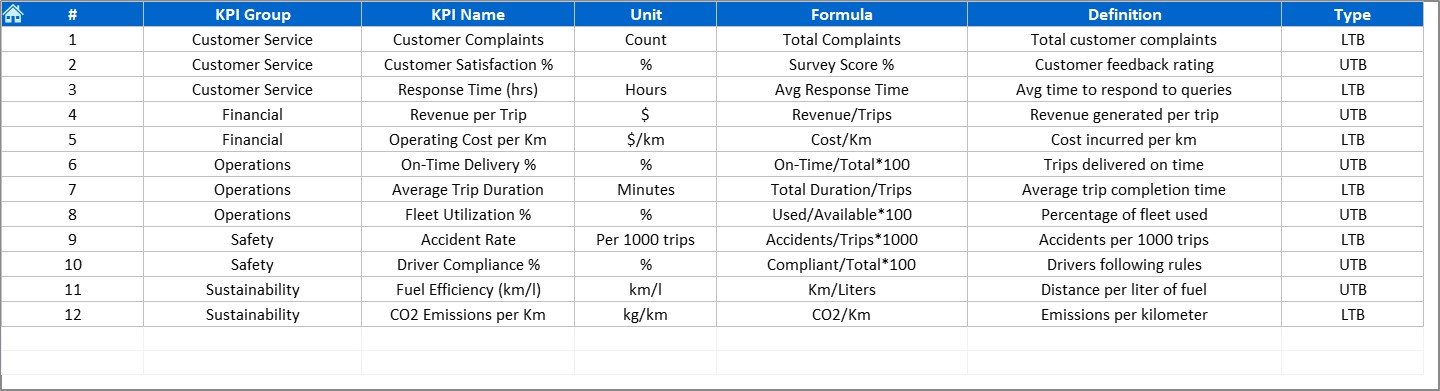
📖 KPI Definition Sheet – A reference library with KPI formulas, units, and definitions.
🚀 How to Use the Transportation Services KPI Dashboard
-
Enter Data – Input actual performance in the “Actual Numbers” sheet.
-
Set Targets – Add KPI targets for both MTD and YTD.
-
Select Month – Use the drop-down in the Dashboard sheet to filter results.
-
Analyze Trends – Review variance charts and trend analysis.
-
Take Action – Share insights with your team to improve efficiency.
💡 Even with basic Excel skills, you can use this dashboard effectively. Everything is prebuilt—just plug in your data and watch the insights flow!
👥 Who Can Benefit from This Dashboard?
-
🛒 E-commerce Businesses – Track last-mile delivery performance.
-
🏬 Retail Chains – Control bulk shipment and distribution costs.
-
🏭 Manufacturers – Ensure raw materials arrive on time.
-
🏥 Healthcare Providers – Guarantee timely medical supply delivery.
-
🚛 Logistics & Transport Companies – Optimize fleet usage and reduce idle time.
-
📦 Small Businesses – Gain big insights without expensive software.
This dashboard is flexible, scalable, and works for organizations of all sizes.
📖 Click here to read the Detailed blog post
Visit our YouTube channel to learn step-by-step video tutorials 👉 PKAnExcelExpert YouTube Channel


Reviews
There are no reviews yet.