The textile industry operates in a highly competitive environment where manufacturers must carefully manage production efficiency, control costs, maintain product quality, and meet strict delivery schedules. Textile operations involve multiple processes such as spinning, weaving, dyeing, finishing, inventory management, and distribution. Each of these processes generates large volumes of operational data.Textile Industry KPI Scorecard in Google Sheets
However, many textile companies still rely on manual reports and scattered spreadsheets to track performance. As a result, managers often struggle to monitor key performance indicators (KPIs), detect operational inefficiencies, and make timely decisions.
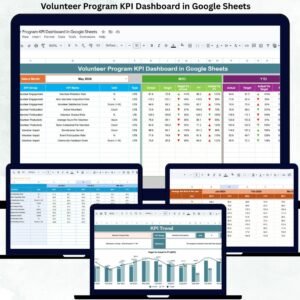
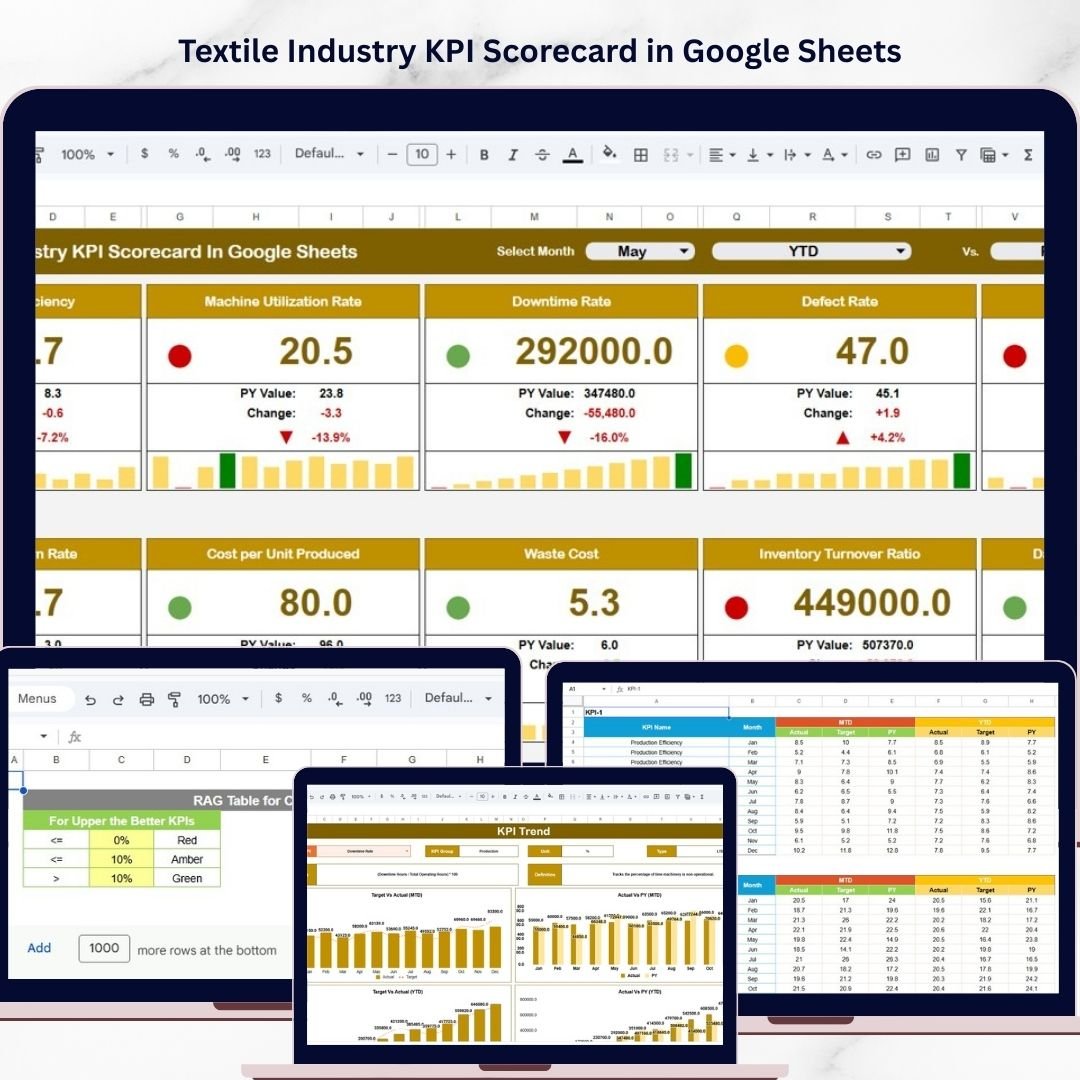
To address these challenges, we created the Textile Industry KPI Scorecard in Google Sheets — a powerful and ready-to-use performance monitoring tool designed specifically for textile manufacturers.
This KPI scorecard helps organizations track important manufacturing metrics, evaluate operational performance, and monitor production efficiency using a structured scorecard system.
Instead of reviewing multiple reports and spreadsheets, managers can analyze critical KPIs through dynamic calculations, visual performance indicators, and interactive analytics.
Because the scorecard is built in Google Sheets, it allows real-time collaboration, cloud accessibility, and automatic updates whenever new data is entered.
📊 Key Features of the Textile Industry KPI Scorecard
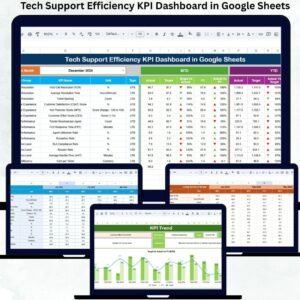
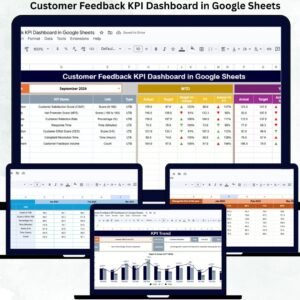
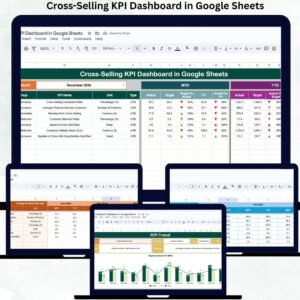
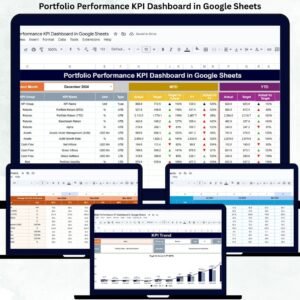
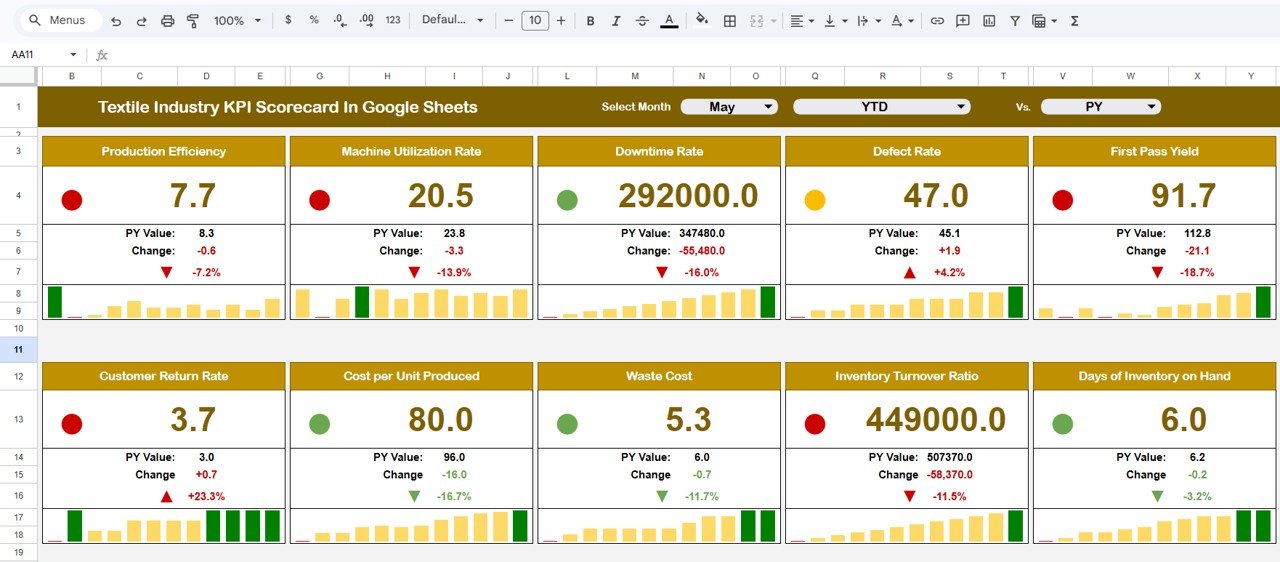
📈 Monthly KPI Performance Scorecard
The main scorecard sheet provides a clear overview of 10 important textile manufacturing KPIs.
Managers can monitor:
• Actual KPI performance
• Target KPI values
• Percentage performance changes
These comparisons help organizations evaluate whether operational goals are being achieved.
📅 Dynamic Month Selection
The dashboard includes a month selection dropdown at the top of the scorecard.
Users can select any month to analyze performance for that specific period. Once the month changes, the entire scorecard updates automatically.
This feature allows managers to evaluate monthly performance quickly.
🚦 Visual Performance Indicators
The template uses traffic light indicators and directional arrows to highlight KPI performance.
Performance indicators include:
🟢 Green – Performance above target
🟡 Yellow – Performance slightly below target
🔴 Red – Performance significantly below target
Up and down arrows also indicate performance trends.
These visual indicators allow managers to interpret performance instantly.
📊 MTD and YTD Performance Analysis
The scorecard supports both Month-to-Date (MTD) and Year-to-Date (YTD) analysis.
Users can easily switch between these two views to analyze:
• Monthly performance trends
• Overall yearly performance
This functionality provides both short-term and long-term performance insights.
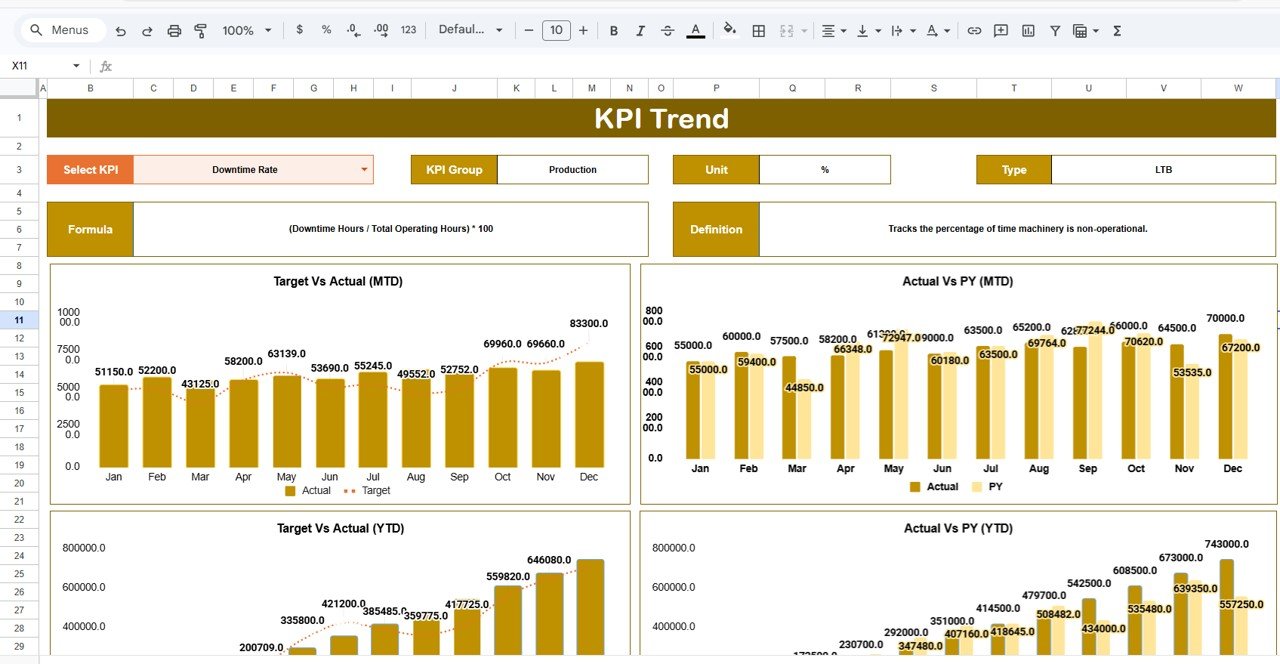
📉 KPI Trend Analysis
The Trend Sheet allows managers to analyze how KPIs change over time.
Instead of reviewing raw numbers, users can analyze visual trend charts.
Users simply select a KPI from the dropdown menu in cell C3, and the sheet automatically displays:
• KPI Group
• Unit of Measurement
• KPI Type (Lower the Better or Upper the Better)
• KPI Formula
• KPI Definition
Trend charts also display KPI performance across multiple months.
This helps managers identify patterns and improvement opportunities.
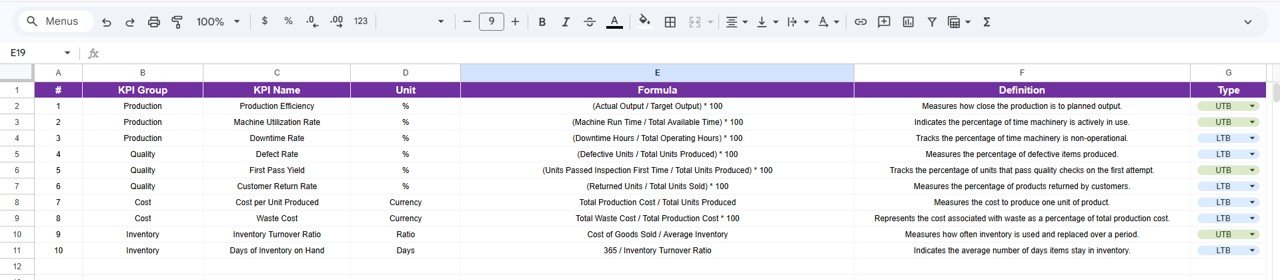
📚 KPI Definition Documentation
The KPI Definition Sheet provides detailed documentation for each KPI used in the scorecard.
This sheet includes:
• KPI Name
• KPI Group
• KPI Unit
• KPI Formula
• KPI Definition
Having a clear KPI reference ensures consistent KPI interpretation across departments.
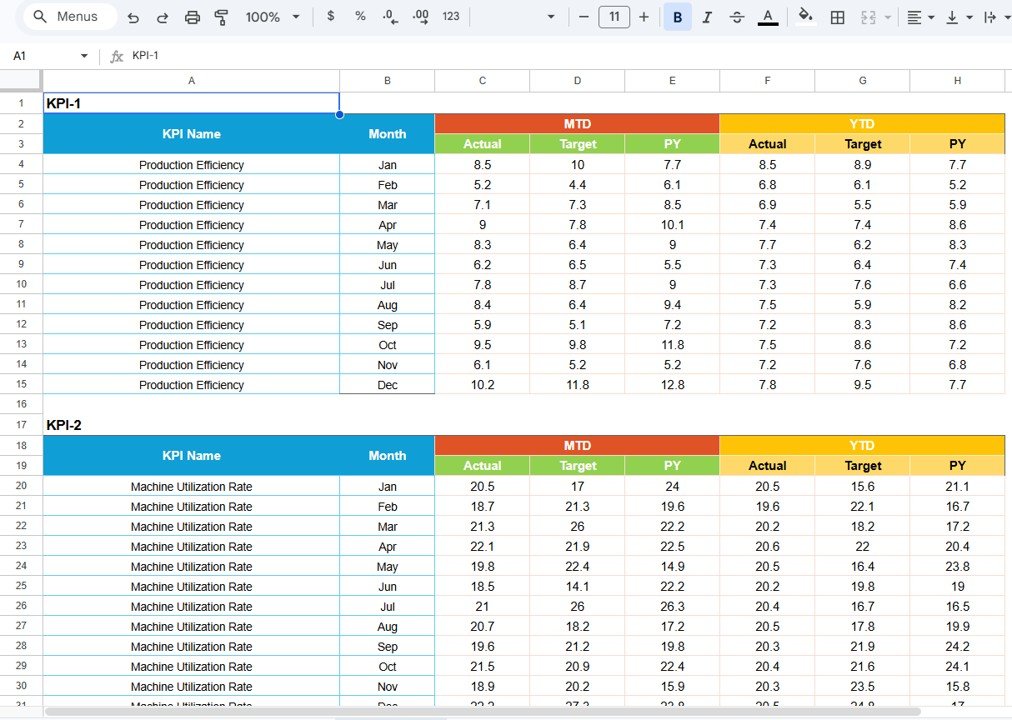
📊 Data Input Sheet
The Data Input Sheet acts as the primary data entry section.
Users enter operational data such as:
• Production output
• Machine utilization
• Quality defect rates
• Inventory levels
• Production costs
Once new data is entered, the entire scorecard updates automatically.
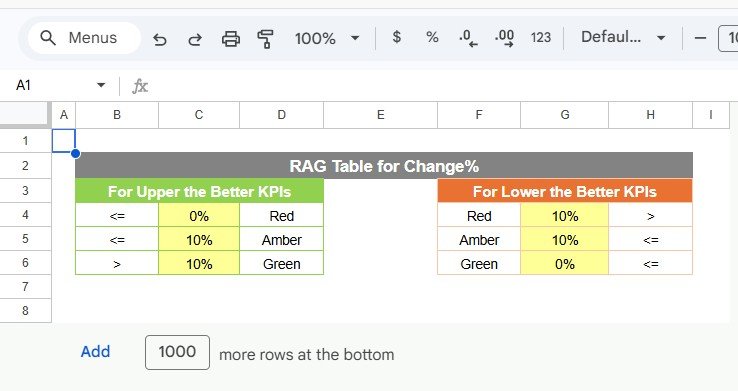
🎨 Customizable Colour Settings
The Colour Settings Sheet allows users to configure performance thresholds for KPI indicators.
Users can define the thresholds for:
• Green performance
• Yellow performance
• Red performance
Because organizations have different targets, this sheet allows complete customization of KPI performance indicators.
📁 What’s Inside the Textile KPI Scorecard
When you download this template, you will receive a Google Sheets dashboard containing five structured worksheets:
✔ Scorecard Sheet – Main KPI performance dashboard
✔ Trend Sheet – KPI performance trend analysis
✔ KPI Definition Sheet – KPI formulas and documentation
✔ Data Input Sheet – KPI data entry section
✔ Colour Settings Sheet – Customizable KPI performance indicators
Each sheet works together to provide a complete textile performance monitoring system.
👥 Who Can Benefit from This Scorecard
This template is ideal for:
✔ Textile Manufacturing Managers
✔ Production Managers
✔ Quality Control Teams
✔ Operations Managers
✔ Factory Supervisors
✔ Supply Chain Managers
✔ Business Analysts
Any textile manufacturing organization can use this scorecard to track operational performance and improve production efficiency.
🚀 Improve Textile Manufacturing Performance with Data
The Textile Industry KPI Scorecard in Google Sheets helps organizations monitor manufacturing performance, analyze operational metrics, and track production efficiency using a structured KPI system.
With dynamic scorecards, visual performance indicators, and trend analysis tools, managers can quickly identify operational issues and make data-driven decisions.
Because the template is cloud-based and customizable, it becomes a powerful tool for modern textile manufacturing analytics.
Click here to Read detailed blog post
Watch the step-by-step video tutorial:
Visit our YouTube channel to learn step-by-step video tutorials