
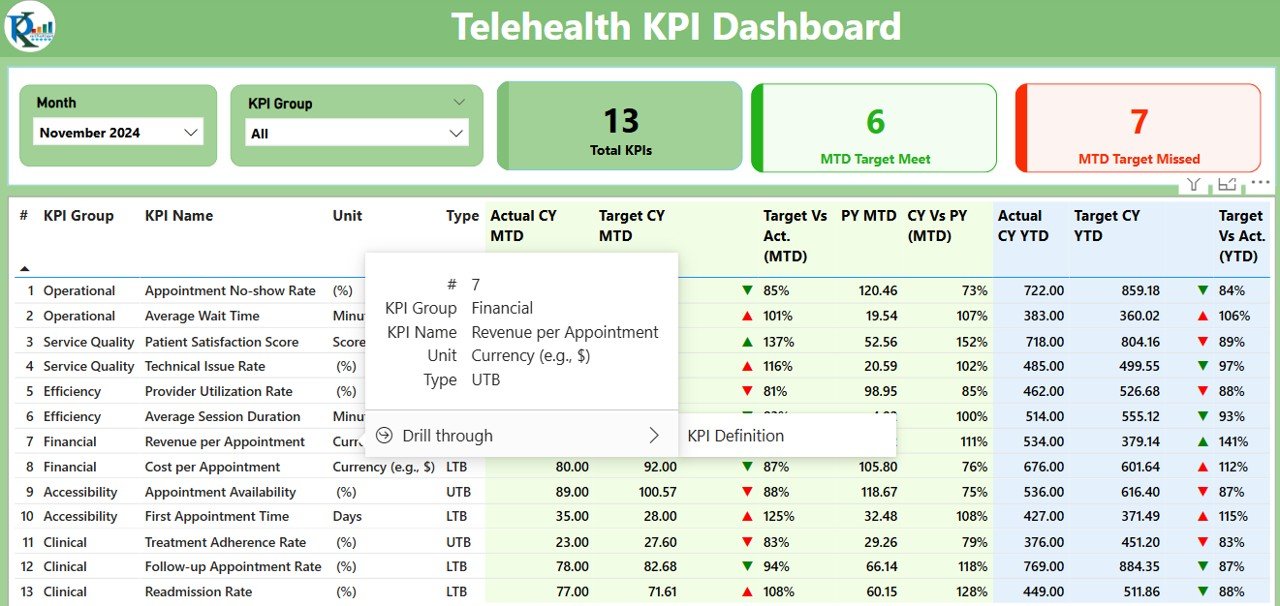
The Telehealth KPI Dashboard in Power BI is a comprehensive tool designed to help healthcare providers, telemedicine professionals, and administrators monitor and optimize their telehealth services. This Power BI dashboard provides real-time insights into key performance indicators (KPIs) such as patient volume, consultation time, patient satisfaction, and service delivery efficiency.
With the growing demand for telehealth services, this dashboard helps organizations track performance, ensure optimal resource allocation, and enhance patient care quality. By using visual reports and real-time data, healthcare managers and administrators can make informed decisions, optimize operations, and improve the overall telehealth experience for patients and healthcare providers.
Key Features of the Telehealth KPI Dashboard in Power BI
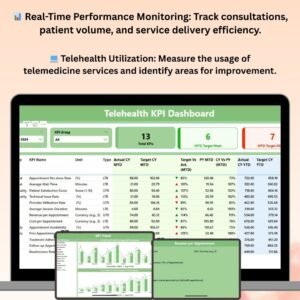
📊 Real-Time Performance Monitoring
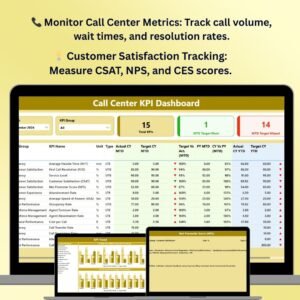
Monitor key performance indicators like patient volume, consultations, and service efficiency in real time. Stay updated with live data on telehealth operations.
💻 Telehealth Utilization Metrics
Track utilization rates for telemedicine services, including virtual consultations, patient waiting times, and response rates. Measure how effectively telehealth services are being used across various patient groups.
📈 Patient Satisfaction & Feedback Analysis
Analyze patient satisfaction scores, feedback, and ratings. Track patient experience metrics to identify areas for improvement and enhance service quality.
🕒 Consultation Time & Service Delivery Efficiency
Monitor the average consultation duration and efficiency metrics to optimize healthcare delivery. Identify bottlenecks and streamline operations for faster, more efficient patient care.
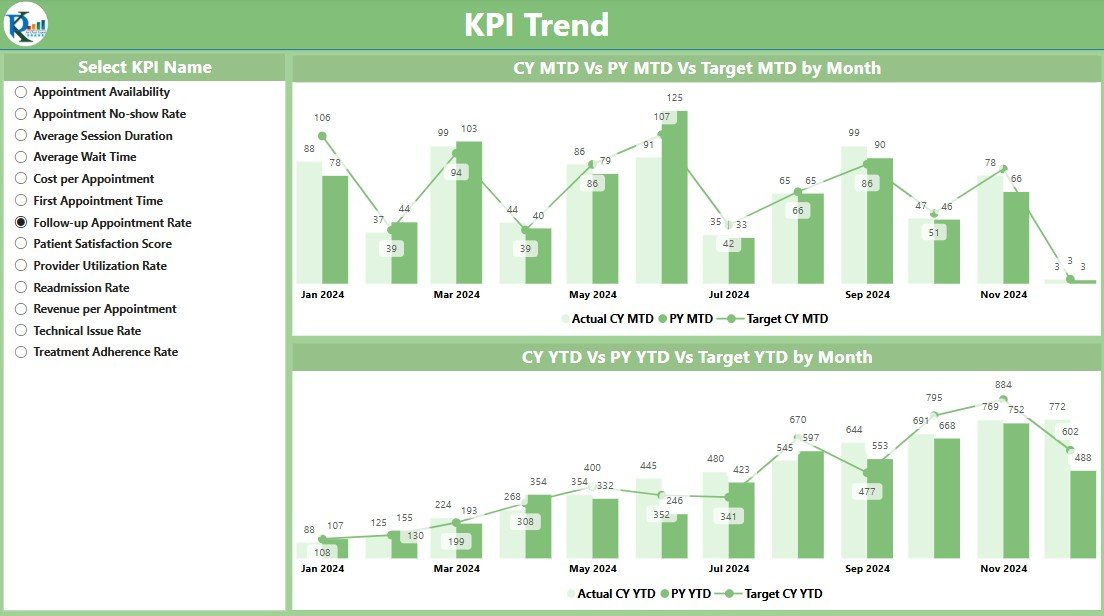
📅 Time-Based Tracking & Trends
Track telehealth performance over different time periods (e.g., daily, weekly, or monthly). Identify seasonal trends and changes in telehealth usage to make data-driven adjustments.
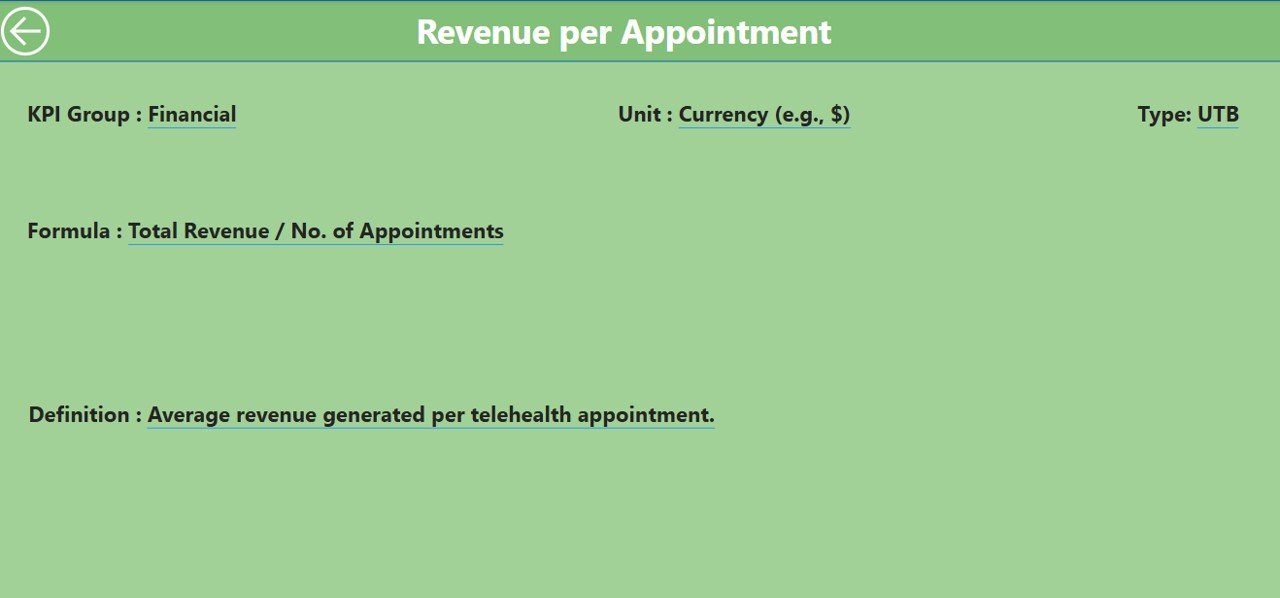
⚙️ Customizable KPIs & Metrics
Customize the dashboard to fit your organization’s unique telehealth goals. Track specific KPIs, such as telehealth adoption rates, wait times, or physician availability, and tailor the tool to your operational needs.
Why You’ll Love the Telehealth KPI Dashboard in Power BI
✅ Improve Telehealth Service Delivery
Get real-time insights into service delivery efficiency, patient volume, and consultation times. Ensure that telehealth services are being provided effectively and efficiently.
✅ Optimize Patient Care
Track patient satisfaction and feedback to make improvements to the telehealth experience. Ensure that patients are receiving timely and effective care.
✅ Boost Operational Efficiency
Analyze service delivery metrics such as consultation time and response rates to improve the efficiency of telehealth services. Streamline operations to reduce waiting times and optimize resource allocation.
✅ Data-Driven Decision Making
Make informed decisions based on real-time data and visual reports. Use insights to improve service quality, patient satisfaction, and operational performance.
✅ Customizable for Your Needs
Whether you’re a healthcare provider, telemedicine service provider, or a hospital administrator, this dashboard is fully customizable to fit your unique performance monitoring needs.
What’s Inside the Telehealth KPI Dashboard in Power BI?
- Real-Time Monitoring: Track patient volume, consultations, and service delivery performance.
- Patient Satisfaction Analysis: Monitor patient feedback, satisfaction scores, and ratings.
- Consultation Time & Efficiency: Measure consultation duration and overall service delivery efficiency.
- Utilization Tracking: Track telehealth service usage across patient groups and time periods.
- Time-Based Reporting: Analyze performance over daily, weekly, or monthly periods to identify trends.
- Customizable KPIs & Metrics: Tailor the dashboard to track specific telehealth goals and metrics.
How to Use the Telehealth KPI Dashboard in Power BI
1️⃣ Download the Template: Get immediate access to the Telehealth KPI Dashboard in Power BI.
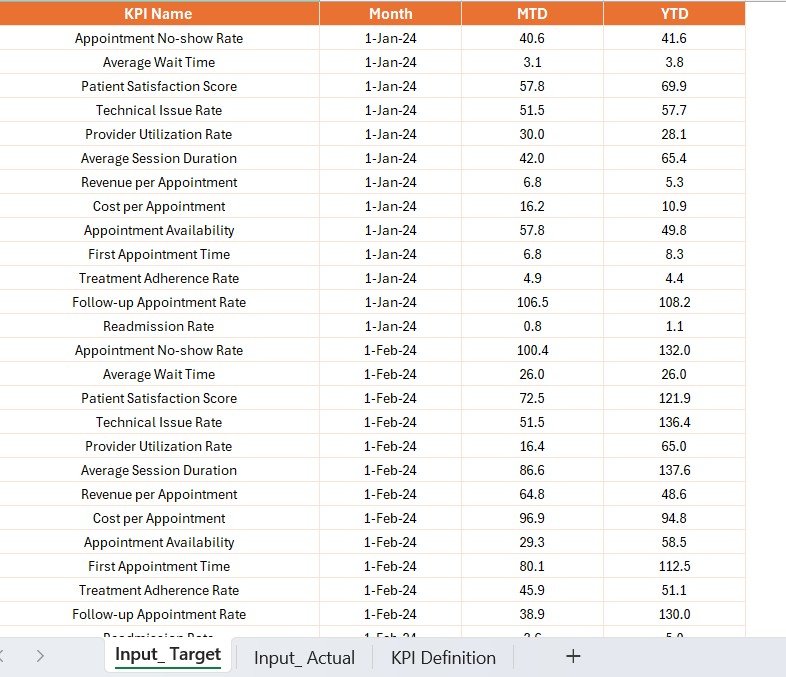
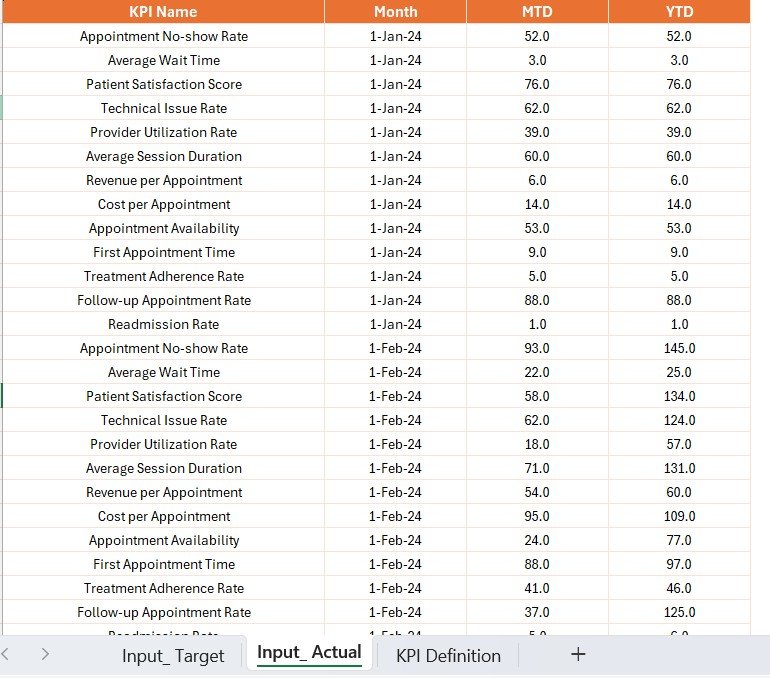
2️⃣ Connect to Data Sources: Integrate the dashboard with your telehealth data sources (e.g., patient records, service logs).
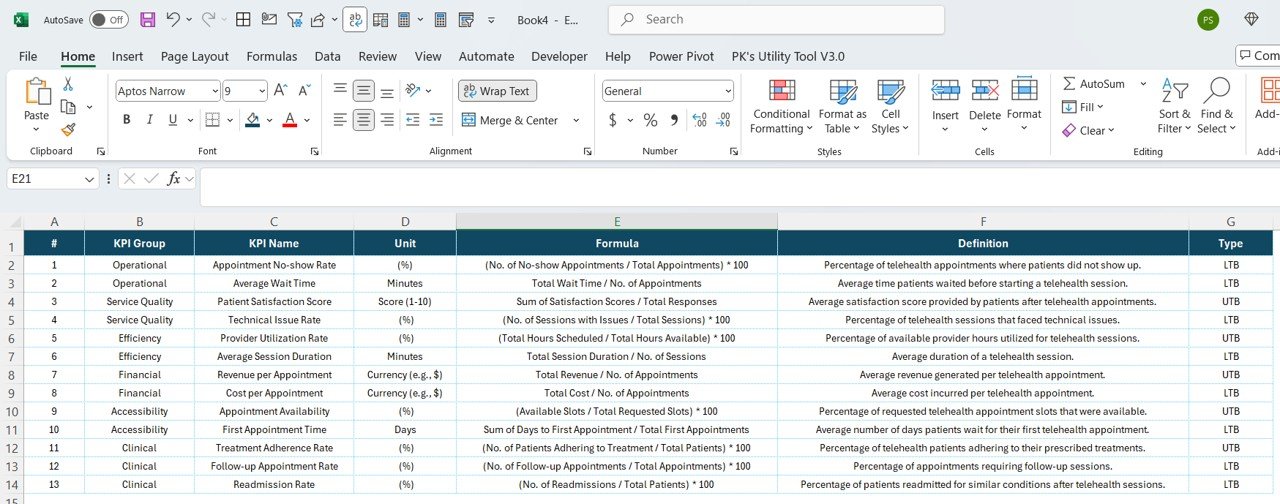
3️⃣ Set Up KPIs & Metrics: Customize the dashboard by adding the KPIs and metrics that matter most for your telehealth service.
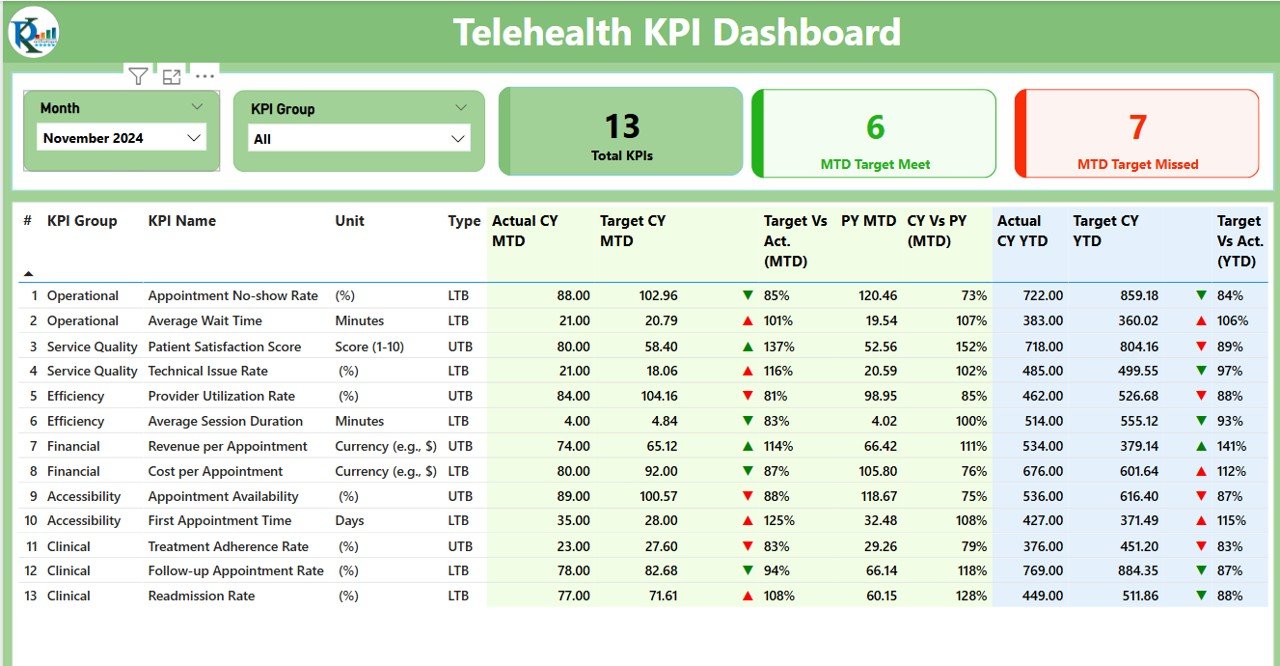
4️⃣ Track Performance: Monitor real-time performance, including consultation times, patient satisfaction, and service efficiency.
5️⃣ Visualize & Analyze Data: Use interactive charts and graphs to visualize performance trends and optimize telehealth operations.
Who Can Benefit from the Telehealth KPI Dashboard in Power BI?
🔹 Telemedicine Providers & Healthcare Managers
🔹 Medical Institutions & Hospitals Offering Telehealth Services
🔹 Telehealth Administrators & Project Managers
🔹 Healthcare Service Providers & Physicians
🔹 E-health Businesses & Remote Healthcare Startups
🔹 Data Analysts & Healthcare Consultants
Optimize your telehealth services, improve patient care, and drive efficiency with the Telehealth KPI Dashboard in Power BI. Track KPIs, visualize trends, and make data-driven decisions to enhance service delivery and patient satisfaction.
Click here to read the Detailed blog post
Visit our YouTube channel to learn step-by-step video tutorials
Youtube.com/@PKAnExcelExpert


Reviews
There are no reviews yet.