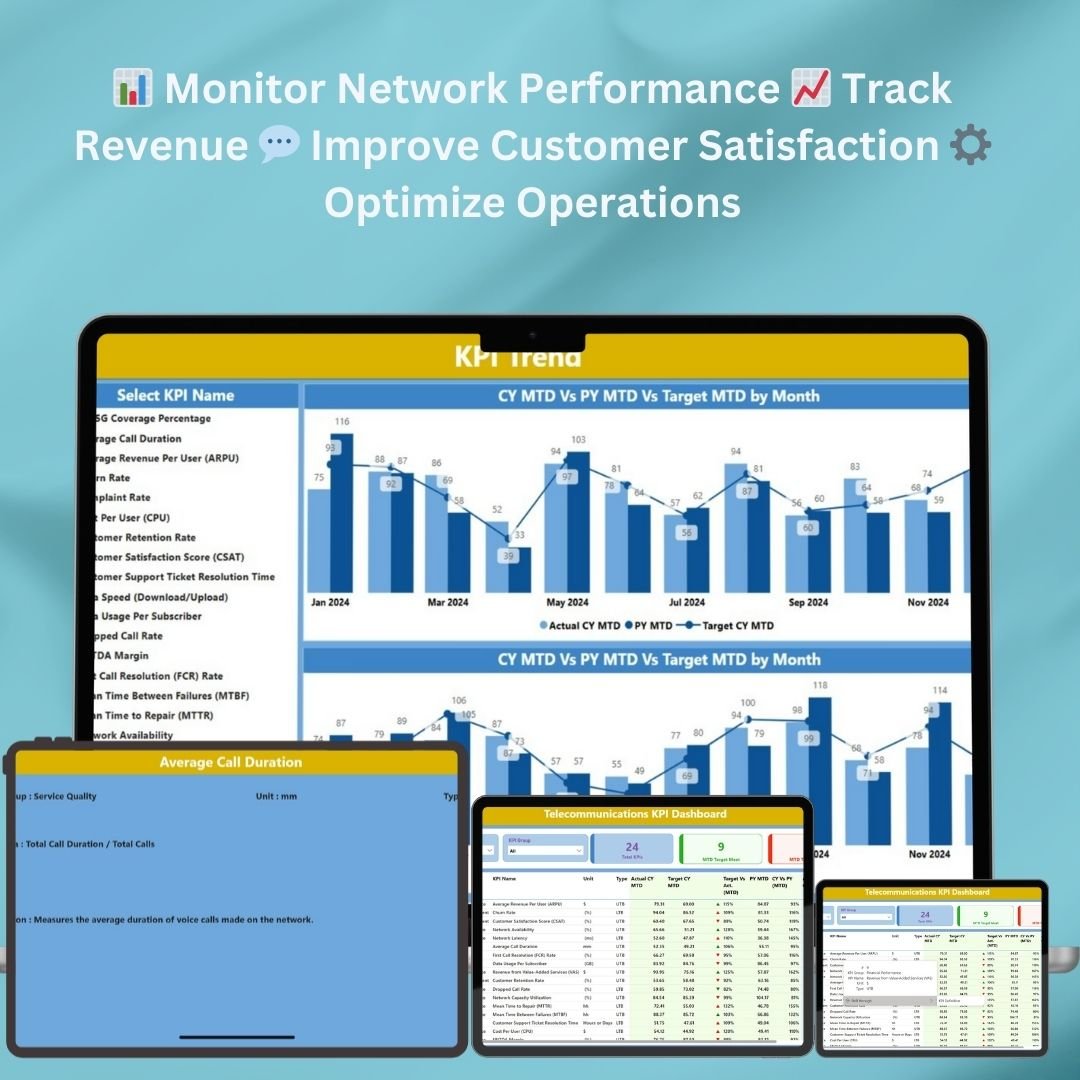


The Telecommunications KPI Dashboard in Power BI is a powerful tool designed to help telecom companies monitor, analyze, and visualize key performance indicators (KPIs) across various aspects of their operations. From network performance and customer satisfaction to revenue tracking and operational efficiency, this dashboard offers real-time data visualization to help stakeholders make informed decisions.
By utilizing the interactive and customizable features of Power BI, the Telecommunications KPI Dashboard provides deep insights into the telecom industry, helping businesses optimize performance, improve customer service, and drive operational efficiency.
Key Features of the Telecommunications KPI Dashboard in Power BI
📊 Real-Time Data Visualization: Monitor essential KPIs like network uptime, service usage, customer churn, and revenue in real-time.
⚙️ Customizable KPIs: Tailor the dashboard to track specific metrics relevant to your telecommunications business.
📈 Operational Efficiency: Analyze operational performance with KPIs like network reliability, call drop rates, and average handling time.
📅 Time-Based Analysis: Track performance over different time periods to evaluate trends and operational improvements.
📉 Customer Satisfaction Monitoring: Monitor customer complaints, churn rates, and service quality to improve customer retention.
🔄 Interactive Dashboard: Drill down into specific KPIs for detailed analysis and data exploration.
🧑💼 User-Friendly Interface: Designed for easy navigation, making it simple to access and analyze performance data.
Why You’ll Love the Telecommunications KPI Dashboard in Power BI
✅ Streamlined Performance Monitoring: View critical data on one screen, making it easier to track and analyze telecom operations.
✅ Data-Driven Decision Making: Make informed decisions based on real-time data visualizations and trend analysis.
✅ Improves Operational Efficiency: Identify bottlenecks, inefficiencies, and areas for improvement in your telecom network.
✅ Customizable for Your Business: Adapt the dashboard to monitor specific KPIs relevant to your telecom services, whether mobile, broadband, or enterprise solutions.
✅ Real-Time Customer Insights: Track customer behavior, churn rates, and satisfaction to improve service offerings and retain clients.
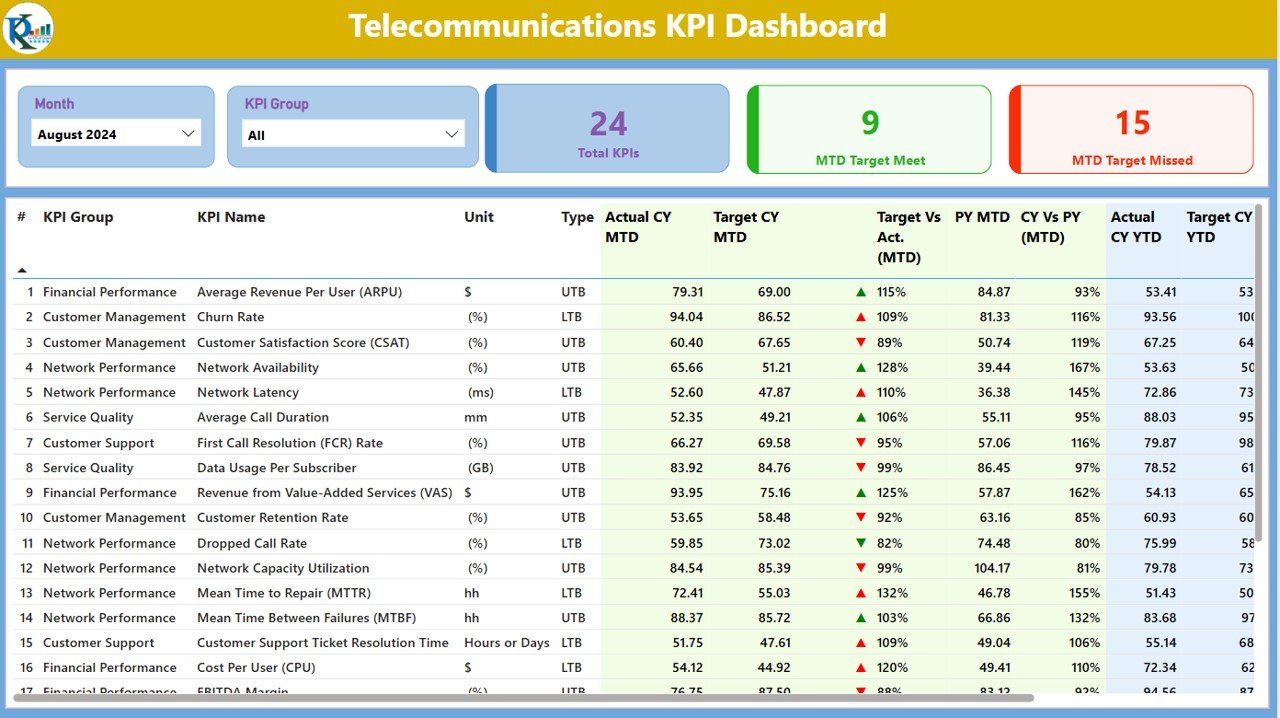
What’s Inside the Telecommunications KPI Dashboard in Power BI?
📊 Network Performance Metrics: Track network availability, uptime, latency, and service disruptions.
📈 Revenue and Billing Tracking: Monitor monthly revenue, average revenue per user (ARPU), and service usage trends.
⚙️ Service Quality Monitoring: Analyze call drop rates, call resolution times, and service interruptions to improve quality.
📉 Customer Retention Insights: Track customer churn, complaints, and satisfaction to enhance customer loyalty.
📅 Time-Based Data Insights: View performance trends across different time periods, such as days, weeks, or months.
How to Use the Telecommunications KPI Dashboard in Power BI
1️⃣ Download the Dashboard Template – Gain immediate access to the Power BI file.
2️⃣ Customize KPIs: Modify the dashboard to fit your specific telecommunications services and KPIs.
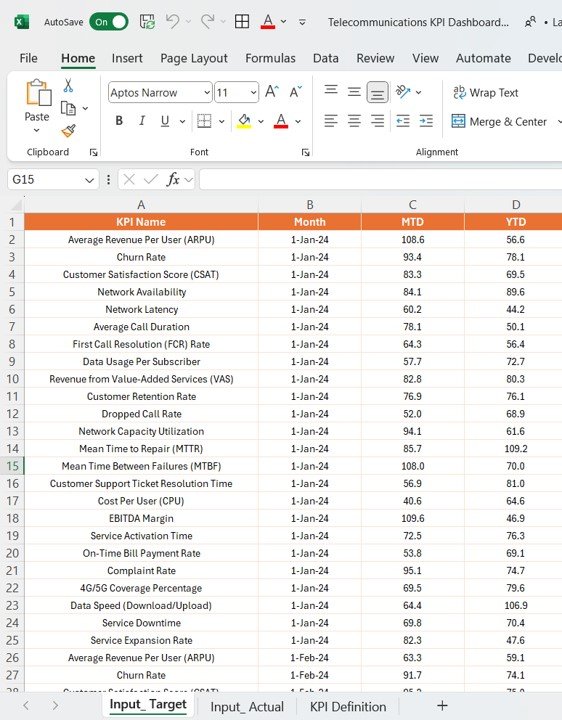
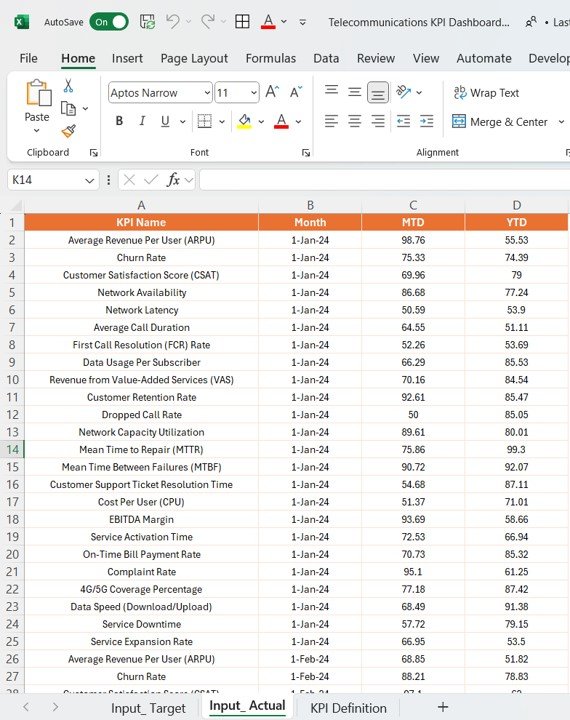
3️⃣ Input Your Data: Connect your data sources to the Power BI dashboard for seamless integration.
4️⃣ Monitor and Analyze: Use the interactive dashboard to track network performance, customer behavior, and operational efficiency.
5️⃣ Generate Reports: Create reports based on selected KPIs for in-depth analysis and presentation to stakeholders.
Who Can Benefit from the Telecommunications KPI Dashboard in Power BI?
🔹 Telecom Operations Managers
🔹 Business Analysts
🔹 Network Engineers
🔹 Customer Service Managers
🔹 Sales and Marketing Teams
🔹 Executive Leadership Teams
🔹 Telecom Service Providers
Optimize your telecommunications operations and improve customer satisfaction with this interactive and customizable Power BI dashboard.
Click here to read the detailed blog post
Visit our YouTube channel to learn step-by-step video tutorials
Also check our Expense Tracking Dashboard in Power BI


Reviews
There are no reviews yet.