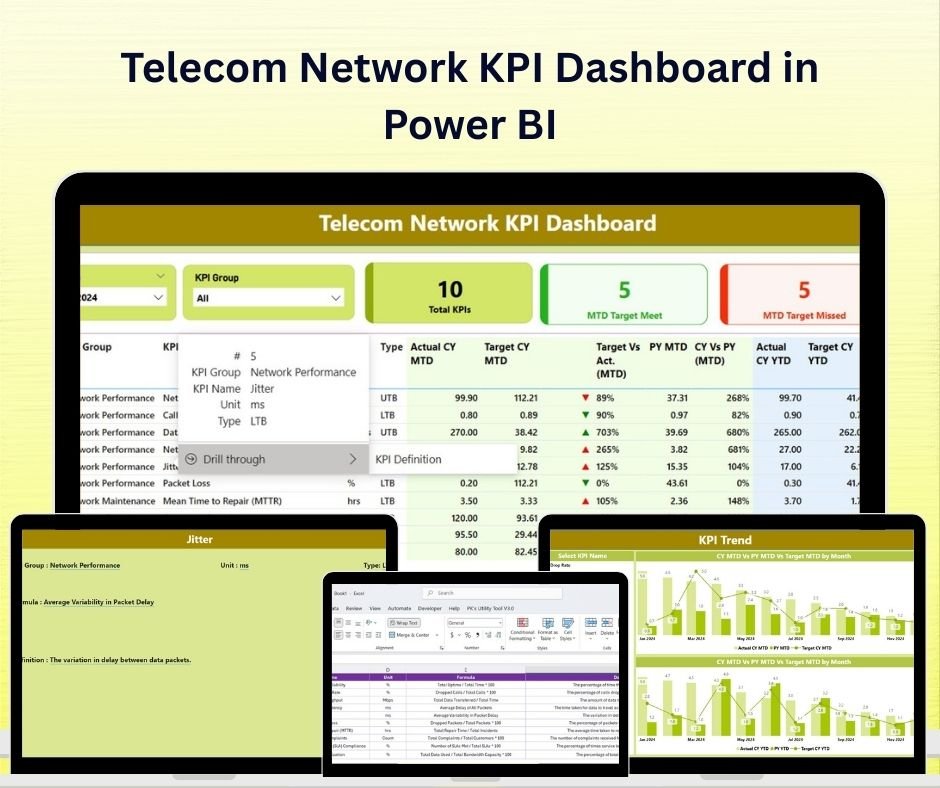
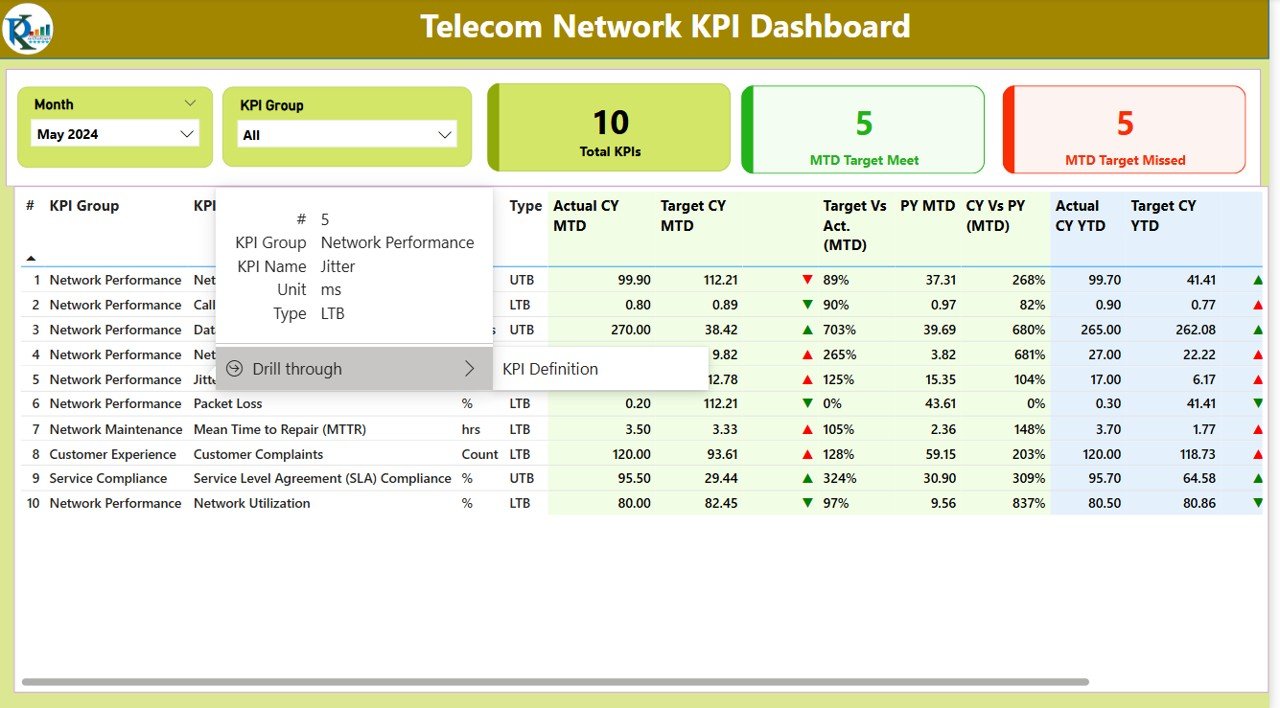
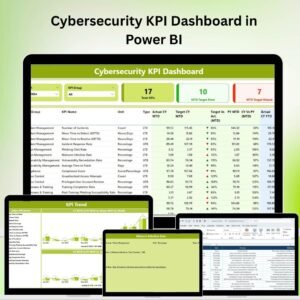
The Telecom Network KPI Dashboard in Power BI is a cutting-edge tool designed to help telecom operators and network managers track and manage key performance indicators (KPIs) essential for optimizing network performance, customer experience, and operational efficiency. Whether you’re managing a mobile network, broadband service, or a telecommunications infrastructure, this Power BI dashboard gives you real-time insights into critical metrics that help you maintain and improve network performance.
With interactive features and customizable reports, this dashboard enables telecom companies to make data-driven decisions, enhance service quality, and ensure operational excellence, ensuring that network issues are proactively addressed before they impact customers.
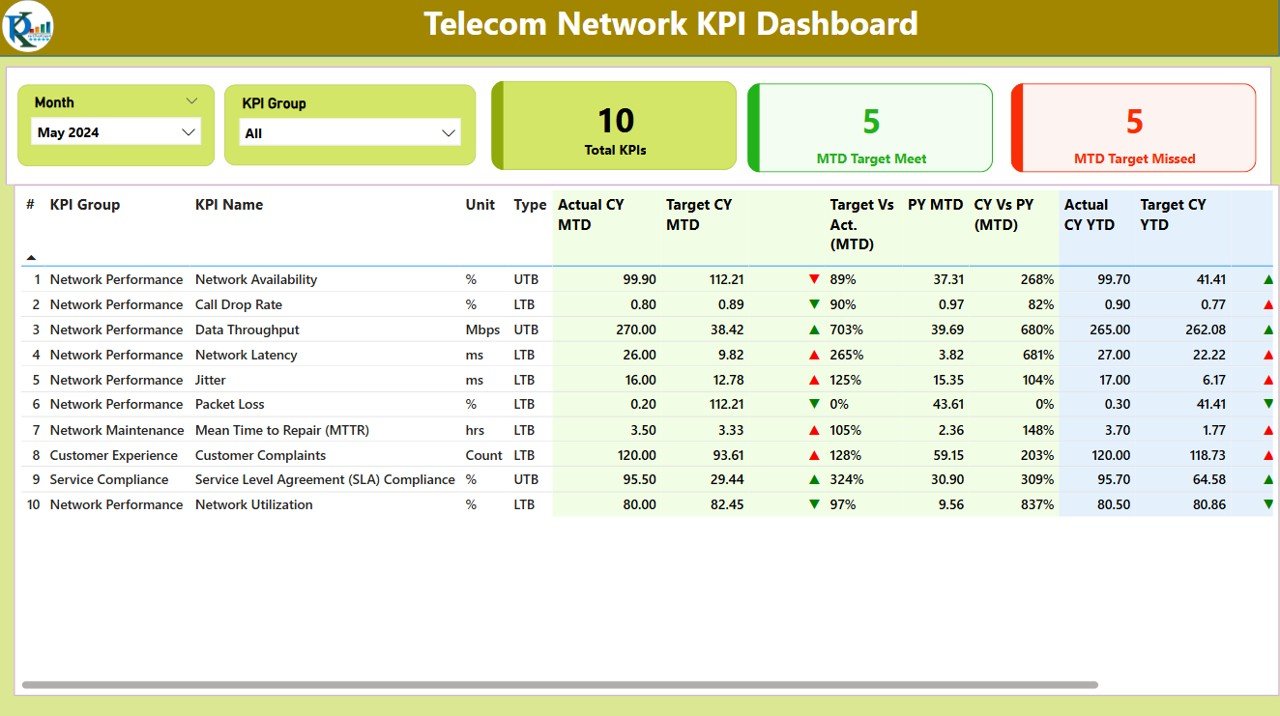
Key Features of the Telecom Network KPI Dashboard in Power BI:
📶 Network Performance Monitoring
Track network availability, signal strength, data speed, and uptime to ensure optimal service delivery and reliability for your customers.
📊 Customer Experience and Satisfaction
Monitor customer complaints, service disruptions, and feedback to measure customer satisfaction and identify areas for improvement.
💰 Revenue and Cost Efficiency
Track revenue generated from network services, including subscription fees, data plans, and additional services, while also managing operational costs to ensure financial sustainability.
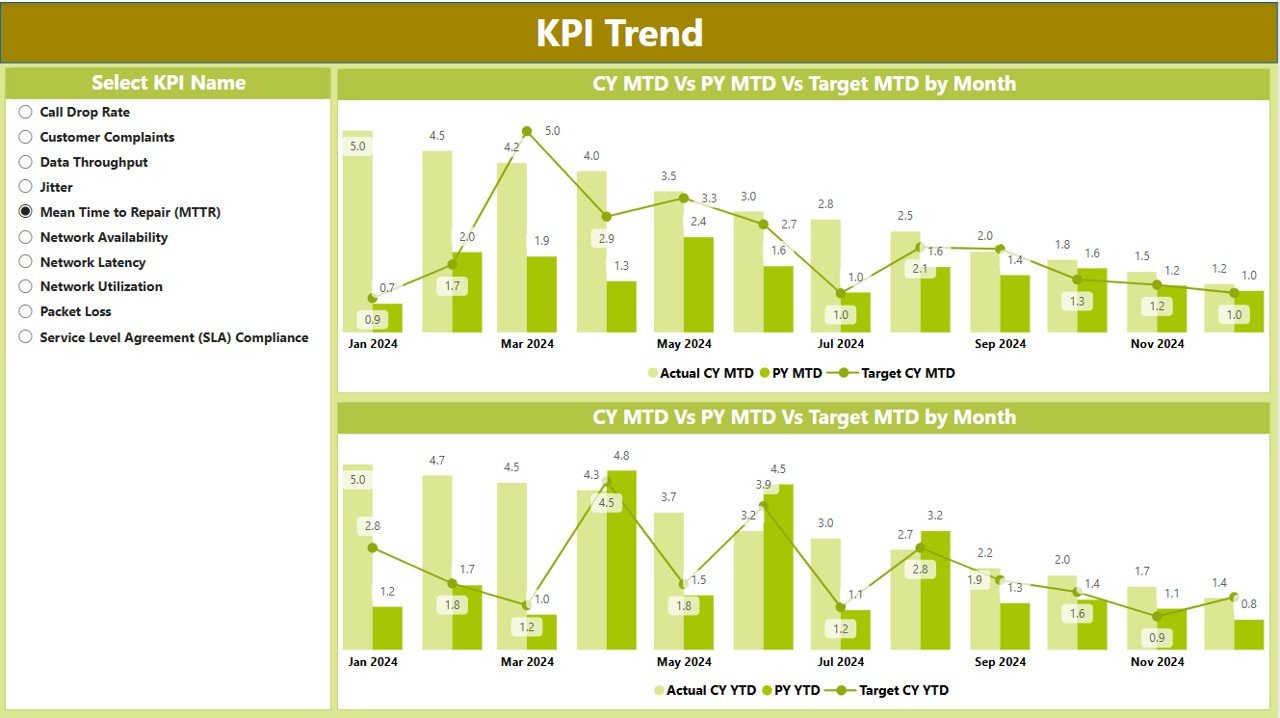
📈 Network Traffic and Usage
Monitor traffic volumes, data usage patterns, and peak usage times to optimize network resource allocation and ensure smooth data flow during high-demand periods.
⚙️ Operational Efficiency
Measure the efficiency of network maintenance, downtime, and service restoration to ensure quick response times and minimize service interruptions.
🚀 Why You’ll Love the Telecom Network KPI Dashboard in Power BI:
✅ Monitor Network Performance – Track critical network metrics such as availability, data speed, and signal strength to ensure your network is performing at its best.
✅ Enhance Customer Experience – Measure customer complaints and service issues to identify areas where your network services can be improved.
✅ Track Revenue and Costs – Monitor revenue from network services and control operational costs to ensure profitability and cost efficiency.
✅ Optimize Network Traffic – Track network traffic and usage patterns to optimize resource allocation during high-demand periods.
✅ Improve Operational Efficiency – Monitor maintenance schedules, downtime, and service restoration metrics to reduce network downtime and improve operational efficiency.
✅ Fully Customizable and Interactive – Tailor the dashboard to meet your telecom company’s specific needs, with real-time data visualizations and customizable reports.
What’s Inside the Telecom Network KPI Dashboard in Power BI:
-
Network Performance Metrics: Track network availability, data speed, uptime, and signal strength to ensure optimal service delivery.
-
Customer Satisfaction: Monitor complaints, service disruptions, and customer feedback to identify and address issues affecting service quality.
-
Revenue and Cost Analysis: Track revenue generated from various services, and monitor costs to maintain financial stability and efficiency.
-
Network Traffic and Data Usage: Monitor traffic volumes and usage patterns, especially during peak demand times, to ensure efficient data flow and resource allocation.
-
Operational Metrics: Track maintenance activities, downtime, and service restoration times to optimize network management.
-
Custom Reports: Generate detailed reports on network performance, customer feedback, revenue, and operational metrics for comprehensive decision-making.
How to Use the Telecom Network KPI Dashboard in Power BI:
1️⃣ Download the Power BI Template – Instantly access your Power BI file upon purchase.
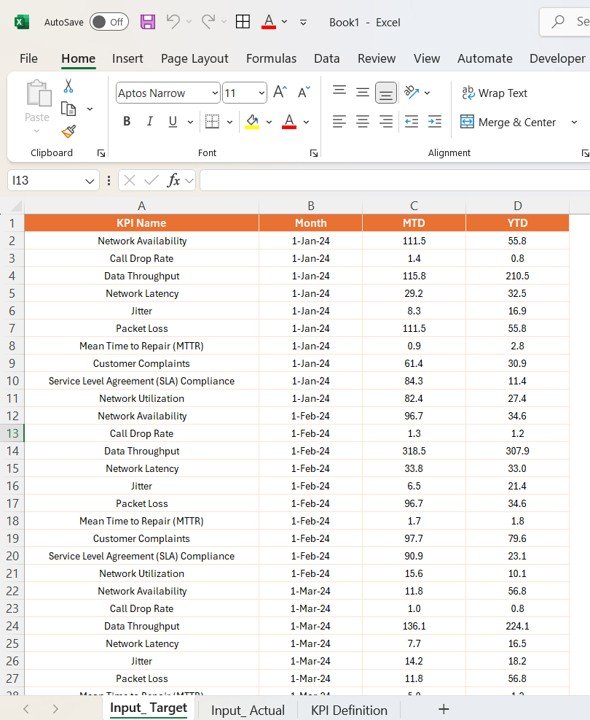
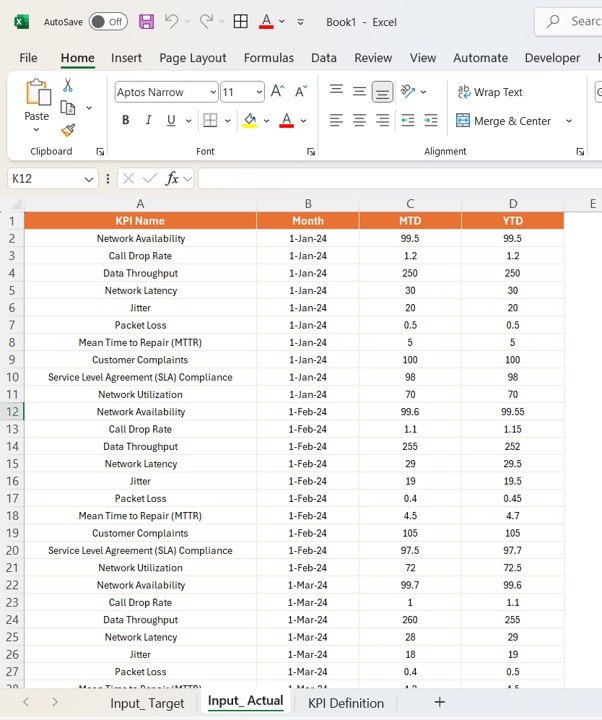
2️⃣ Input Network Data – Enter data on network performance, traffic usage, revenue, and customer feedback to start tracking KPIs.
3️⃣ Monitor Network Health – Use the dashboard to monitor the health of your network, track performance, and ensure service delivery is optimal.
4️⃣ Track Financial Metrics – Monitor revenue and operational costs to ensure the financial health of your telecom network.
5️⃣ Evaluate Customer Experience – Track customer complaints and feedback to improve service quality and retain customers.
6️⃣ Generate Reports – Create custom reports summarizing network performance, financial metrics, and customer experience for decision-making and performance optimization.
Who Can Benefit from the Telecom Network KPI Dashboard in Power BI:
-
Telecom Network Operators
-
Network Managers
-
Telecommunications Service Providers
-
Customer Experience Teams
-
Telecom Financial Analysts
-
Network Engineers
-
Operations Managers
-
Telecom Consultants
-
Business Intelligence Teams
-
Telecom Infrastructure Managers
The Telecom Network KPI Dashboard in Power BI is an essential tool for optimizing telecom network performance and improving customer satisfaction. With real-time tracking of critical metrics such as network availability, customer satisfaction, revenue, and operational efficiency, this dashboard ensures that your network remains reliable, cost-effective, and customer-centric.
Click here to read the Detailed blog post
https://www.pk-anexcelexpert.com/telecom-network-kpi-dashboard-in-power-bi/
Visit our YouTube channel to learn step-by-step video tutorials
Youtube.com/@PKAnExcelExpert










Reviews
There are no reviews yet.