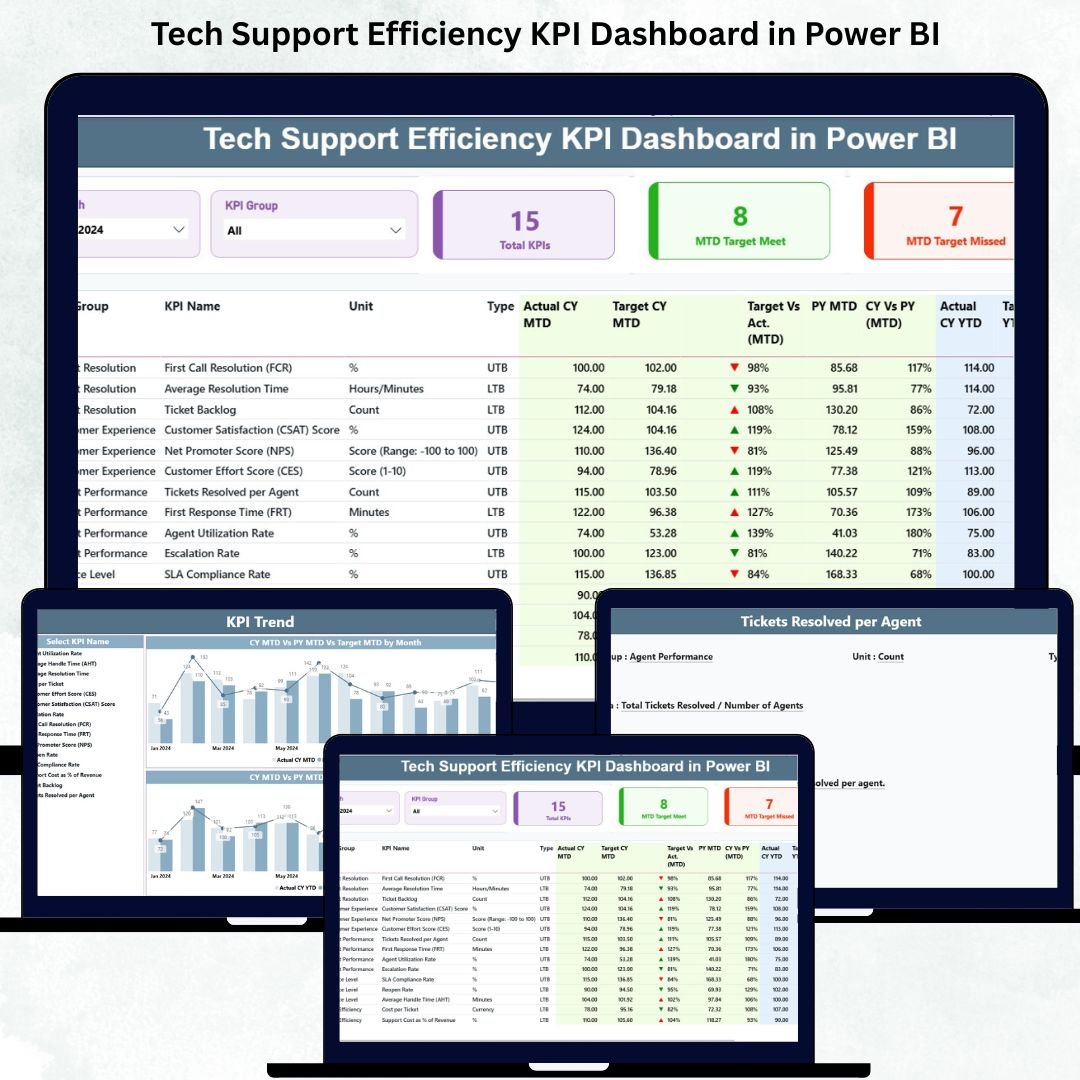
Managing a tech support team becomes far easier when you have complete visibility into performance, workloads, and customer experience. The Tech Support Efficiency KPI Dashboard in Power BI is designed for businesses that want to monitor support operations in real time and improve service quality with data-driven decisions. This dashboard converts raw support data into meaningful visuals, helping managers identify bottlenecks, track daily progress, and ensure SLA compliance across every stage of the support process.
Whether you handle a few hundred tickets or manage a large support center, this dashboard gives you the clarity needed to take fast action. With automated updates, smart visuals, and interactive KPI tracking, your team gains an all-in-one system for analyzing efficiency and boosting performance.
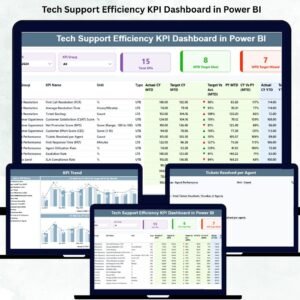
⚡ Key Features of the Tech Support Efficiency KPI Dashboard in Power BI
This dashboard is packed with performance-boosting features that help you monitor every area of tech support. Each feature is designed to improve visibility and reduce manual work.
📊 Real-Time KPI Tracking
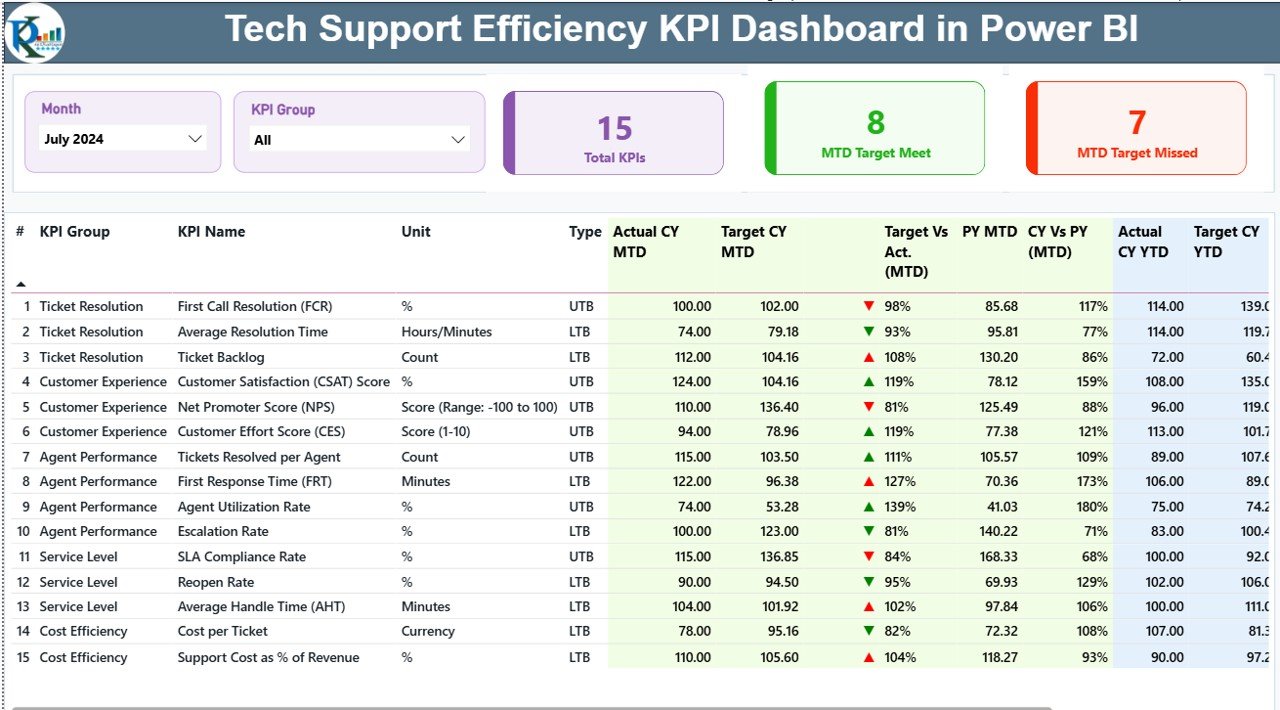
Track critical KPIs such as First Response Time, Average Resolution Time, Ticket Backlog, SLA Compliance, CSAT Scores, and more — all updated automatically in Power BI.
📅 Month & KPI Group Filters
Filter data instantly using Month and KPI Group slicers to review performance for any time period.
📌 Clear MTD & YTD Views
View Month-to-Date and Year-to-Date metrics with Target, Actual, and Previous Year comparisons.
⬆️⬇️ Visual Performance Indicators
Color-coded arrows (▲/▼) show whether KPIs meet or miss targets, helping managers act immediately.
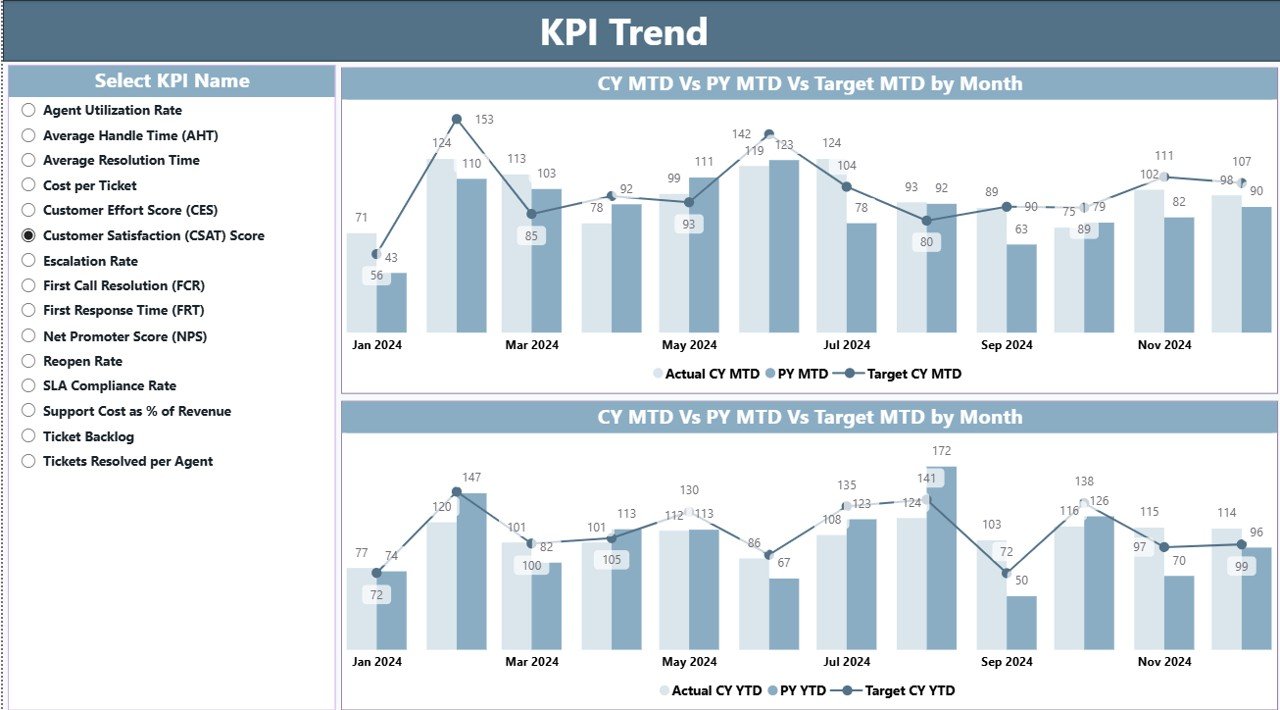
📈 Trend Analysis Charts
See patterns using MTD and YTD line/charts for Actual, Target, and Previous Year values.
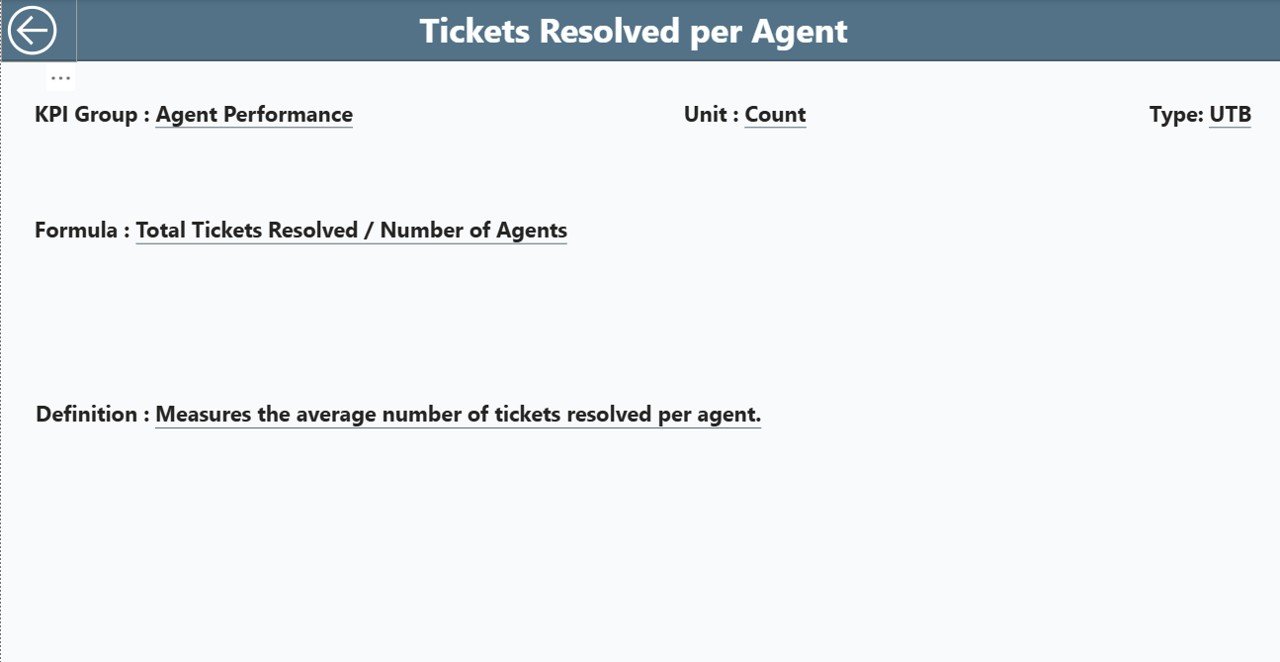
🔍 Drill-Through KPI Definition Page
Click any KPI to view its definition, formula, type (UTB/LTB), and detailed structure.
📁 What’s Inside the Tech Support Efficiency KPI Dashboard in Power BI
This product includes a fully structured Power BI dashboard built on top of three well-organized Excel sheets. Each file is designed to be easy to update and beginner-friendly.
📄 Input_Actual Sheet
-
KPI Name
-
Month
-
MTD Actual Values
-
YTD Actual Values
Managers update this sheet every month to reflect fresh performance data.
🎯 Input_Target Sheet
-
KPI Name
-
Monthly Targets (MTD)
-
Yearly Targets (YTD)
Clear targets make it easier for teams to stay aligned and goal-focused.
📘 KPI Definition Sheet
-
KPI Number
-
KPI Group
-
KPI Name
-
Unit
-
Formula
-
Definition
-
KPI Type (UTB/LTB)
This sheet powers the drill-through page, helping users understand KPIs quickly.
🛠️ How to Use the Tech Support Efficiency KPI Dashboard in Power BI
Using this dashboard is simple, even for beginners. Follow these easy steps:
1️⃣ Update the Excel Source File
Enter MTD and YTD values in the Input_Actual sheet at the end of every month.
2️⃣ Refresh Power BI
Click Refresh to update all visuals instantly.
3️⃣ Explore the Summary Page
Use the Month and KPI Group slicers to filter KPIs. Review the KPI cards and the detailed performance table.
4️⃣ Analyze Trends on the Trend Page
Compare current performance with target and previous year values.
5️⃣ Drill into KPIs
Click any KPI to open the KPI Definition page and understand its formula, definition, and purpose.
6️⃣ Use Insights to Improve Efficiency
Identify delays, fix backlog issues, improve SLA compliance, and boost customer satisfaction.
💼 Who Can Benefit from This Tech Support Efficiency KPI Dashboard in Power BI
This dashboard is ideal for all tech support environments, including:
👨💼 Support Managers
Track team performance, SLA trends, and daily operations.
🏢 IT Operations Teams
Understand ticket volumes, workloads, and bottlenecks.
📞 Customer Support Leaders
Monitor customer satisfaction and improve service delivery.
📊 Business Analysts
Analyze trends, produce reports, and support strategic planning.
🏆 Quality and Compliance Teams
Monitor adherence to SLA standards and service quality benchmarks.
🚀 Organizations Scaling Support Operations
Track KPIs easily as ticket volumes grow.
By using this dashboard consistently, support teams can reduce resolution time, prevent SLA breaches, manage workloads smartly, and maintain high customer satisfaction.
### Click here to read the Detailed blog post
Visit our YouTube channel to learn step-by-step video tutorials
👉 Youtube.com/@PKAnExcelExpert


Reviews
There are no reviews yet.