Managing team productivity is one of the biggest challenges for modern organizations. As tasks increase, priorities shift, deadlines overlap, and responsibilities expand, managers need a clear and accurate way to understand team workload, performance levels, and time utilization. The Team Productivity & Workload Dashboard in Google Sheets is designed to solve exactly this problem. It gives leaders, project managers, and department heads a clean, automated, and ready-to-use dashboard to track task progress, time usage, productivity scores, and workload distribution — all inside one centralized Google Sheets template.Team Productivity & Workload Dashboard in Google Sheets
This dashboard eliminates guesswork and brings complete transparency into team operations. Instead of chasing updates through emails, meetings, or chat messages, managers can instantly see which tasks are pending, who is overloaded, where delays are happening, and how actual work hours compare to planned hours. The dashboard updates automatically when new data is added, making it perfect for daily, weekly, and monthly performance tracking.Team Productivity & Workload Dashboard in Google Sheets
Because it is built entirely in Google Sheets, this system offers real-time collaboration, cloud access, and full customization. Whether your team is small or large, remote or hybrid, this dashboard gives you powerful insights to distribute tasks fairly, improve time management, and boost overall productivity.
✨ Key Features of the Team Productivity & Workload Dashboard in Google Sheets
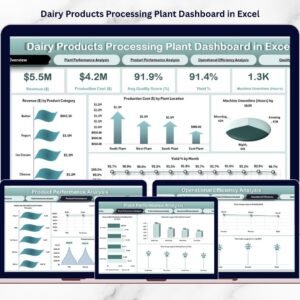
📊 1. Complete Productivity Overview Dashboard
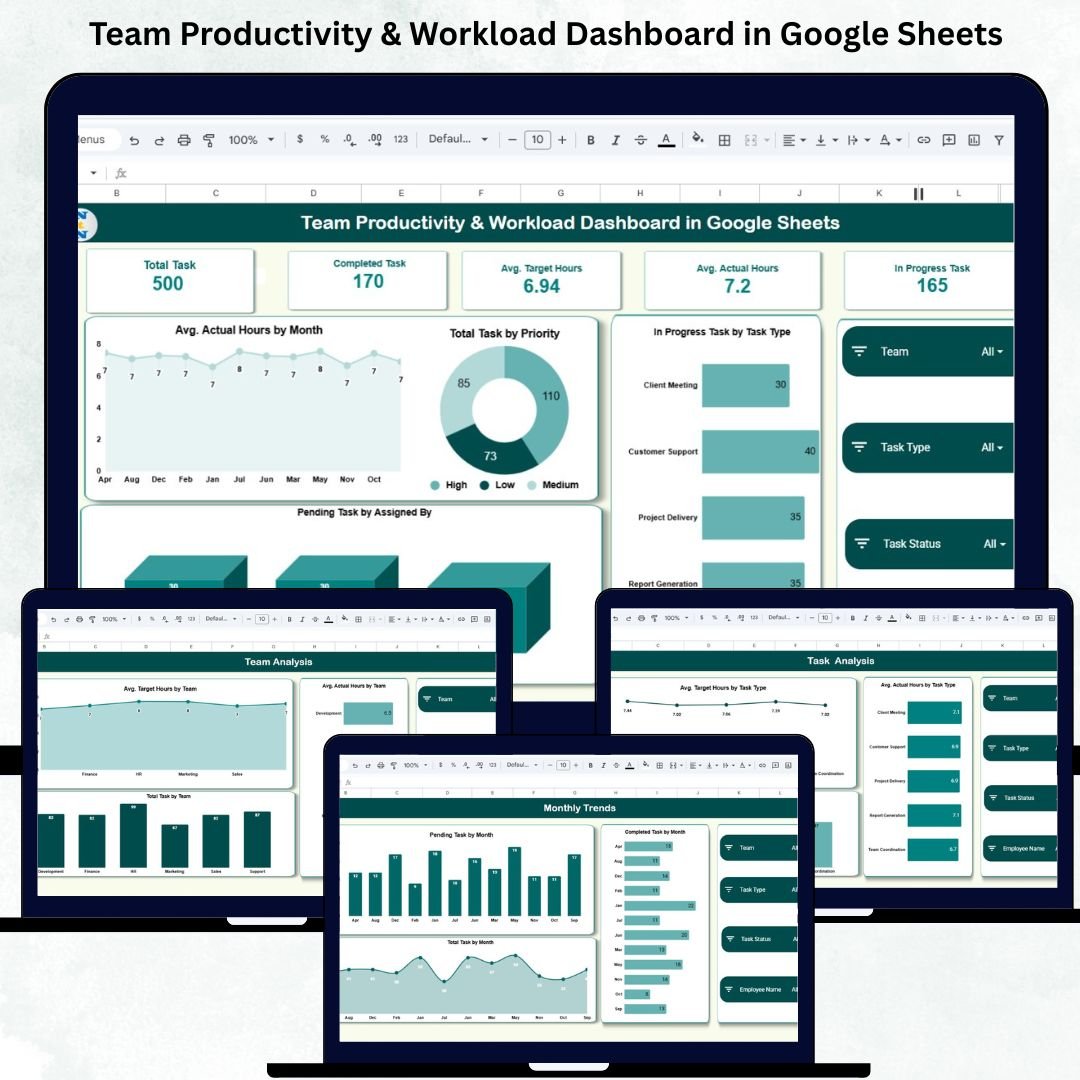
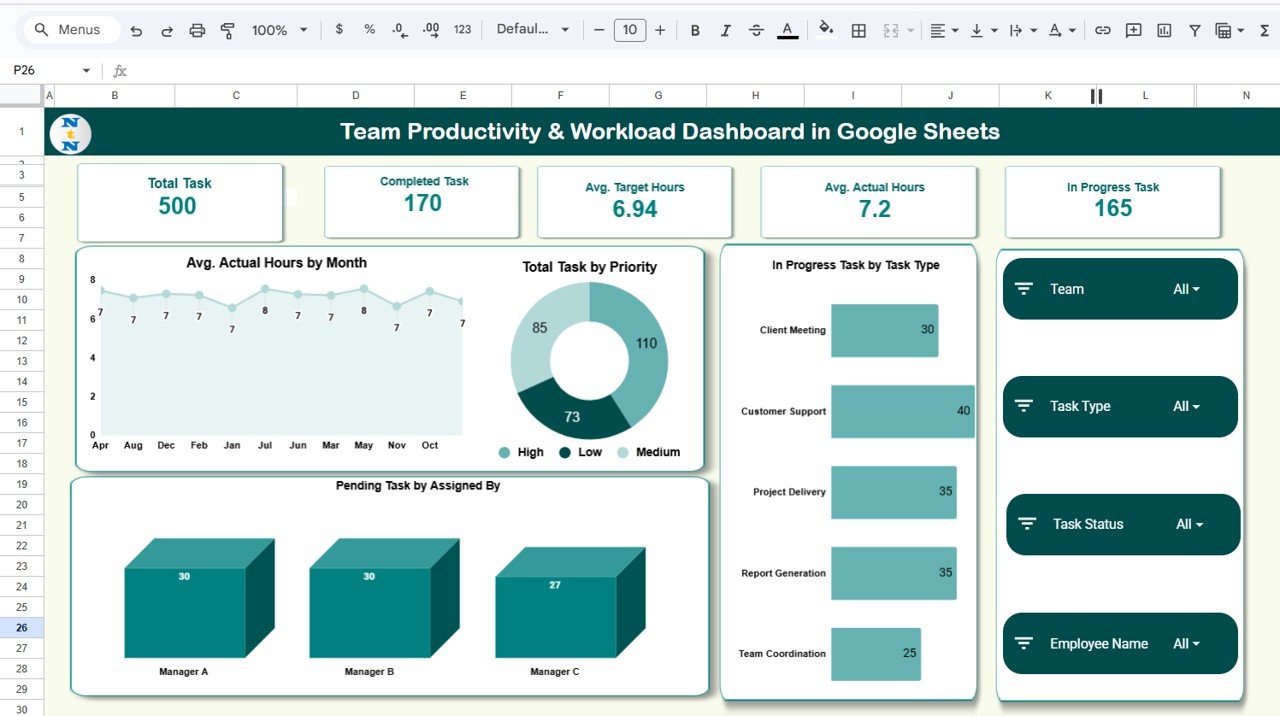
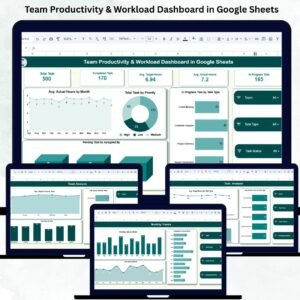
The Overview Sheet displays all the essential KPIs team leaders need, including:
-
Total Tasks
-
Completed Tasks
-
In-Progress Tasks
-
Average Target Hours
-
Average Actual Hours
Along with this, you get powerful charts such as:
-
In Progress Task by Task Type
-
Total Tasks by Priority
-
Avg. Actual Hours by Month
-
Pending Tasks by Assigned By
These insights help managers understand workload patterns, time demands, and performance trends instantly.
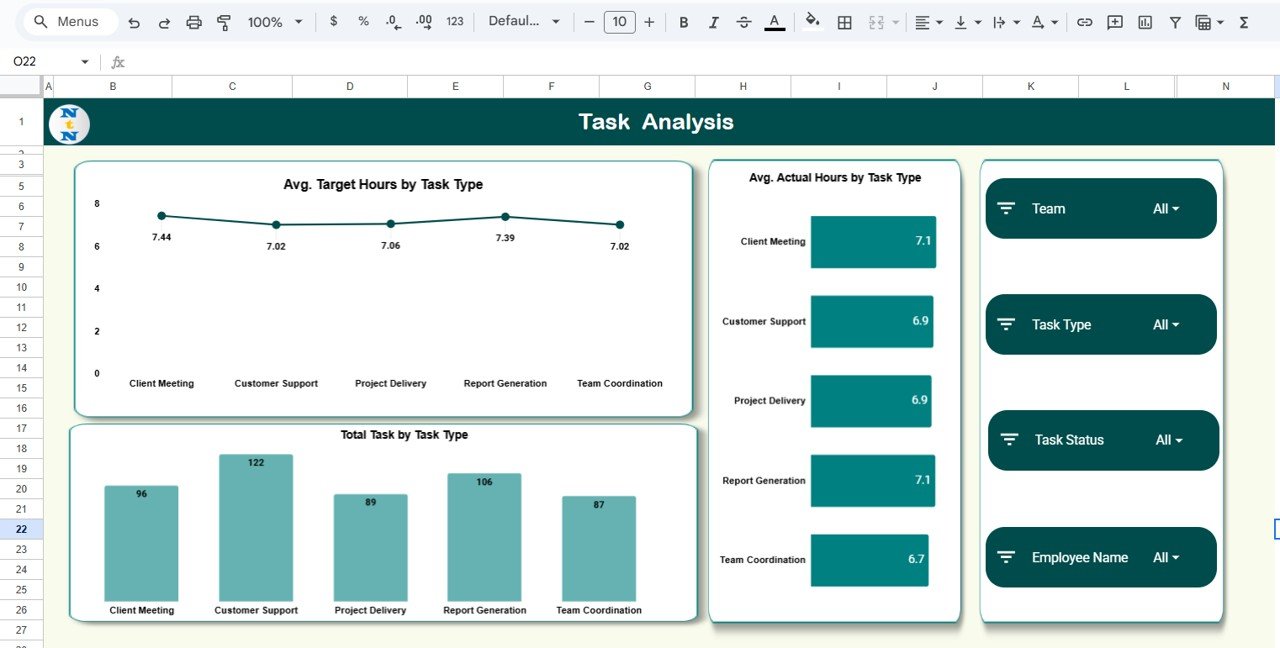
📈 2. Deep Task-Level Analysis
The Task Analysis section shows:
-
Average Target Hours by Task Type
-
Average Actual Hours by Task Type
-
Total Tasks by Task Type
This helps identify which task categories consume the most time and where the majority of work is happening.
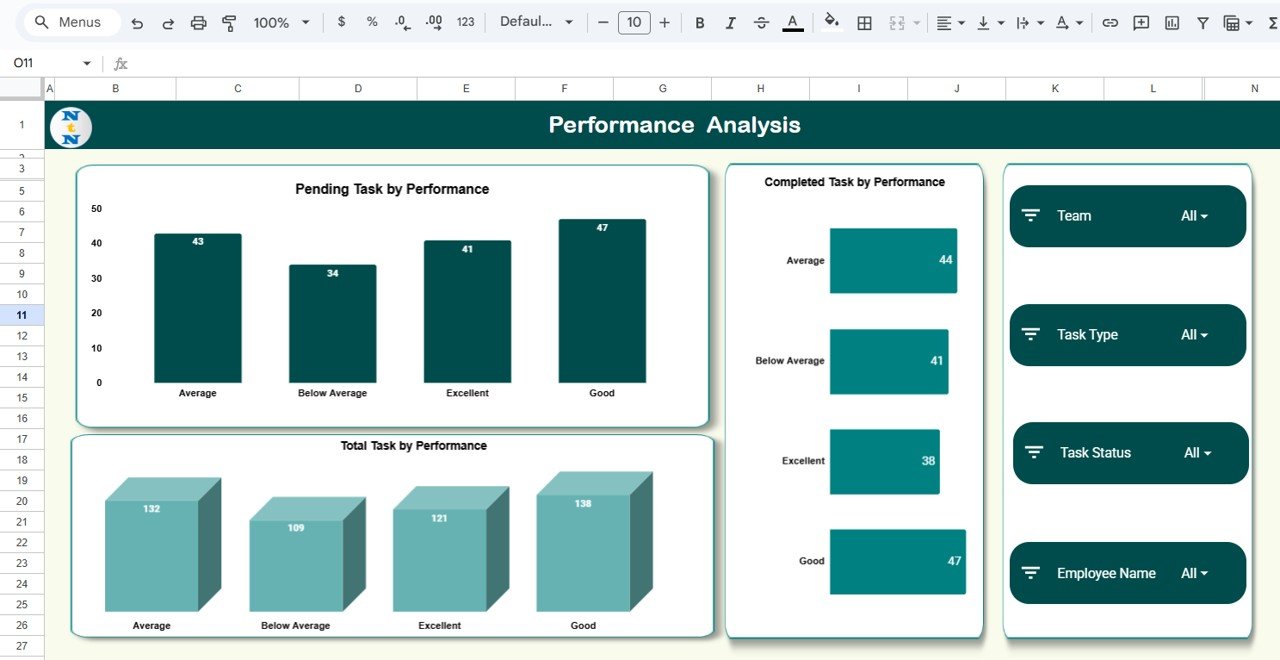
⚡ 3. Performance Analysis for Better Evaluation
Performance Analysis charts include:
-
Pending Tasks by Performance
-
Completed Tasks by Performance
-
Total Tasks by Performance Category
This helps managers identify high performers, team members needing support, and areas where training may be required.
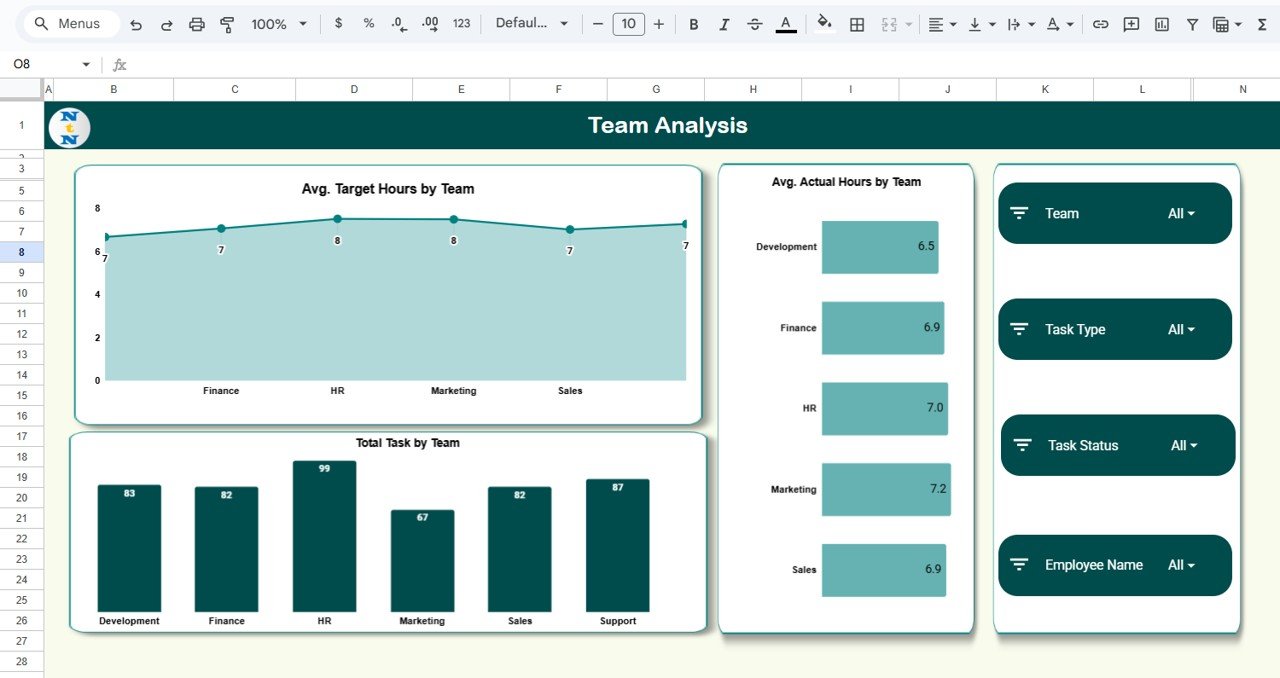
👥 4. Team-Based Workload Analysis
The Team Analysis section highlights:
-
Avg. Target Hours by Team
-
Avg. Actual Hours by Team
-
Total Tasks by Team
This allows management to redistribute tasks, balance workload, and ensure no team is overloaded or underutilized.
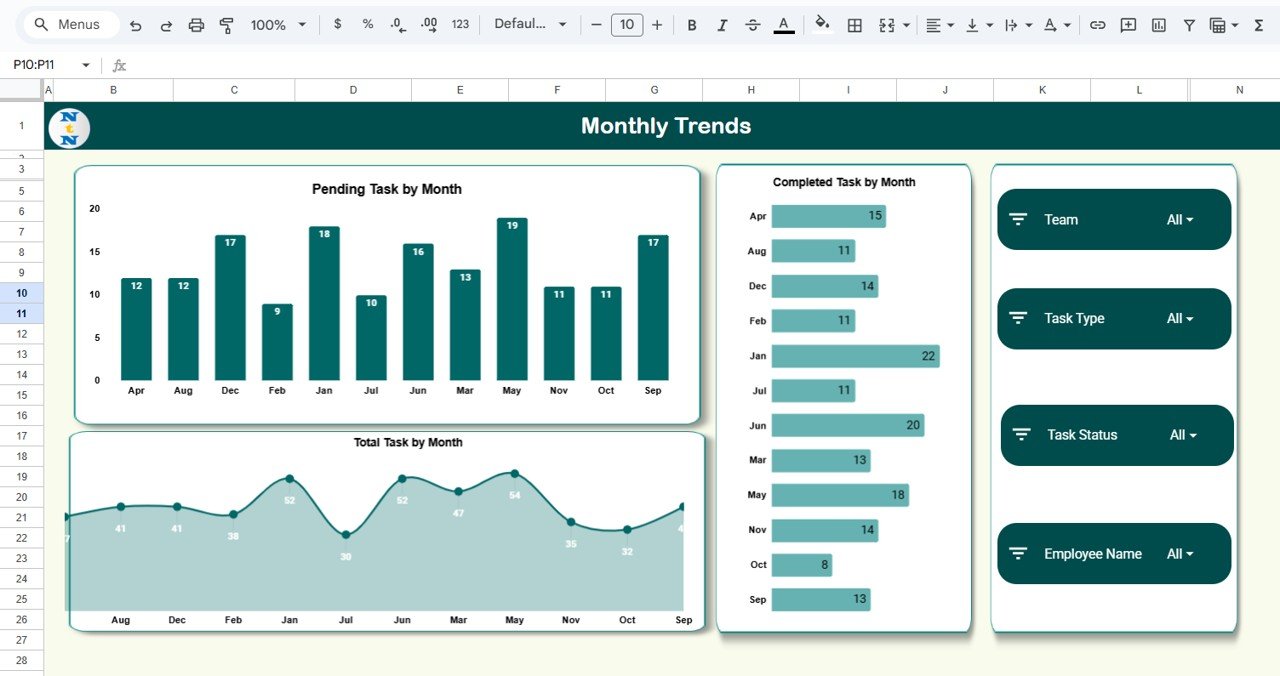
📅 5. Monthly Trend Insights
The Monthly Trends page helps analyze:
-
Pending Tasks by Month
-
Completed Tasks by Month
-
Total Tasks by Month
These insights allow managers to predict workflow peaks, identify productivity drops, and plan resources better.
📦 What’s Inside the Team Productivity & Workload Dashboard in Google Sheets
📊 Overview Sheet – Full Productivity Snapshot
The main dashboard for instant decision-making with all key charts and metrics.
📋 Task Analysis Sheet – Breakdown by Task Type
Perfect for understanding how much time specific categories consume.
📉 Performance Analysis Sheet – Productivity Evaluation
Helps evaluate performance levels across individuals and teams.
👥 Team Analysis Sheet – Workload Distribution
Shows which teams are overworked and which have available capacity.
📅 Monthly Trends Sheet – Time-Based Insights
A clear month-by-month breakdown of overall productivity and workload.
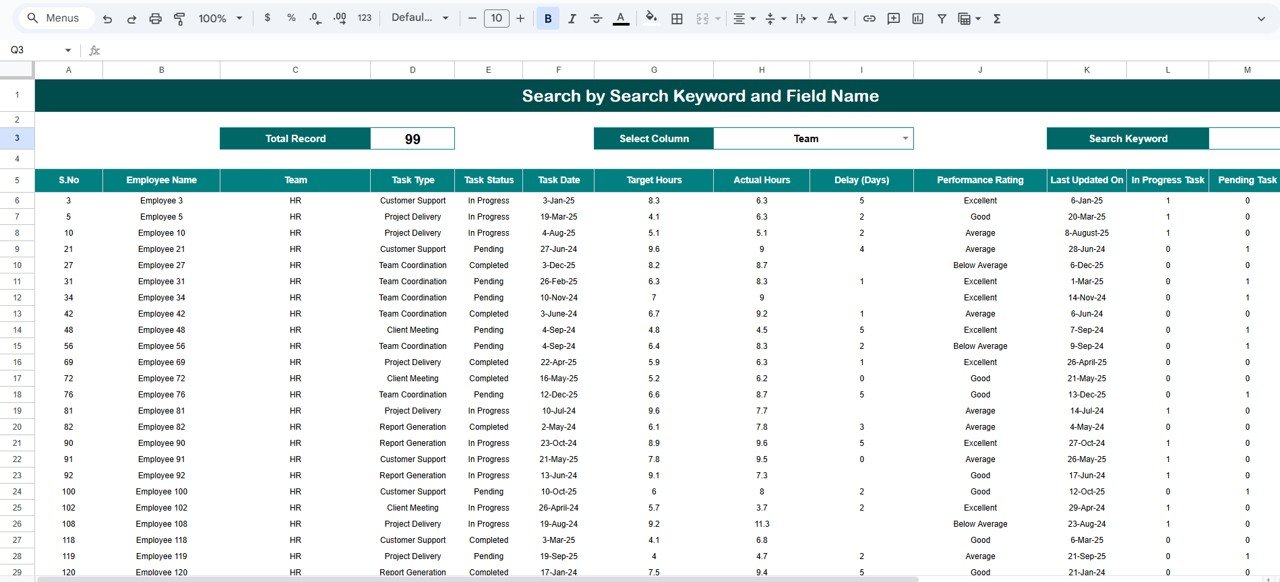
🔍 Search Sheet – Fast Task Lookup
Find any task instantly by keyword or by selecting fields like Task Type, Priority, Team, Assigned By, and Performance Category.
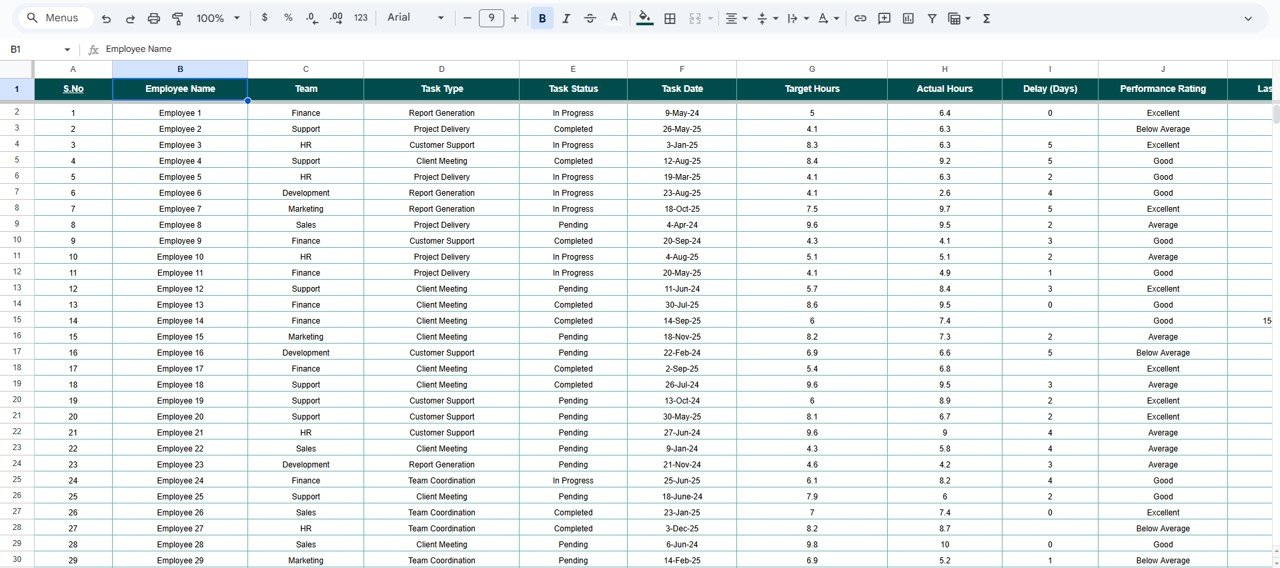
📝 Data Sheet – Raw Task Database
Stores all information including task name, hours, priority, status, team, and more. All dashboard visuals are generated from this sheet automatically.
🛠️ How to Use the Team Productivity & Workload Dashboard in Google Sheets
1️⃣ Add All Tasks to the Data Sheet
Include priority, target hours, actual hours, status, team, and more.
2️⃣ Update Status & Hours Daily
This keeps the dashboard accurate and up to date.
3️⃣ Review Dashboard Insights
Use charts to identify overloaded team members, bottlenecks, and delays.
4️⃣ Compare Target Hours vs Actual Hours
Spot inefficiencies and optimize planning.
5️⃣ Use Monthly Trends for Better Forecasting
Plan upcoming workloads with clear historical insights.
🎯 Who Can Benefit from This Team Productivity & Workload Dashboard in Google Sheets
👨💼 Team Leaders & Managers
Monitor task progress and workload distribution effortlessly.
📋 Project Coordinators
Track deadlines, performance, and time spent across multiple tasks.
🏢 HR & Operations Teams
Evaluate team performance and support resource planning.
👥 Remote & Hybrid Teams
Ensure transparency and alignment across distributed teams.
🧑💻 Freelancers & Small Businesses
Track productivity and workload without complex software.


Reviews
There are no reviews yet.