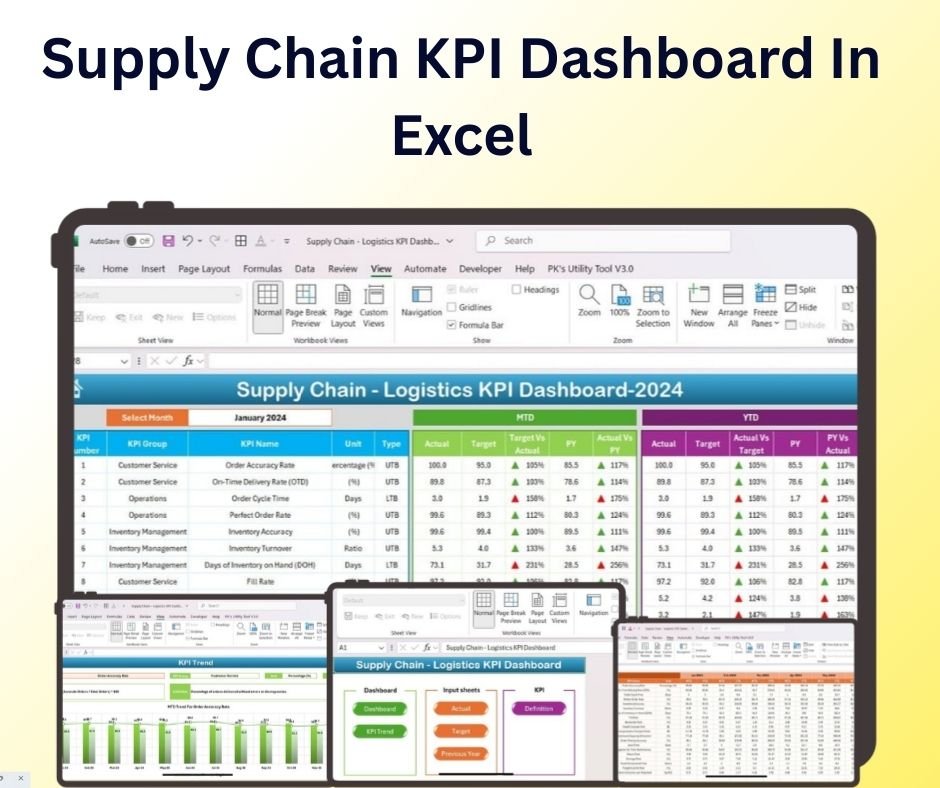
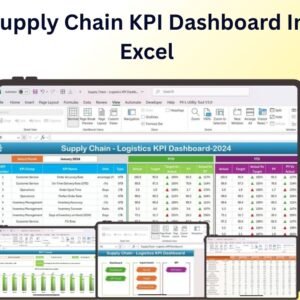
The Supply Chain KPI Dashboard in Excel is an essential tool for businesses seeking to optimize their supply chain management. Designed for supply chain managers, logistics coordinators, and business owners, this Excel-based dashboard provides a comprehensive and easy-to-understand view of your key performance indicators (KPIs). With real-time tracking and visual data representation, this tool allows you to monitor and analyze various aspects of your supply chain—from inventory levels to supplier performance.
This intuitive dashboard enables you to track critical supply chain metrics such as order fulfillment rates, on-time deliveries, inventory turnover, and much more. By visualizing these metrics in an organized format, you can quickly identify areas for improvement, streamline operations, and make data-driven decisions that improve efficiency and reduce costs.

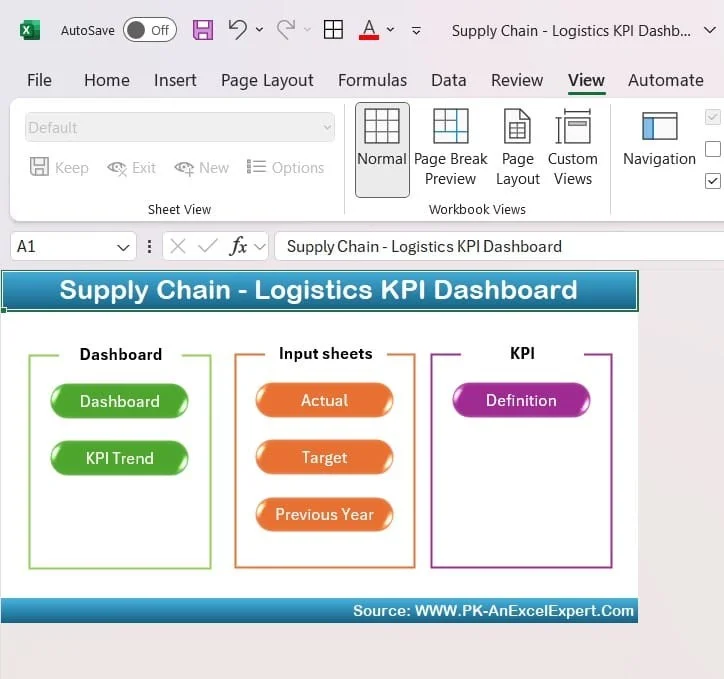
Key Features of the Supply Chain KPI Dashboard in Excel:
📈 Real-Time Performance Tracking
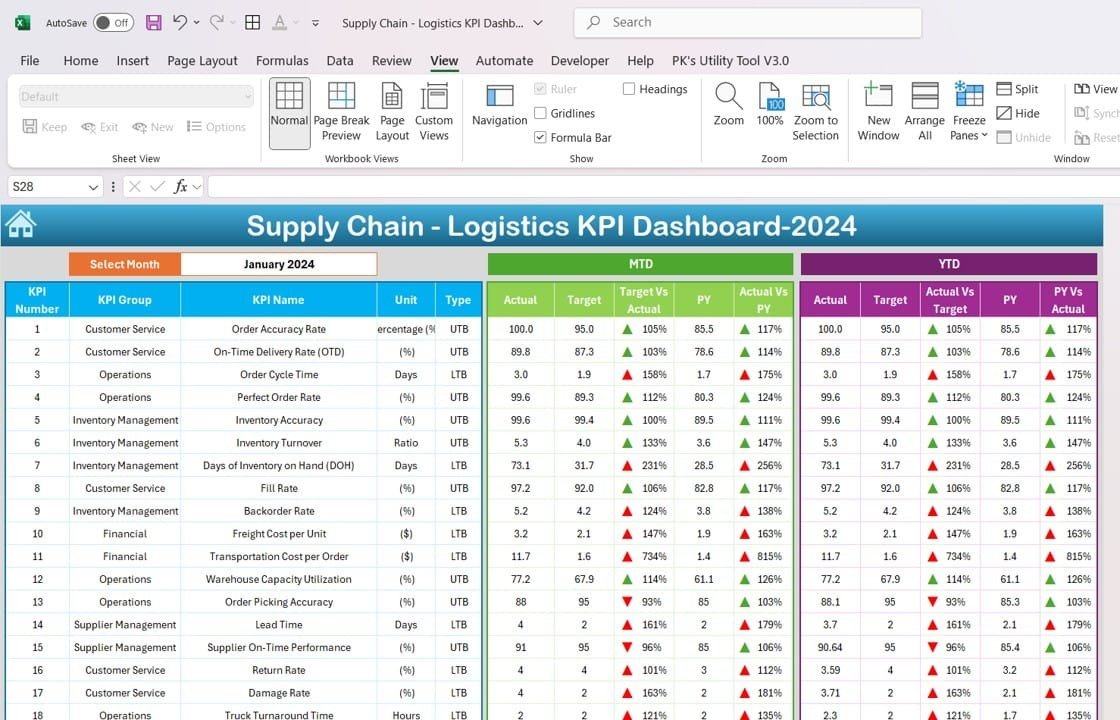
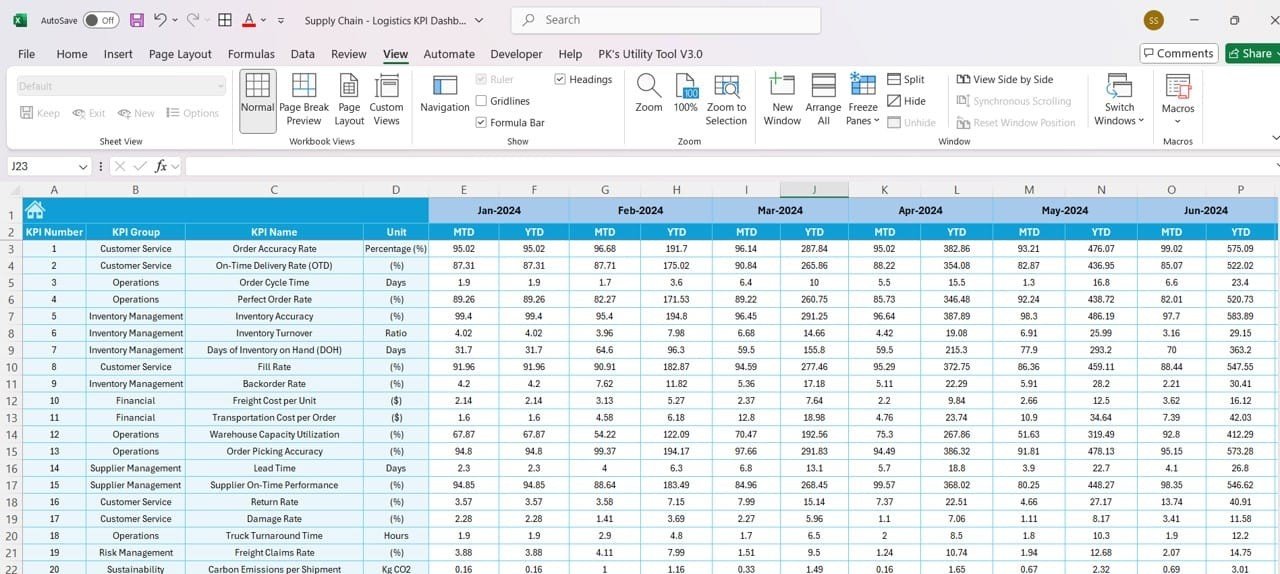
Monitor and analyze key supply chain KPIs such as order fulfillment rates, on-time delivery, inventory turnover, and transportation costs—all in one dashboard.
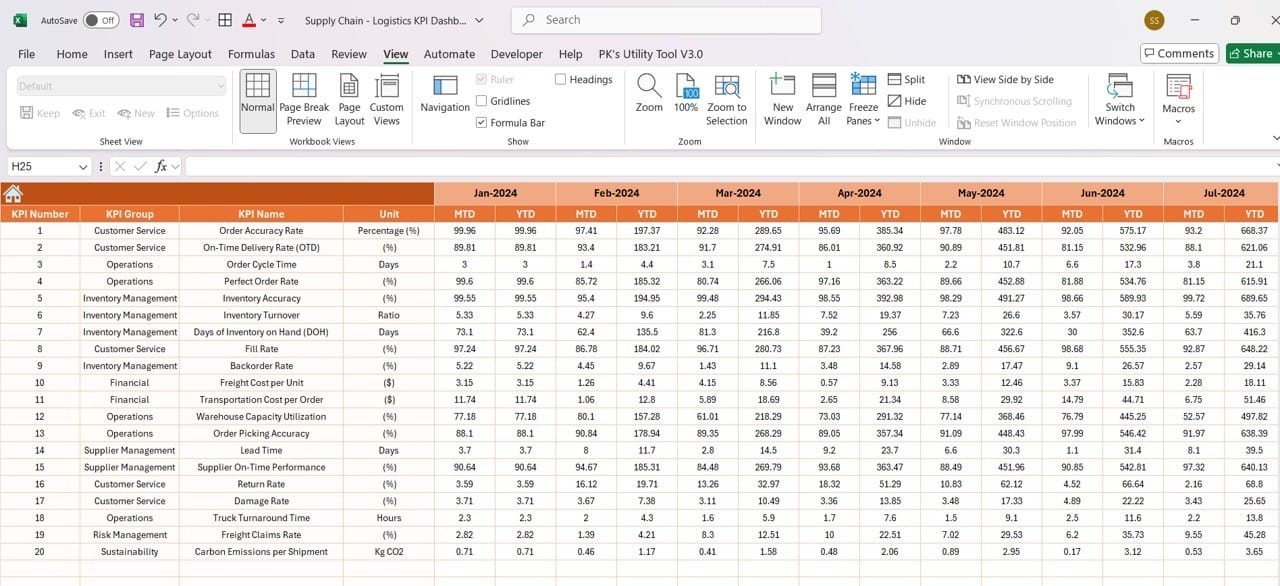
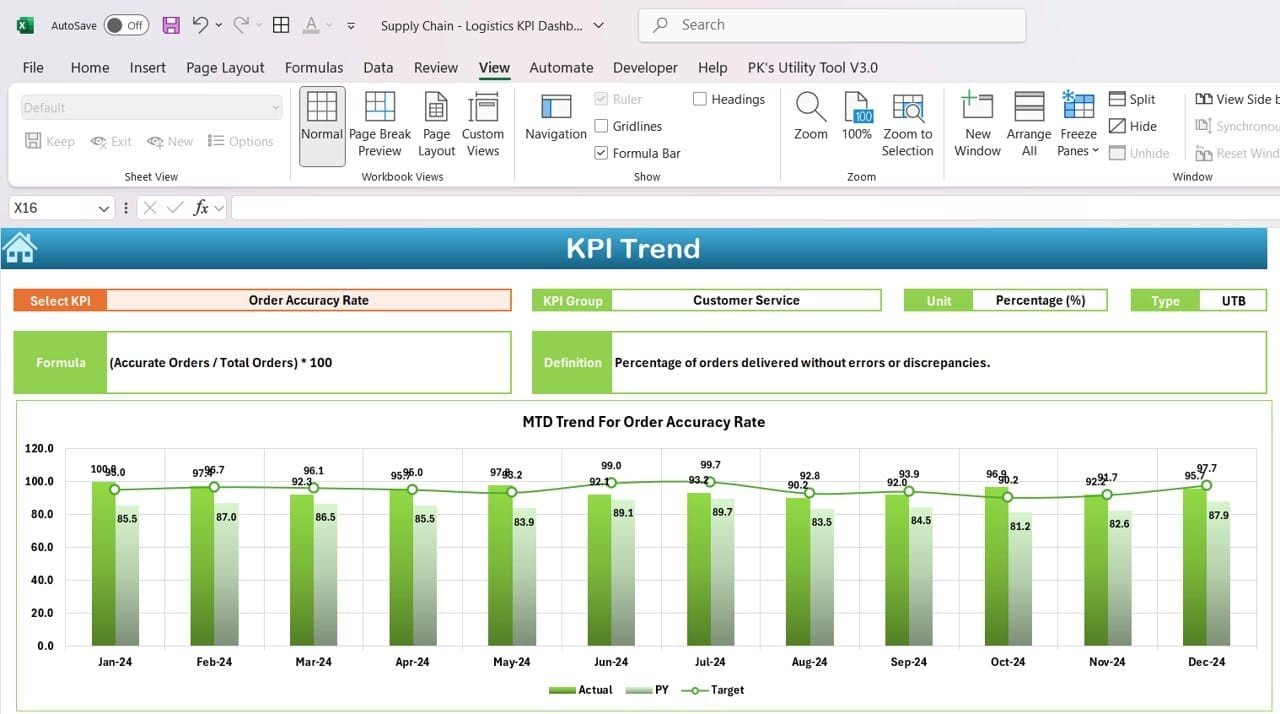
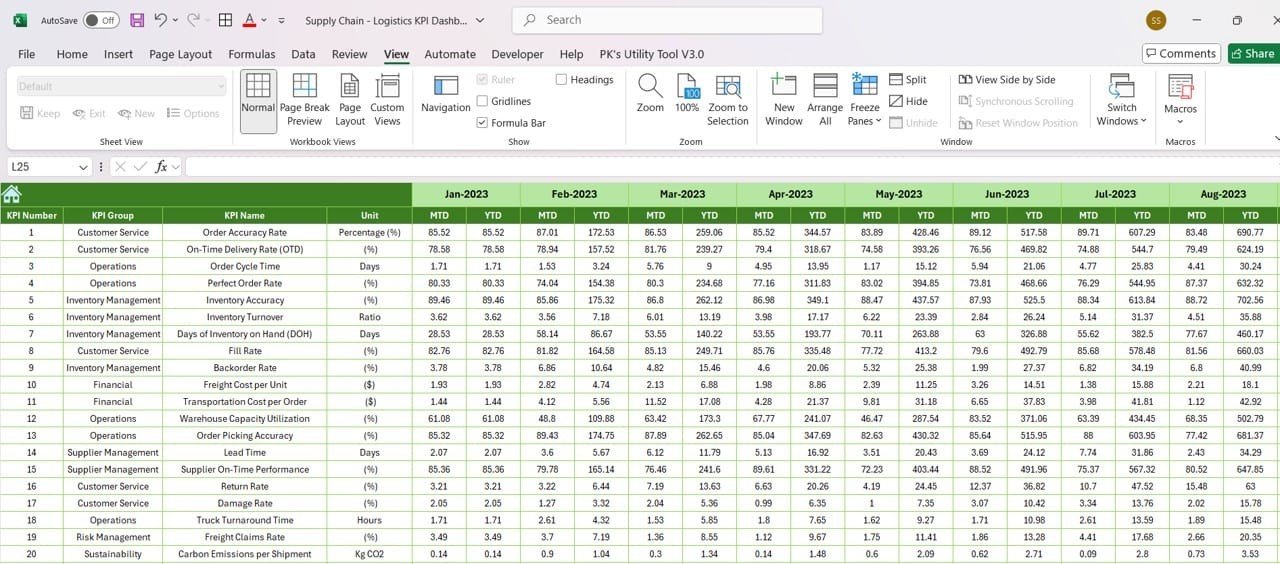
📅 Month-to-Date (MTD) and Year-to-Date (YTD) Tracking
Track performance across months and years, allowing you to identify long-term trends and quickly address emerging issues.
📊 Visual Trend Analysis
Easily visualize trends in key supply chain metrics with interactive charts and graphs that make complex data simple to interpret.
🎯 Target Setting and Comparison
Set targets for each KPI and compare them with actual performance. This feature helps you stay on track and make adjustments when necessary.
📉 Conditional Formatting Alerts
Get real-time visual alerts with color-coded indicators to quickly identify performance deviations. Green for on-target, yellow for caution, and red for issues that need attention.
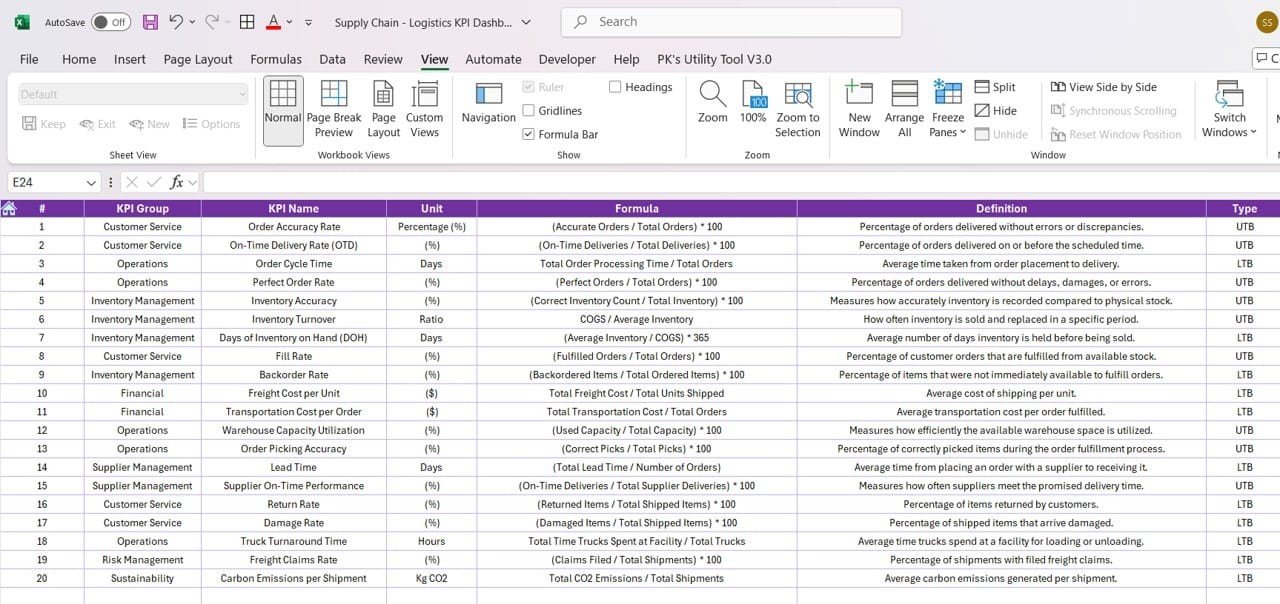
🛠 Customizable Inputs
Easily input your own data, adjust for specific supply chain needs, and customize KPIs to fit your business objectives.
📦 Inventory Tracking
Monitor inventory levels, inventory turnover rates, and stock-outs to ensure that your supply chain operates efficiently.
🚚 Supplier Performance Monitoring
Evaluate the performance of your suppliers by tracking key metrics such as delivery times and quality.
🚀 Why You’ll Love the Supply Chain KPI Dashboard in Excel:
✅ Efficient Supply Chain Management – Keep your entire supply chain process organized and efficient by tracking and analyzing key KPIs in one place.
✅ Data-Driven Decision Making – Make informed decisions quickly by visualizing trends and comparing actual performance against targets.
✅ Improves Efficiency – Identify bottlenecks, streamline operations, and optimize the supply chain for cost-effective performance.
✅ User-Friendly Interface – The dashboard is easy to navigate and designed for both technical and non-technical users.
✅ Highly Customizable – Tailor the dashboard to track the specific metrics that matter most to your business.
What’s Inside the Supply Chain KPI Dashboard in Excel:
- Order Fulfillment Rate KPI: Measure how many orders are delivered on time compared to total orders.
- On-Time Delivery KPI: Track the percentage of deliveries that are made on time.
- Inventory Turnover KPI: Measure how often your inventory is sold and replaced over a period.
- Transportation Cost KPI: Track the costs associated with transportation and logistics.
- Supplier Performance KPI: Measure delivery times, quality, and overall reliability of your suppliers.
- Stock-Out Rate: Keep track of stock-outs and adjust your procurement strategies accordingly.
How to Use the Supply Chain KPI Dashboard in Excel:
1️⃣ Download the Template – Instantly access the Excel file upon purchase.
2️⃣ Enter Data – Input your supply chain metrics into the pre-built fields in the template.
3️⃣ Set Targets – Define your KPI targets based on your business objectives.
4️⃣ Track Performance – Monitor your supply chain’s performance in real time and identify areas for improvement.
5️⃣ Generate Reports – Export your data and performance trends for analysis and reporting.
Who Can Benefit from the Supply Chain KPI Dashboard in Excel:
- Supply Chain Managers
- Logistics Coordinators
- Operations Managers
- Business Owners
- Procurement Teams
- E-Commerce Businesses
- Manufacturing Companies
Optimize your supply chain operations with this simple yet powerful Excel dashboard. Monitor, track, and analyze the KPIs that drive your business’s success.
Click here to read the Detailed blog post
https://www.pk-anexcelexpert.com/supply-chain-kpi-dashboard-in-excel/
Visit our YouTube channel to learn step-by-step video tutorials
Youtube.com/@PKAnExcelExpert


Reviews
There are no reviews yet.