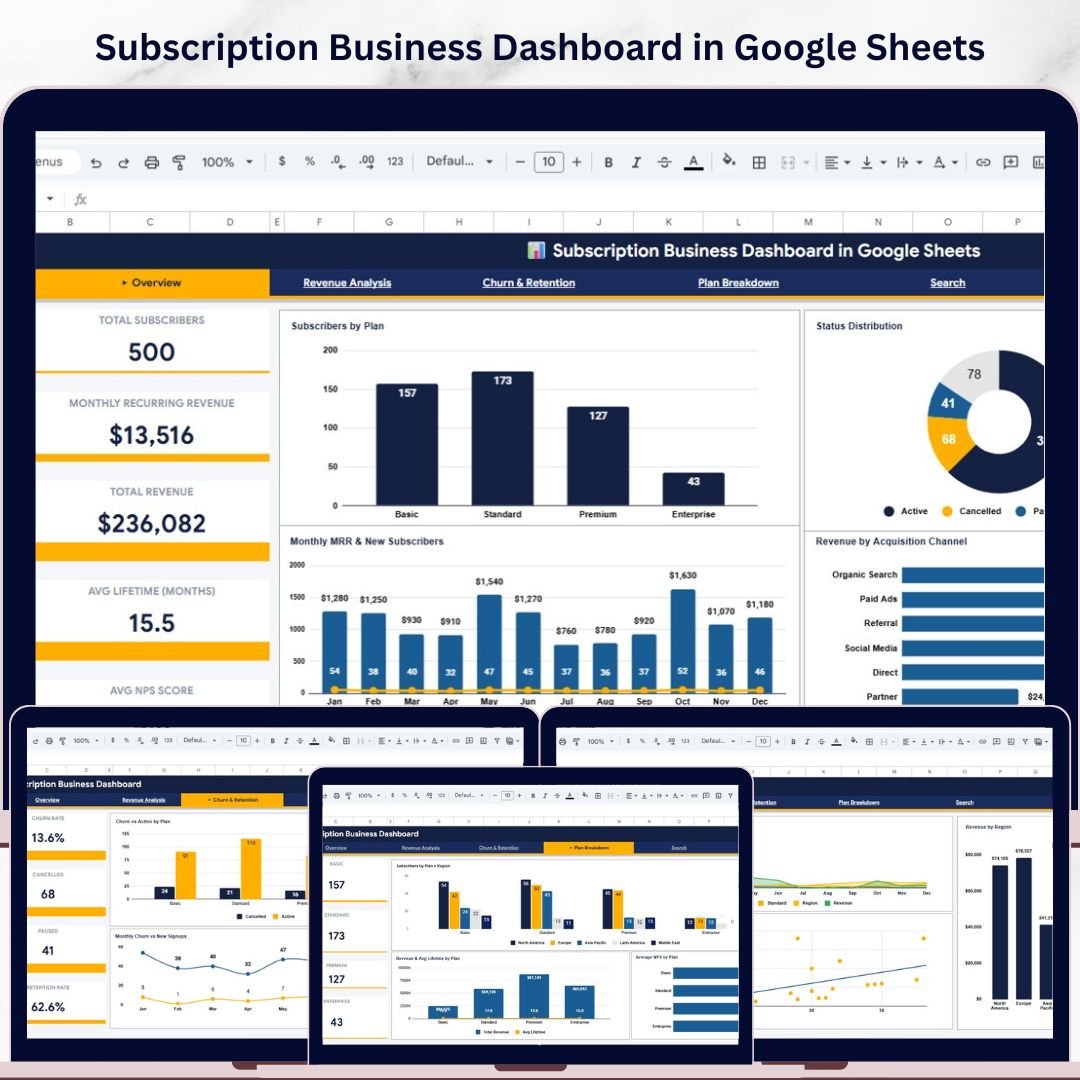
Subscription Business Dashboard in Google Sheets – Track MRR, Churn, and Subscriber Growth Like a Pro
Subscription Business Dashboard in Google Sheets is a powerful, ready-to-use analytics template designed for SaaS founders, subscription box operators, membership site owners, and recurring-revenue businesses. This dashboard includes 6 interactive pages that track your most critical subscription metrics — from Monthly Recurring Revenue (MRR) and churn rates to plan breakdowns and individual subscriber lookups. Simply paste your data and let the dashboard do the heavy lifting. This template tracks 5 high-level KPI cards across the overview page and delivers deep-dive analysis across revenue, retention, plan performance, and subscriber details.
🔑 Key Features of Subscription Business Dashboard in Google Sheets
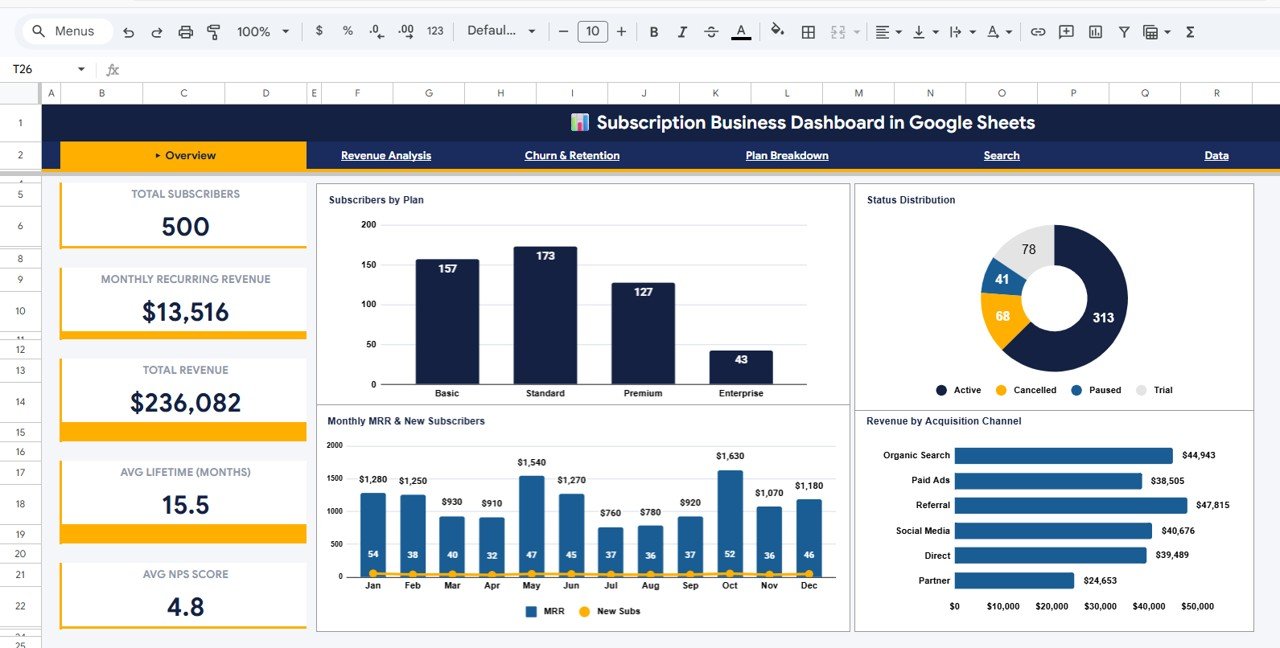
📌 5 KPI Summary Cards – Instantly view Total Subscribers, Monthly Recurring Revenue, Total Revenue, Average Lifetime (Months), and Average NPS Score right from the Overview page.
📌 Interactive Slicers and Filters – Apply multiple slicers on the Overview page to filter the entire dashboard by plan, status, region, channel, or any dimension you need.
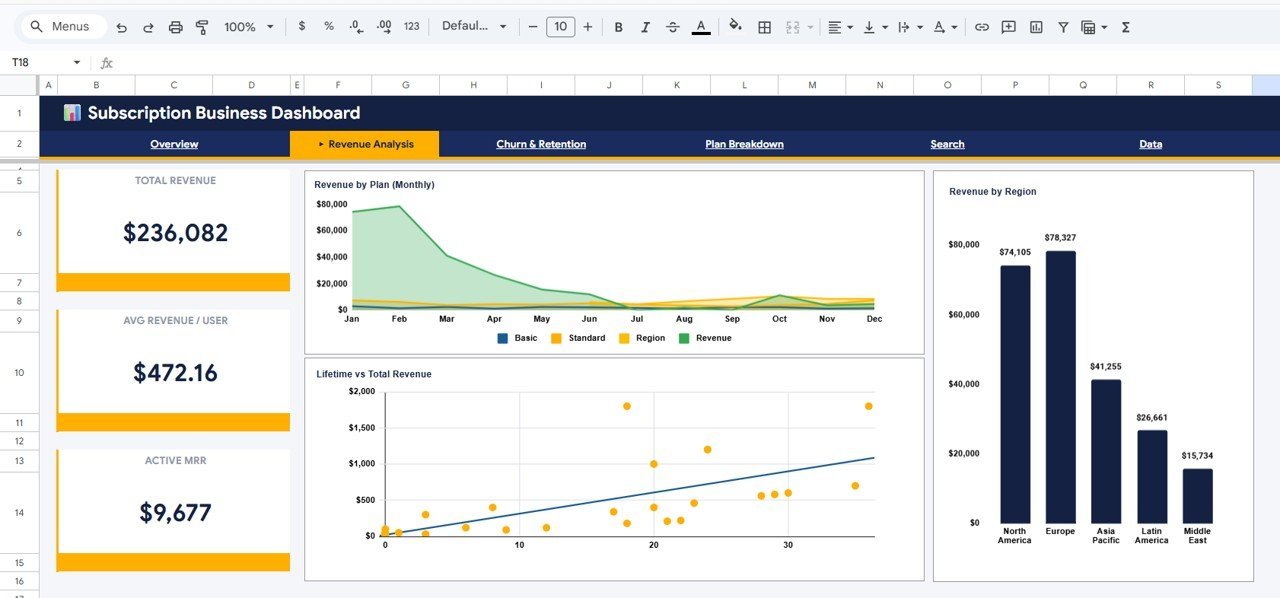
📌 Revenue Deep-Dive Analysis – Dedicated Revenue Analysis page with Revenue by Plan (Monthly), Revenue by Region, and Lifetime vs Total Revenue breakdowns.
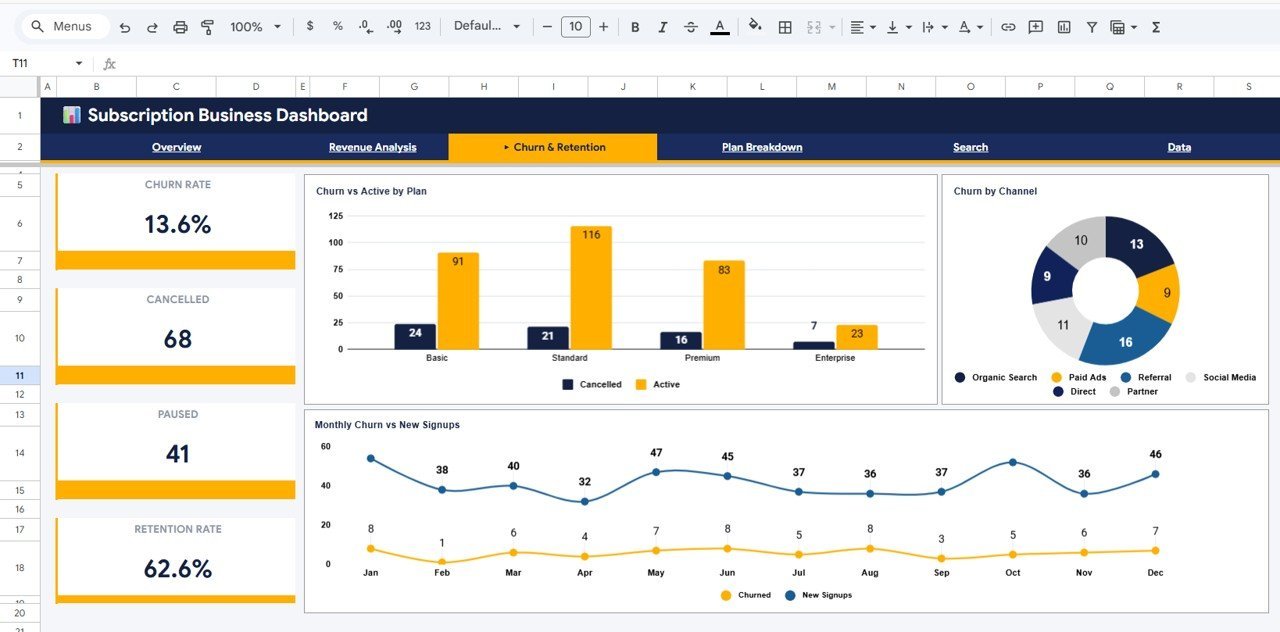
📌 Churn and Retention Tracking – Monitor Churn vs Active by Plan, Churn by Channel, and Monthly Churn vs New Signups trends to identify and reduce subscriber losses.
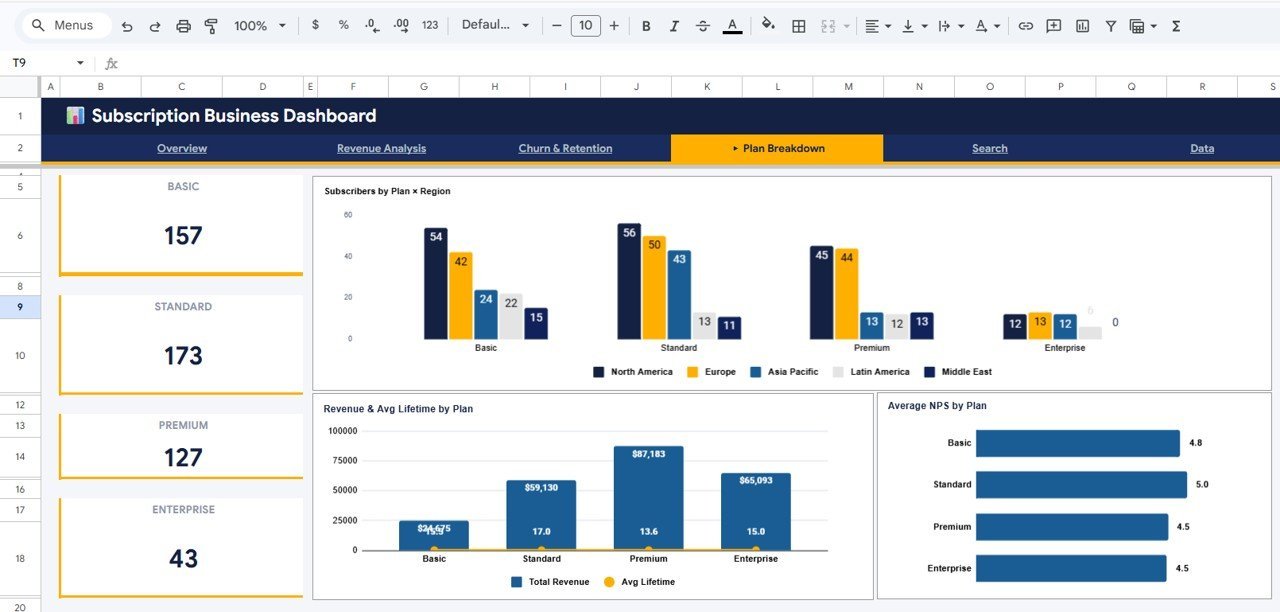
📌 Plan Performance Breakdown – Analyze Subscribers by Plan x Region, Revenue and Avg Lifetime by Plan, and Average NPS by Plan to understand which plans drive the most value.
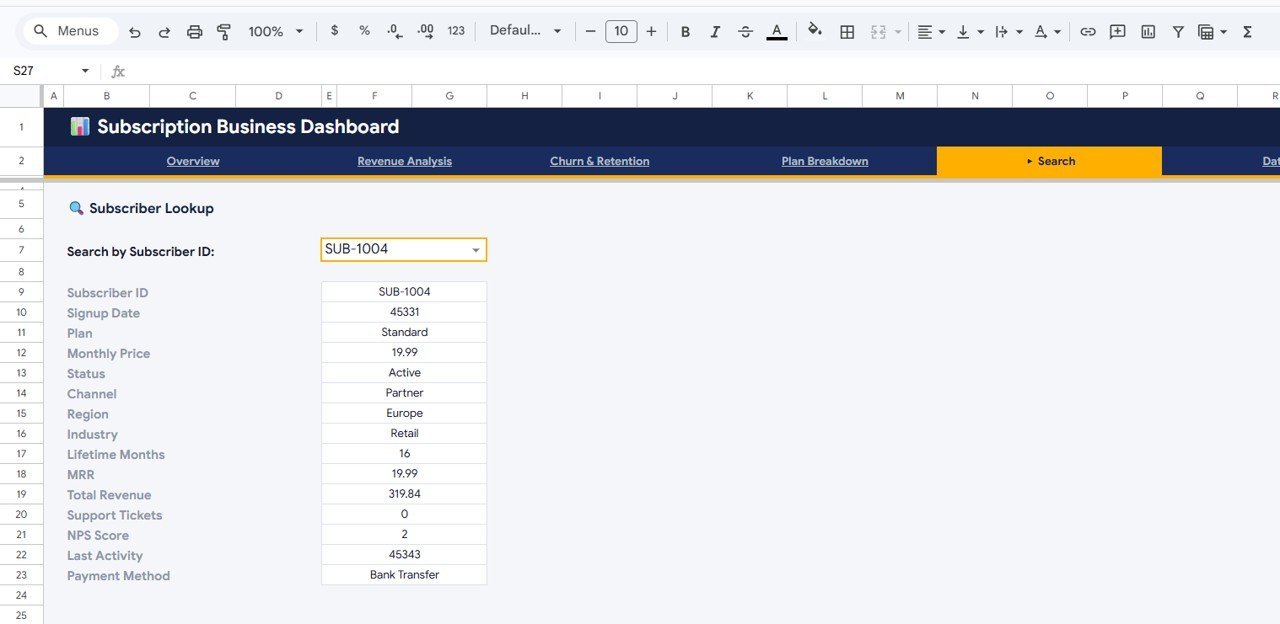
📌 Subscriber Lookup Search – Select any Subscriber ID from a dropdown and instantly view their complete profile including Plan, Monthly Price, Status, Channel, Region, Industry, Lifetime Months, MRR, Total Revenue, Support Tickets, NPS Score, Last Activity, and Payment Method.
📌 Plug-and-Play Data Sheet – Enter your subscription data in the structured Data sheet and the entire dashboard updates automatically with zero manual formula work.
📌 No Advanced Skills Required – Built entirely in Google Sheets with native charts and formulas. No macros, no add-ons, no coding needed.
Explore more Google Sheets Dashboard Templates from our collection.
📦 What’s Inside the Subscription Business Dashboard in Google Sheets
This template contains 6 professionally designed sheet tabs:
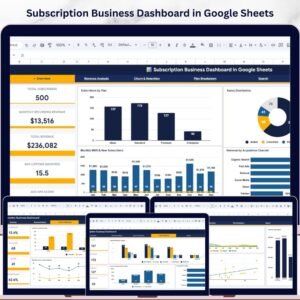
📊 Overview Page – High-level KPI cards (Total Subscribers, MRR, Total Revenue, Avg Lifetime, Avg NPS Score) plus charts for Subscribers by Plan, Status Distribution, Monthly MRR and New Subscribers, and Revenue by Acquisition Channel. Interactive slicers let you filter the entire view instantly.
📊 Revenue Analysis – Detailed revenue insights with Revenue by Plan (Monthly), Revenue by Region, and Lifetime vs Total Revenue visualizations that help you spot your highest-performing segments.
📊 Churn and Retention – Critical retention metrics including Churn vs Active by Plan, Churn by Channel, and Monthly Churn vs New Signups trends so you can take action before it’s too late.
📊 Plan Breakdown – Cross-dimensional analysis with Subscribers by Plan x Region, Revenue and Avg Lifetime by Plan, and Average NPS by Plan to pinpoint which plans and regions are your strongest performers.
📊 Subscriber Lookup – A powerful search page where you select a Subscriber ID from a dropdown and instantly see all 14+ data fields for that subscriber — perfect for customer support and account reviews.
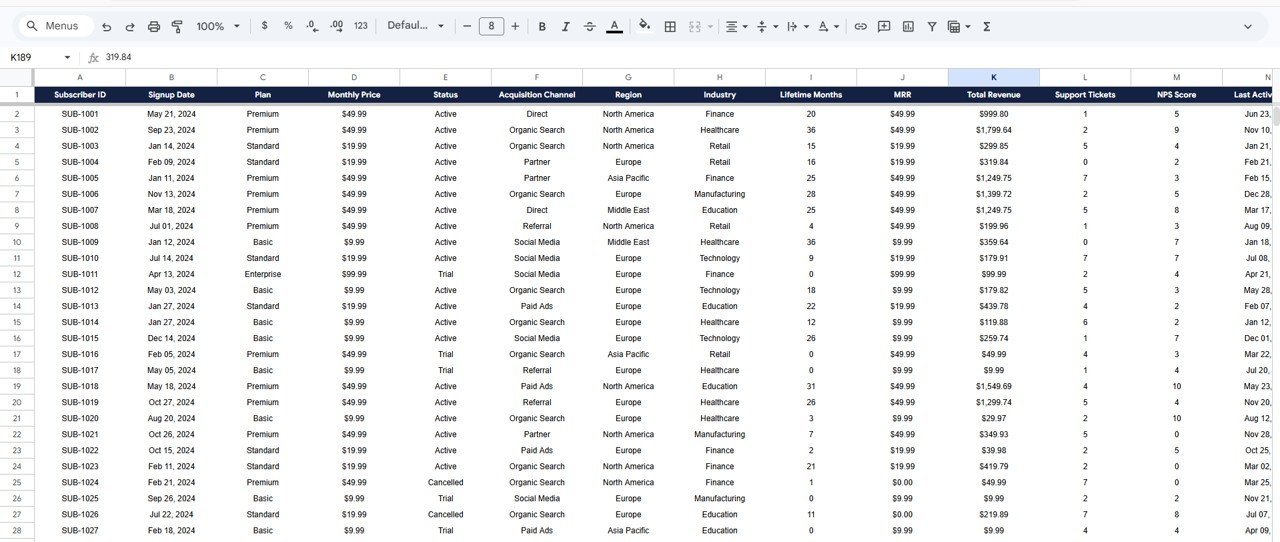
📊 Data Sheet – The structured input sheet where you add your subscription data in the provided format. All dashboard pages pull from this sheet automatically.
Looking for SaaS analytics in other formats? Check out the SaaS Metrics Dashboard in Google Sheets or the SaaS Metrics Dashboard in Excel.
⚙️ How to Use the Subscription Business Dashboard in Google Sheets
1️⃣ Open the PDF guide included in your download and click the Google Sheets copy link to create your own editable copy in Google Drive.
2️⃣ Navigate to the Data sheet tab and replace the sample data with your own subscription records — maintain the same column format for best results.
3️⃣ Head to the Overview page to see your KPI cards and charts update automatically. Use the slicers to filter by plan, status, channel, or region.
4️⃣ Explore the Revenue Analysis, Churn and Retention, and Plan Breakdown tabs for deep-dive insights into your subscription business health.
5️⃣ Use the Subscriber Lookup page to quickly pull up any individual subscriber’s complete details using the dropdown selector.
👥 Who Can Benefit from This Subscription Business Dashboard
🎯 SaaS Founders and Product Managers – Track MRR, churn, and subscriber growth to make data-driven product and pricing decisions.
🎯 Subscription Box Businesses – Monitor plan performance, acquisition channels, and customer lifetime to optimize marketing spend.
🎯 Membership Site Operators – Analyze retention patterns and NPS scores to improve member satisfaction and reduce cancellations.
🎯 Finance and Revenue Teams – Get a clear picture of recurring revenue, regional performance, and revenue forecasts.
🎯 Customer Success Teams – Use the Subscriber Lookup page for quick account reviews and support ticket context.
Also explore our Subscription Retention KPI Dashboard in Google Sheets for focused retention tracking.
❓ Frequently Asked Questions
What KPIs does the Subscription Business Dashboard in Google Sheets track?
The dashboard tracks 5 top-level KPIs: Total Subscribers, Monthly Recurring Revenue (MRR), Total Revenue, Average Subscriber Lifetime in Months, and Average NPS Score. It also provides detailed breakdowns across revenue, churn, plan performance, and individual subscriber data across 6 sheet tabs.
Can I use this dashboard for my SaaS business?
Absolutely. This template is built specifically for subscription-based and SaaS businesses. It tracks MRR, churn rates, acquisition channels, plan-level revenue, and NPS scores — all the metrics a SaaS company needs to monitor recurring revenue health.
Do I need any Google Sheets add-ons or coding skills?
No. The Subscription Business Dashboard uses only native Google Sheets formulas and charts. There are no macros, add-ons, or scripts required. Simply paste your data in the Data sheet and everything updates automatically.
How do I add my own data to this subscription dashboard?
Go to the Data sheet tab, clear the sample data, and enter your subscription records in the same column format. All 5 dashboard pages — Overview, Revenue Analysis, Churn and Retention, Plan Breakdown, and Subscriber Lookup — will update instantly.
What is the Subscriber Lookup page used for?
The Subscriber Lookup page lets you select any Subscriber ID from a dropdown and view all their details including Plan, Monthly Price, Status, Channel, Region, Industry, Lifetime Months, MRR, Total Revenue, Support Tickets, NPS Score, Last Activity, and Payment Method. It is ideal for customer support and quick account reviews.
What is the best Google Sheets template for tracking subscription revenue and churn?
The Subscription Business Dashboard in Google Sheets from NextGenTemplates is one of the best options. It provides a complete subscription analytics suite with MRR tracking, churn analysis, plan breakdowns, and a subscriber lookup — all in a single Google Sheets file with no coding required.
🔗 Explore Related Templates
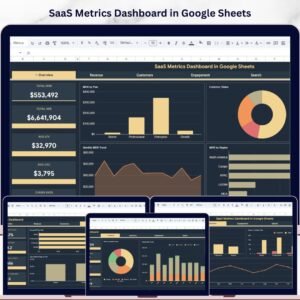
📎 SaaS Metrics Dashboard in Google Sheets – Comprehensive SaaS metrics tracking with ARR, MRR, and customer acquisition analysis.
📎 Etsy Seller Analytics Dashboard in Google Sheets – Track your Etsy store performance with revenue, orders, and product-level insights.
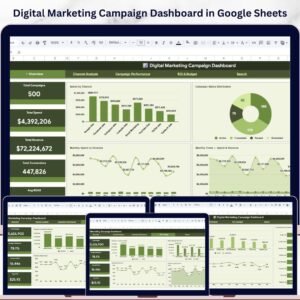
📎 Digital Marketing Campaign Dashboard in Google Sheets – Analyze your marketing campaigns with channel-level spend, ROI, and conversion tracking.
📖 Click here to read the Detailed Blog Post about Subscription Business Dashboard in Google Sheets
Watch the step-by-step video tutorial:


Reviews
There are no reviews yet.