
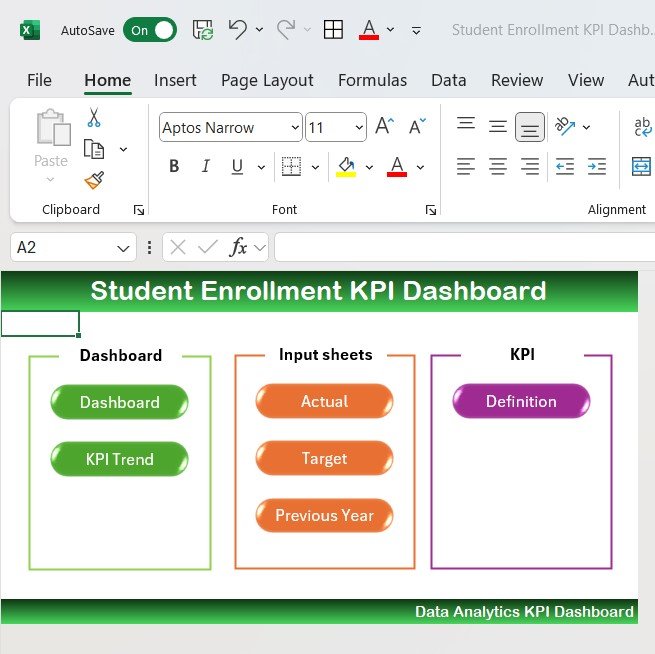


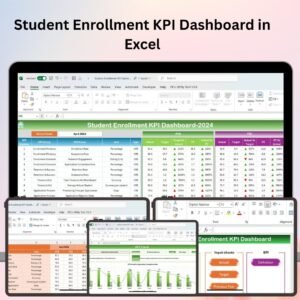
The Student Enrollment KPI Dashboard in Excel is an essential tool for educational institutions, academic administrators, and enrollment teams looking to track and analyze the key performance indicators (KPIs) related to student enrollment processes. This Excel-based dashboard provides real-time insights into student application trends, enrollment numbers, retention rates, and overall admission performance, helping you optimize the enrollment strategy and improve decision-making.
With an intuitive design, customizable features, and powerful data visualization, this dashboard allows you to manage and analyze the enrollment process effectively, ensuring that your institution meets its student intake goals.

Key Features of the Student Enrollment KPI Dashboard in Excel:
🎓 Enrollment Data Tracking
Track the number of applications, accepted students, and enrolled students, broken down by program, department, and other relevant categories.
📊 Applicant Demographics and Diversity
Analyze applicant demographics, including age, gender, location, and academic background, ensuring your institution attracts a diverse pool of students.
📈 Retention and Dropout Rates
Monitor student retention, track dropout rates, and measure the success of your institution’s student engagement and retention strategies.
💡 Admissions Process Efficiency
Track the efficiency of your admissions process, from application submission to final enrollment, helping you identify bottlenecks and improve processing times.
💸 Financial Performance and Scholarships
Monitor the financial impact of student enrollment, including scholarship allocations, tuition fees, and other financial metrics.
🚀 Why You’ll Love the Student Enrollment KPI Dashboard in Excel:
✅ Streamline Enrollment Management – Easily track and manage the number of applicants, accepted students, and those who have enrolled, ensuring you meet your enrollment targets.
✅ Improve Admissions Efficiency – Analyze the efficiency of your enrollment process and identify areas where you can improve application processing and student engagement.
✅ Track Retention and Dropout Rates – Measure retention and dropout rates to understand student engagement and identify opportunities for improvement in student support services.
✅ Enhance Decision-Making – Use the data to make informed decisions about recruitment strategies, financial aid, and institutional resources based on real-time enrollment performance.
✅ Customizable and User-Friendly – Fully customizable to fit your institution’s needs, with an easy-to-navigate design that ensures seamless tracking and analysis of key metrics.
✅ Data-Driven Insights – Use visual charts and data to track performance trends and monitor the success of your institution’s admissions strategy.
What’s Inside the Student Enrollment KPI Dashboard in Excel:
-
Enrollment Data: Track the number of applicants, accepted students, and final enrollments by program, department, and other categories.
-
Demographics and Diversity: Analyze applicant demographics such as gender, age, geographic location, and academic background to ensure a diverse student body.
-
Retention and Dropout Rates: Track and measure student retention and dropout rates to assess the effectiveness of engagement strategies.
-
Admissions Process: Track the admissions process from application submission to enrollment, identifying areas where improvements can be made for a more efficient process.
-
Financial Tracking: Monitor tuition fees, scholarships, and other financial aspects related to student enrollment to assess the financial impact of admissions.
-
Custom Reports: Generate customized reports summarizing key metrics such as enrollment numbers, retention rates, financial data, and demographic trends.
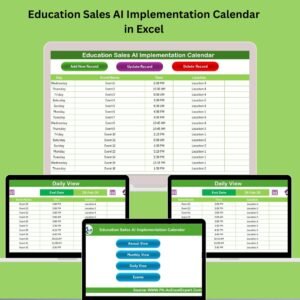
How to Use the Student Enrollment KPI Dashboard in Excel:
1️⃣ Download the Template – Instantly access your Excel file upon purchase.
2️⃣ Enter Enrollment Data – Add data for student applications, accepted students, enrolled students, and demographic information to start tracking KPIs.
3️⃣ Monitor Key Metrics – Use the dashboard to track and visualize data on enrollment, retention, dropout rates, and admissions efficiency in real-time.
4️⃣ Analyze Demographic Trends – Track the diversity of applicants and enrolled students to ensure your institution is attracting a diverse student body.
5️⃣ Generate Reports – Create detailed reports summarizing enrollment performance, financial data, and demographic trends to help make informed strategic decisions.
Who Can Benefit from the Student Enrollment KPI Dashboard in Excel:
-
Admissions and Enrollment Teams
-
Academic Administrators
-
Enrollment and Recruitment Managers
-
Financial Aid Officers
-
HR Teams in Education Institutions
-
University and College Managers
-
Private and Public Educational Institutions
-
Government Education Departments
The Student Enrollment KPI Dashboard in Excel is the perfect tool for institutions looking to streamline their enrollment processes, monitor key performance metrics, and make data-driven decisions. Whether you’re tracking student applications, retention rates, or financial aspects of enrollment, this dashboard helps ensure your institution’s enrollment goals are met efficiently.
Click here to read the Detailed blog post
https://www.pk-anexcelexpert.com/student-enrollment-kpi-dashboard-in-excel/
Visit our YouTube channel to learn step-by-step video tutorials
Youtube.com/@PKAnExcelExpert


Reviews
There are no reviews yet.