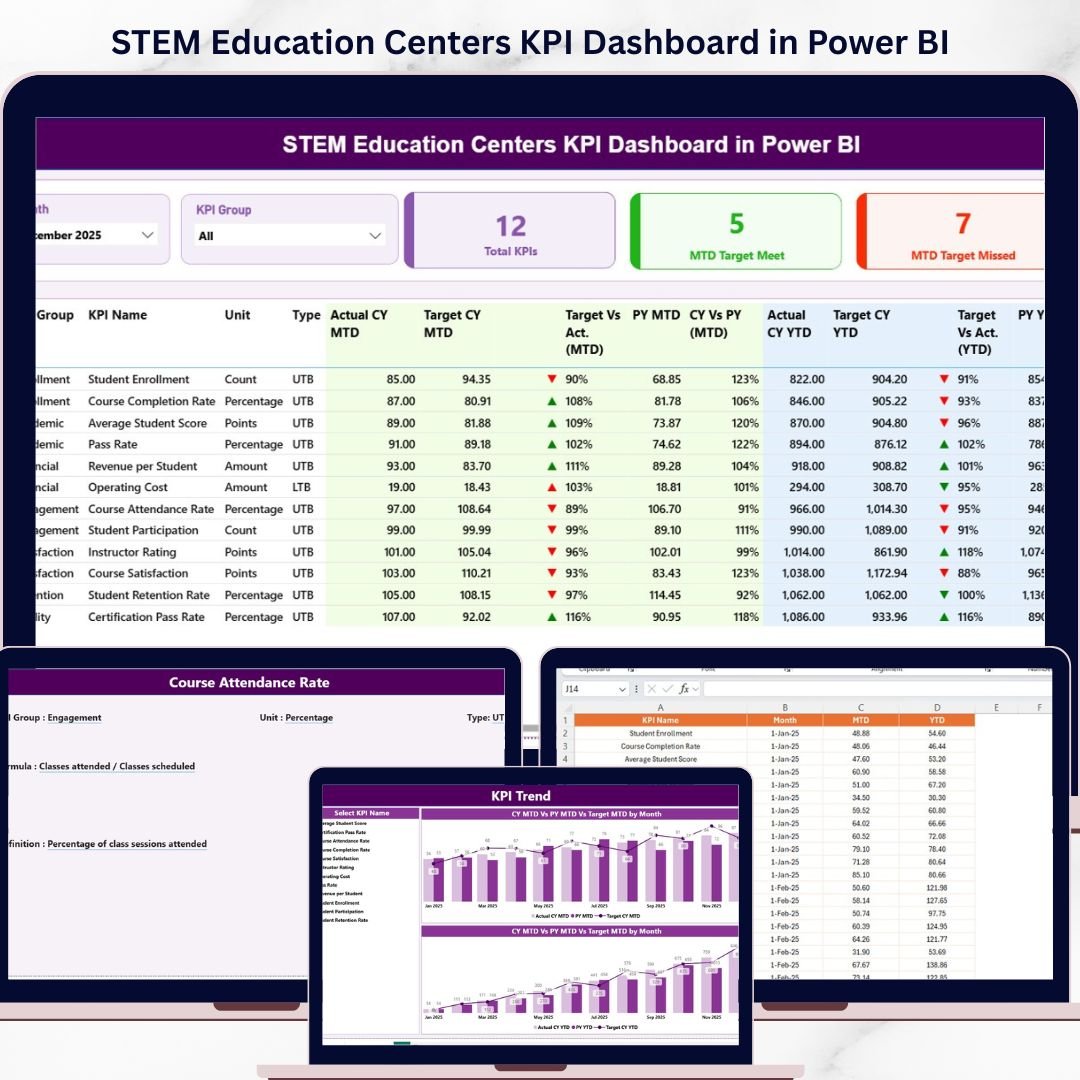
Key Features of STEM Education Centers KPI Dashboard in Power BI
Unlock the full potential of your STEM Education Center’s performance tracking with our STEM Education Centers KPI Dashboard in Power BI. This powerful, ready-to-use digital product enables you to monitor, analyze, and optimize key performance indicators (KPIs) effortlessly. Simply update your data in the provided Excel file, connect it with the Power BI dashboard, and refresh to see real-time insights.
The dashboard offers a comprehensive 3-page layout designed specifically for STEM education centers to track monthly and yearly performance metrics with precision. Key features include:
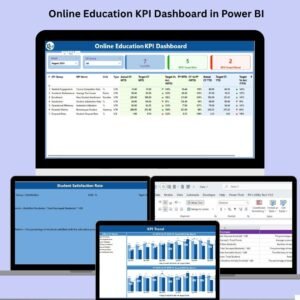
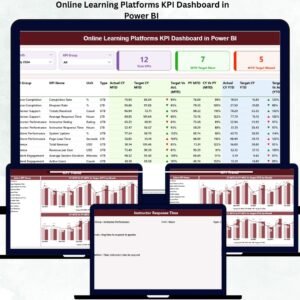
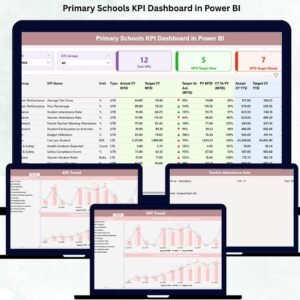
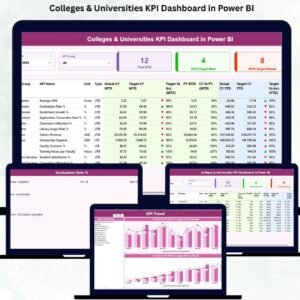
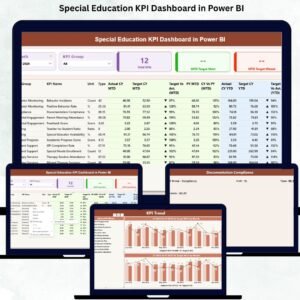
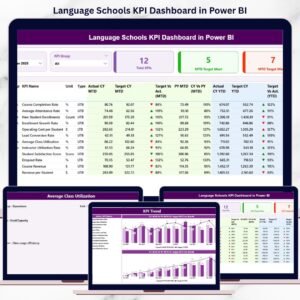
- 📊 Summary Page: This is the heart of the dashboard featuring Month and KPI Group slicers for quick data filtering. View total KPIs count, Month-to-Date (MTD) target meet and missed counts via intuitive cards. The detailed table below displays KPI Number, Group, Name, Unit, and Type (Lower the Better or Upper the Better), along with actual vs target data for both MTD and Year-to-Date (YTD) periods. Visual status icons (up/down arrows in red/green) provide instant KPI performance feedback.
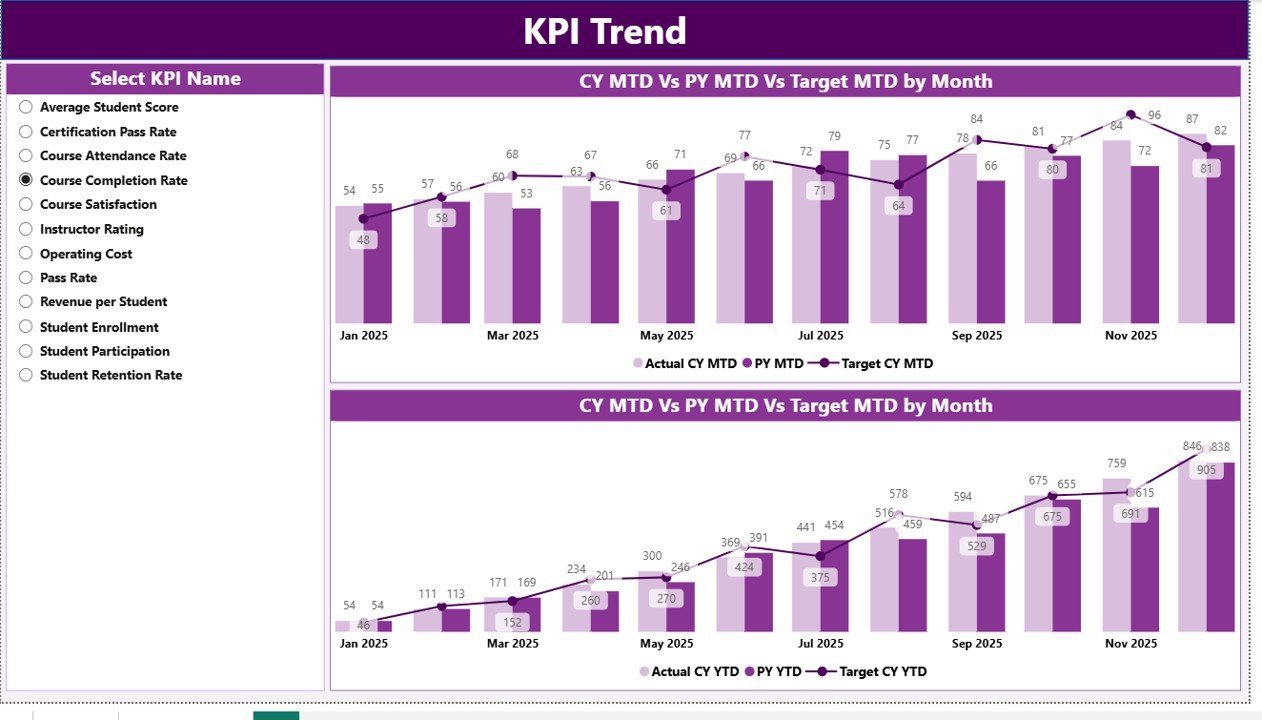
- 📈 KPI Trend Page: Analyze trends with two combo charts showing Actual Numbers for Current Year, Previous Year, and Targets for both MTD and YTD. Easily select specific KPIs using a slicer for deeper insights.
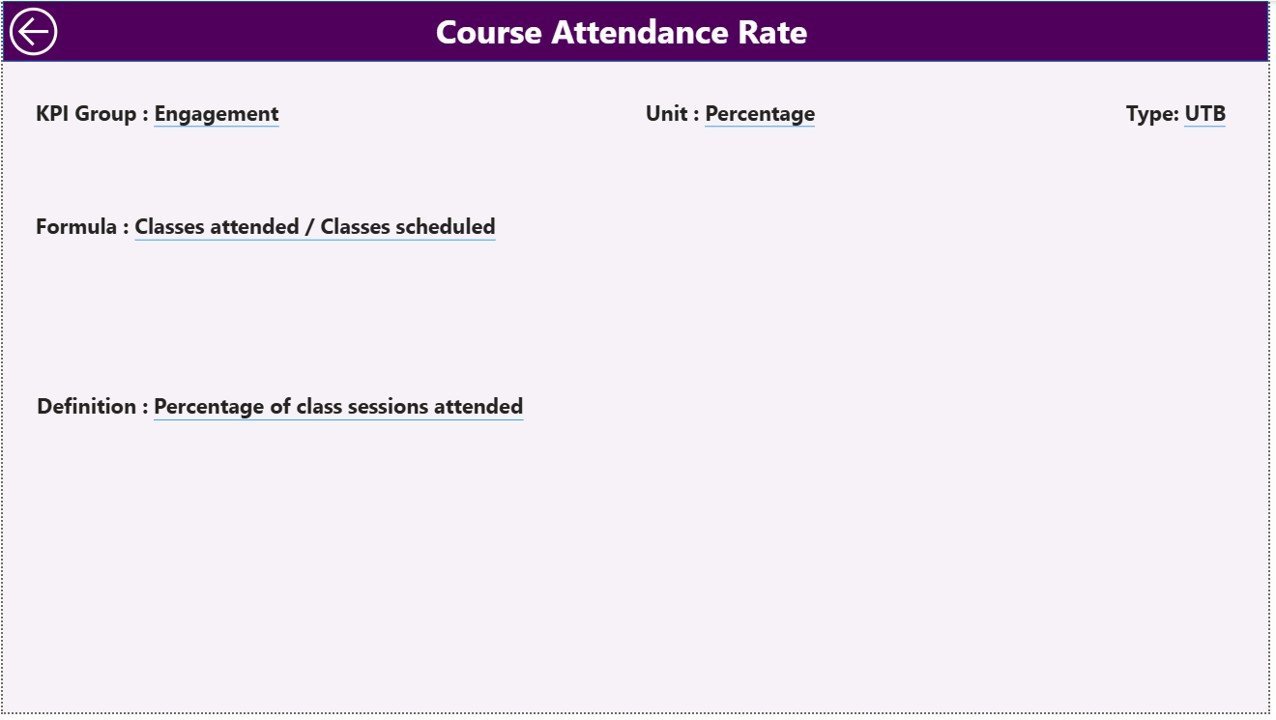
- 📚 KPI Definition Page: A hidden drill-through page accessible from the Summary Page. Here you can explore detailed KPI definitions, formulas, and descriptions to understand each metric thoroughly. A convenient back button takes you to the main page seamlessly.
What’s Inside the STEM Education Centers KPI Dashboard in Power BI
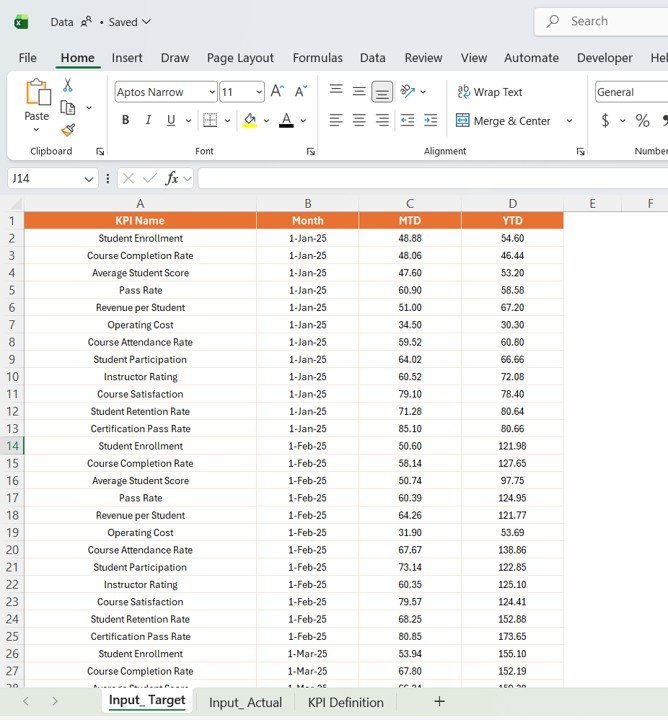
This digital product includes a fully functional Power BI (.pbix) file and an Excel data source with three worksheets designed for simplicity and accuracy:
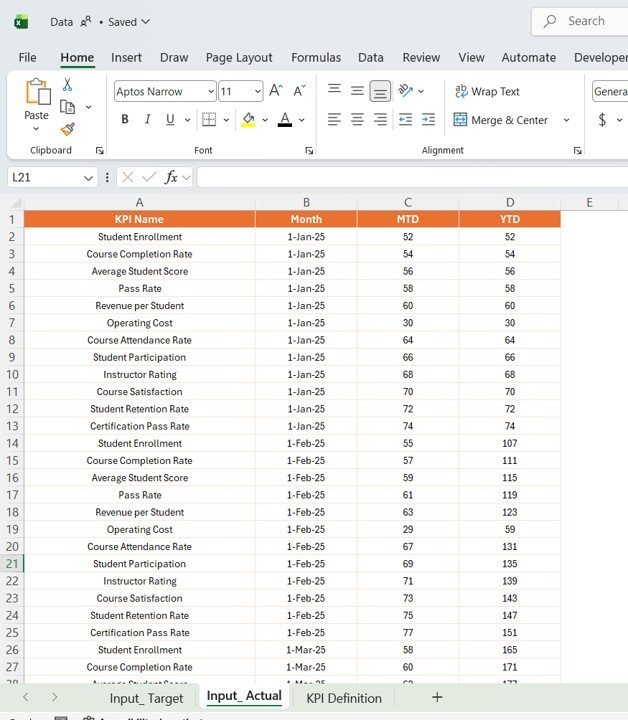
- 🗂 Input_Actual Sheet: Enter actual KPI values by KPI Name, Month (using the first date of the month), MTD and YTD numbers.
- 🗂 Input_Target Sheet: Fill in target KPI values aligned with the same format as the Actual sheet.
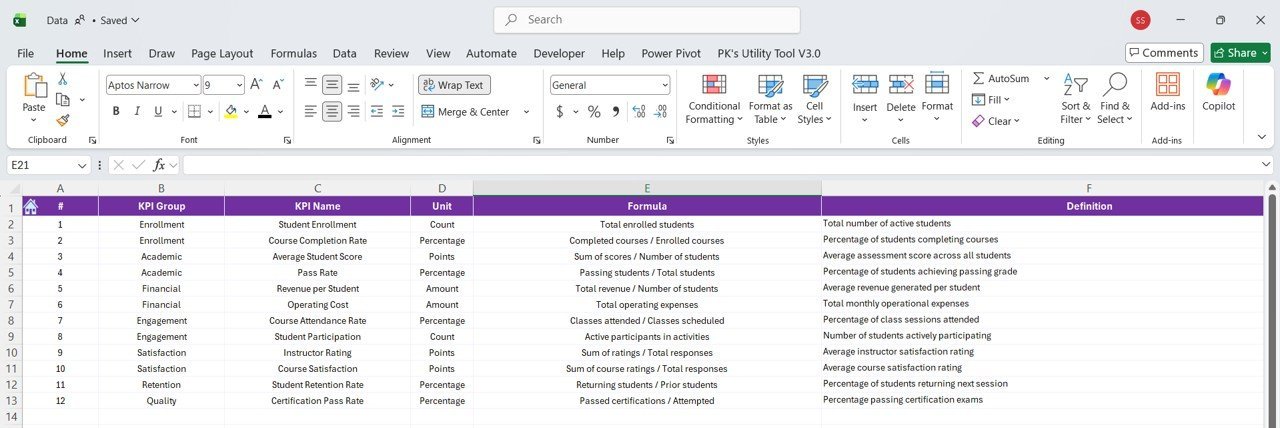
- 🗂 KPI Definition Sheet: Define each KPI’s number, group, unit, formula, detailed definition, and type (LTB or UTB).
The dashboard automatically syncs with these input files, ensuring your data insights are always up to date with a simple refresh in Power BI.
How to Use the STEM Education Centers KPI Dashboard in Power BI
Using this dashboard is straightforward and designed to save you time:
- 🔄 Step 1: Update your KPI data in the Excel file’s three sheets (Actual, Target, Definition).
- 🔗 Step 2: Open the Power BI dashboard and connect it to the updated Excel file.
- 🔄 Step 3: Click the Refresh button in Power BI’s Home tab to load the latest data.
- 📊 Step 4: Use slicers on the Summary and KPI Trend pages to filter by month, KPI group, or KPI name.
- 🔍 Step 5: Drill through to KPI Definition page for detailed insights on each KPI.
This easy-to-use process means managers, educators, and administrators can focus on decision-making rather than data wrangling.
Who Can Benefit from This STEM Education Centers KPI Dashboard in Power BI
This dashboard is tailor-made for a range of STEM education stakeholders looking to improve performance tracking and reporting:
- 🎓 School Administrators: Monitor KPIs to enhance STEM program effectiveness with real-time data visualization.
- 📈 Performance Analysts: Analyze trends in key metrics and identify areas needing improvement.
- 👩🏫 STEM Educators: Align teaching outcomes with organizational goals by tracking critical KPIs.
- 🏫 Education Centers: Easily present performance data during board meetings or funding proposals.
- 📊 Data Teams: Streamline KPI reporting with automated updates and clear visualizations.
Whether you manage a small STEM learning center or a large educational institution, this dashboard will provide actionable insights and simplify your KPI management.
Click here to read the Detailed blog post.
Visit our YouTube channel to learn step-by-step video tutorials


Reviews
There are no reviews yet.