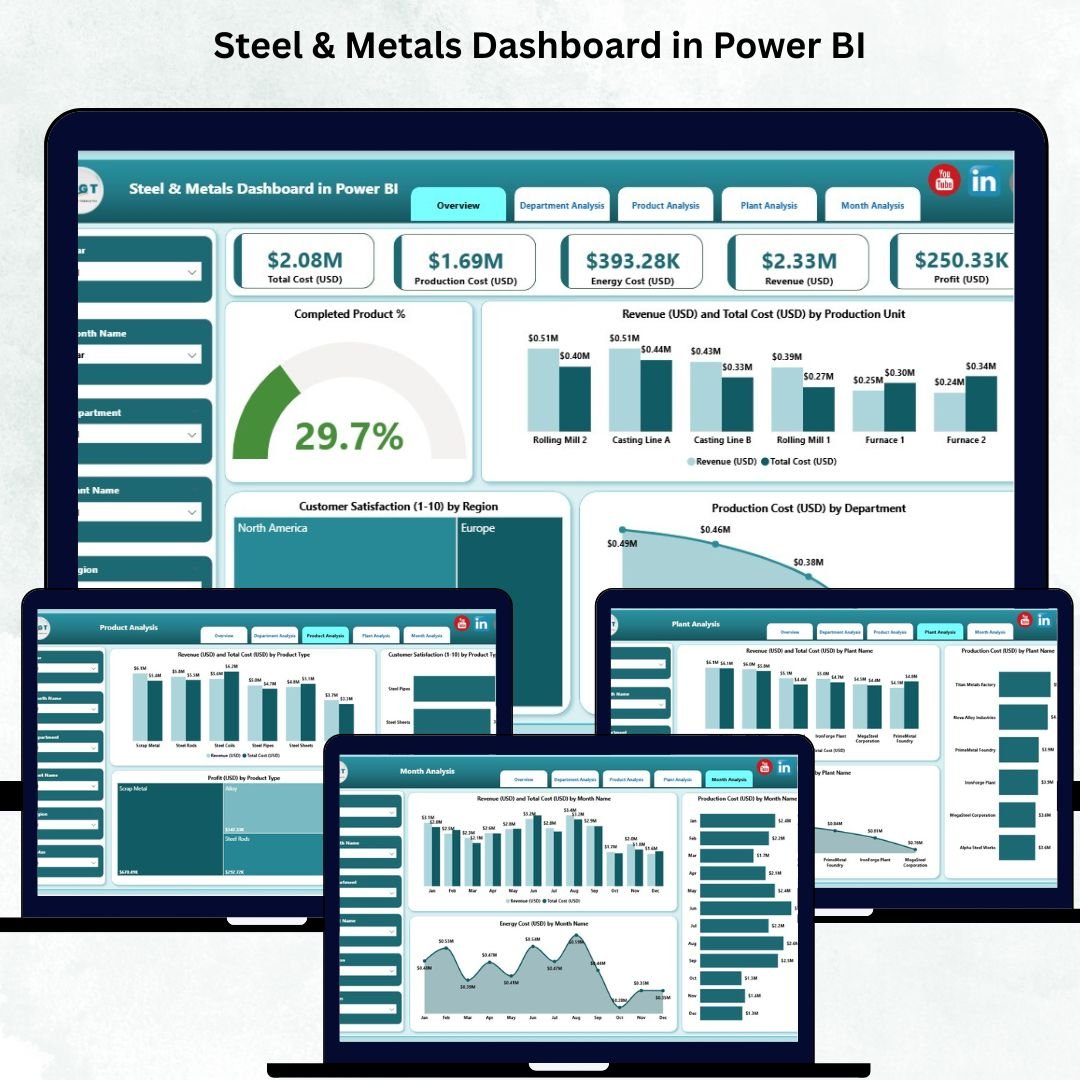
The steel and metals industry operates in one of the most complex and data-driven environments. Every fluctuation in production output, energy consumption, material cost, downtime, or customer demand impacts profitability. When this critical information stays scattered across spreadsheets and disconnected systems, leaders lose visibility. As a result, operational gaps grow, decisions get delayed, and efficiency declines. To solve this challenge, we created the Steel & Metals Dashboard in Power BI, a modern and interactive solution designed to give complete clarity across plants, products, departments, and months.
This dashboard brings all KPIs—production, financials, energy usage, customer satisfaction, and plant performance—into one visual Power BI file. Whether you manage a steel mill, rolling mill, casting unit, melting unit, metals manufacturing plant, or fabrication business, this dashboard helps you track everything instantly. With automated visuals, dynamic slicers, and real-time reporting, you spend less time collecting data and more time improving operations.
⚙️ Key Features of the Steel & Metals Dashboard in Power BI
📌 1. Five Dedicated Analytical Pages
You get five complete analytical pages—Overview, Department Analysis, Product Analysis, Plant Analysis, and Monthly Trends. Each page helps you evaluate KPIs from a different angle, ensuring you never miss an important insight.
📌 2. Interactive KPI Cards
The dashboard includes five KPI cards showing:
✔ Completed Product %
✔ Total Revenue (USD)
✔ Total Cost (USD)
✔ Customer Satisfaction
✔ Production Efficiency
These cards give a quick health summary of the business.
📌 3. Dynamic Filters
Filter by Month, Production Unit, Department, Plant Type, or Product Type. With one click, the entire dashboard updates instantly.
📌 4. Detailed Visual Charts
From revenue vs. cost to customer satisfaction and energy usage, you see deep insights visually—making analysis faster, easier, and more accurate.
📦 What’s Inside the Steel & Metals Dashboard
🏠 1. Overview Page – The Complete Business Snapshot
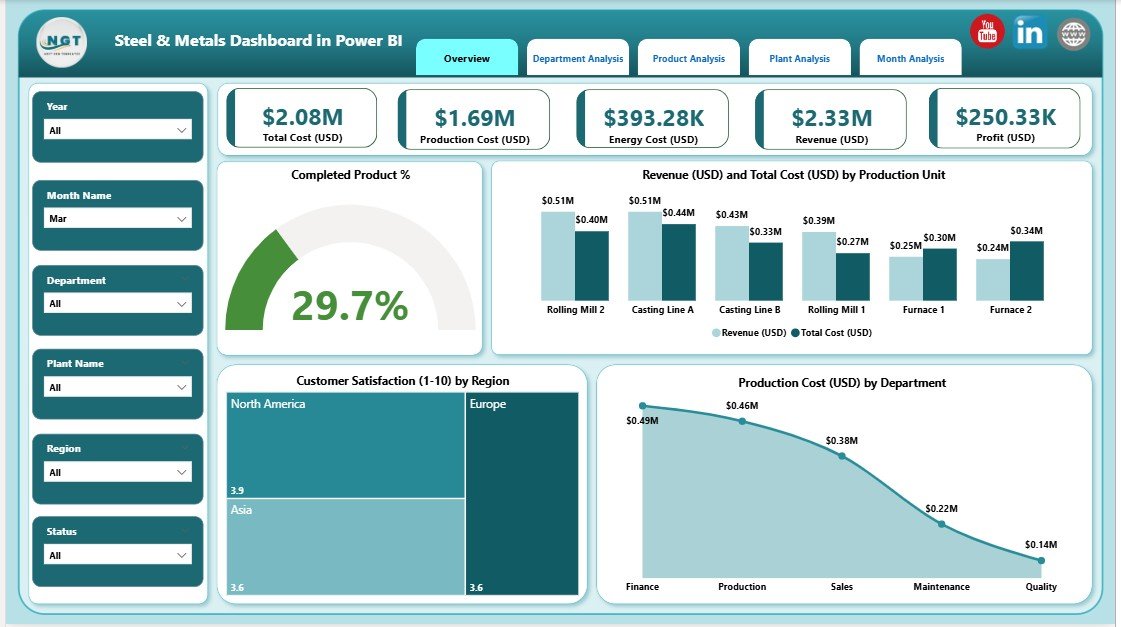
The Overview Page is where leaders start their analysis. It shows:
-
Completed Product % by Production Unit
-
Revenue & Total Cost by Production Unit
-
Customer Satisfaction by Region
-
Production Cost by Department
This page answers critical questions like:
➡ Which unit performs best?
➡ Where is cost increasing?
➡ Which region has low satisfaction?
➡ Which department needs improvement?
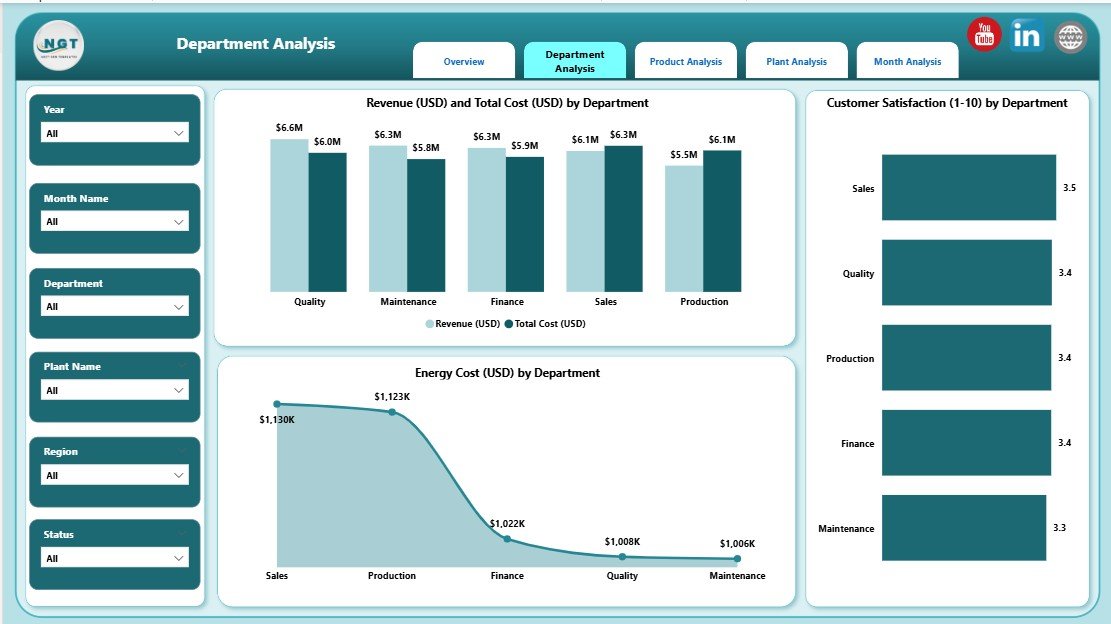
🏢 2. Department Analysis Page – Compare Departments with Ease
This page reveals performance at the department level with visuals such as:
-
Revenue & Total Cost by Department
-
Customer Satisfaction by Department
-
Energy Cost (USD) by Department
You instantly identify:
✔ High-cost departments
✔ Low-performing teams
✔ Energy-inefficient areas
✔ Improvement opportunities
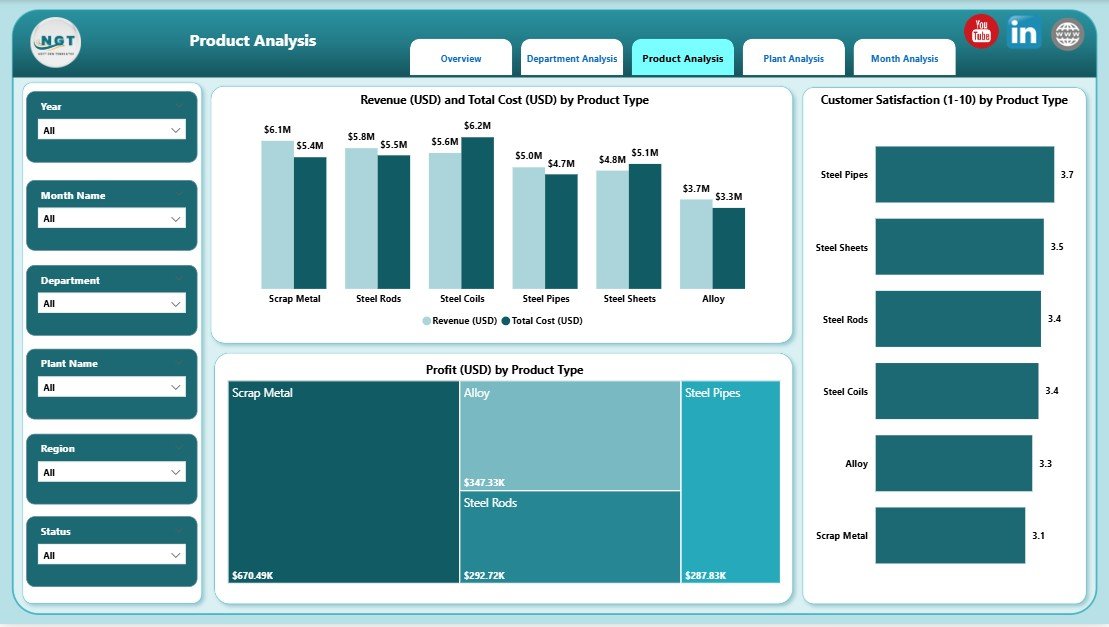
📦 3. Product Analysis Page – Track Product-Level Profitability
This page focuses on product-wise insights:
-
Revenue & Cost by Product Type
-
Customer Satisfaction by Product
-
Production Cost by Product
These visuals help you understand:
➡ Top-performing products
➡ Loss-making product categories
➡ Quality issues affecting satisfaction
➡ Production cost variations
Perfect for pricing, forecasting, and production planning.
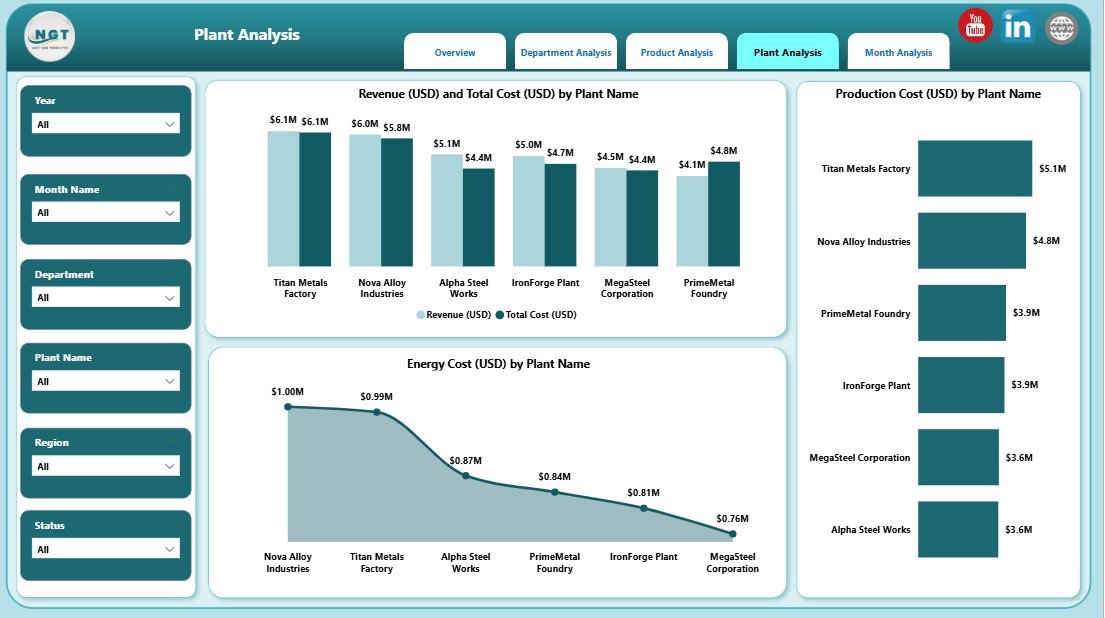
🏭 4. Plant Analysis Page – Evaluate Plant Performance Clearly
Steel companies often run multiple plants. This page shows:
-
Revenue & Total Cost by Plant
-
Production Cost by Plant Type
-
Energy Cost by Plant Type
Leaders compare plants based on cost, energy efficiency, and overall output. Weak plants receive corrective action; strong plants receive support for scaling.
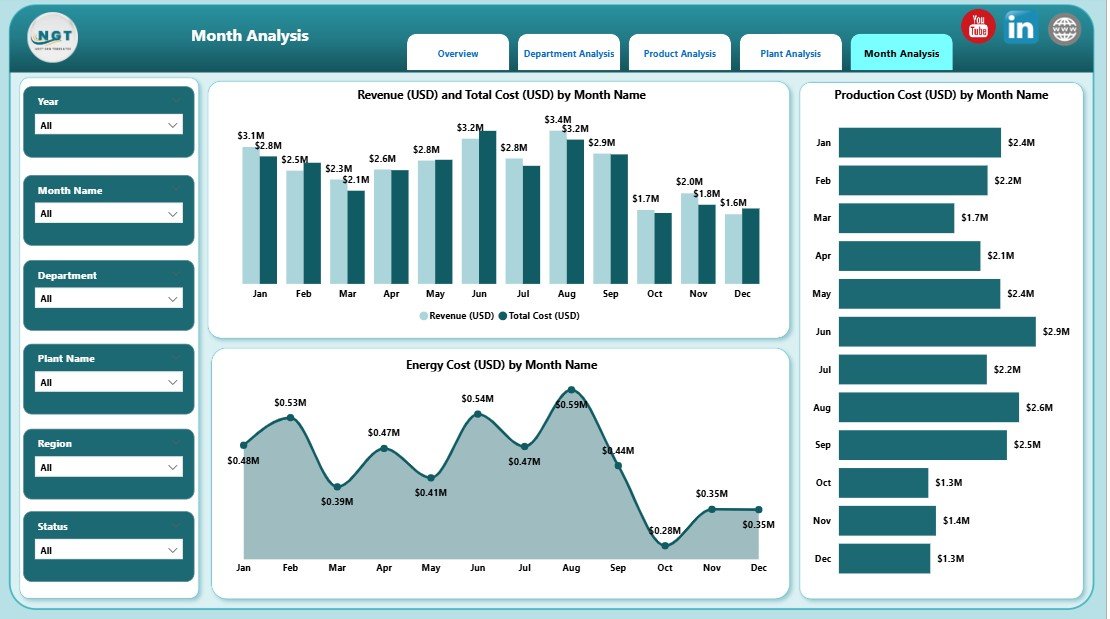
📅 5. Monthly Trends Page – Track Seasonal & Monthly Behavior
This page helps you understand month-to-month performance through:
-
Revenue & Cost by Month
-
Production Cost by Month
-
Energy Cost by Month
You clearly see:
✔ Seasonal demand variations
✔ Months with cost spikes
✔ Energy consumption patterns
✔ Long-term operational trends
🚀 How to Use the Steel & Metals Dashboard in Power BI
1️⃣ Update the Data Source
Add monthly numbers for production, cost, revenue, and satisfaction.
2️⃣ Refresh Power BI
With a single click, all visuals update automatically.
3️⃣ Apply Slicers
Analyze by product, month, plant, or department.
4️⃣ Compare Revenue vs Cost
Control cost-heavy areas early.
5️⃣ Monitor Monthly & Energy Trends
Plan production and budgeting smarter.
👥 Who Can Benefit from This Dashboard
-
Production Managers
-
Plant Heads
-
Steel Mills & Fabrication Units
-
Finance Teams
-
Quality Control Teams
-
Supply Chain Managers
-
Senior Leadership
Every role gains powerful insights for better decisions.
### Click hare to read the Detailed blog post
Visit our YouTube channel to learn step-by-step video tutorials
👉 Youtube.com/@PKAnExcelExpert


Reviews
There are no reviews yet.