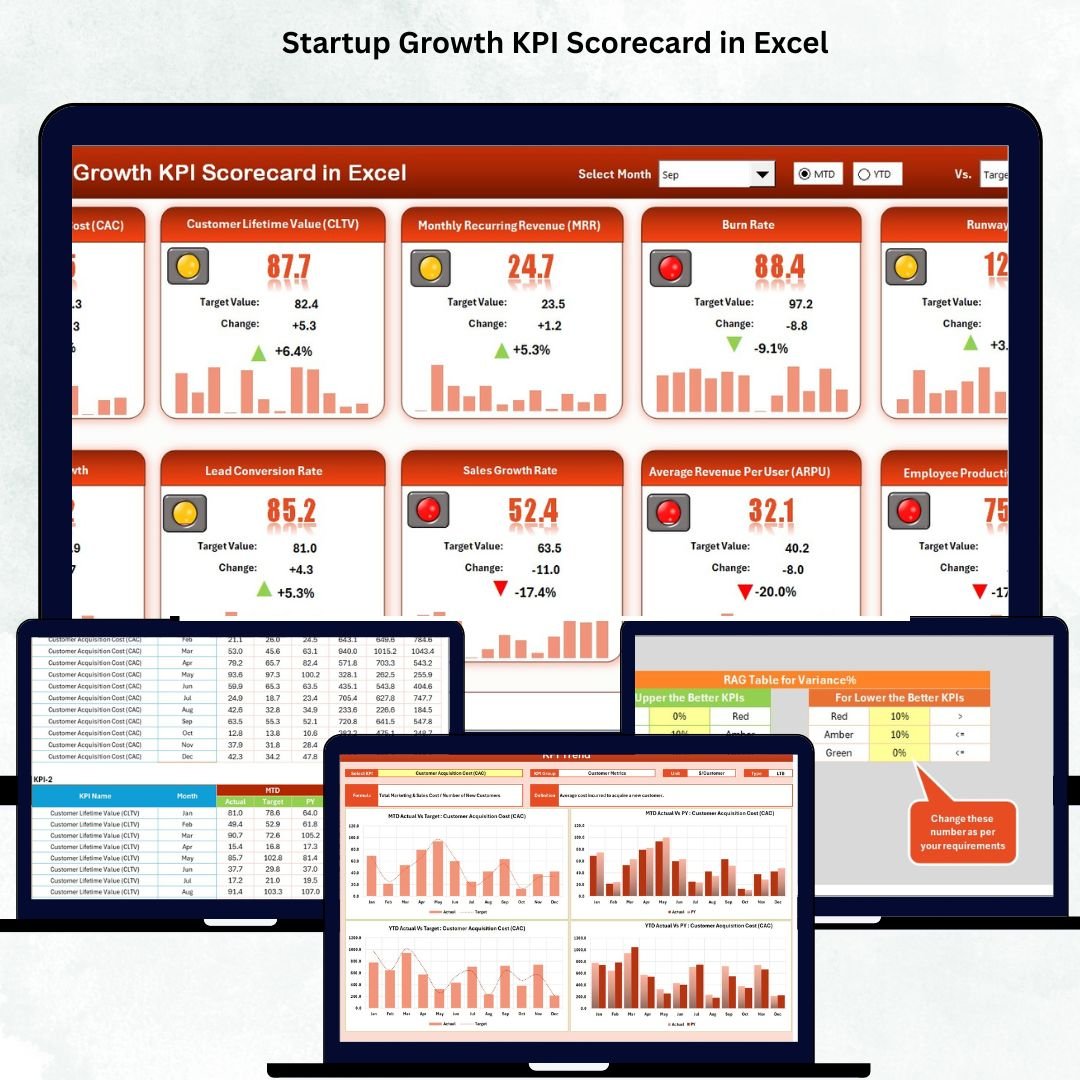

Every successful startup runs on data — and this Startup Growth KPI Scorecard in Excel is your all-in-one command center to track, measure, and grow your business faster! Designed exclusively for founders, managers, and investors, this interactive Excel template transforms raw data into visual insights — helping you make smarter, faster, and more confident decisions. 📈
⚙️ Key Features of Startup Growth KPI Scorecard in Excel
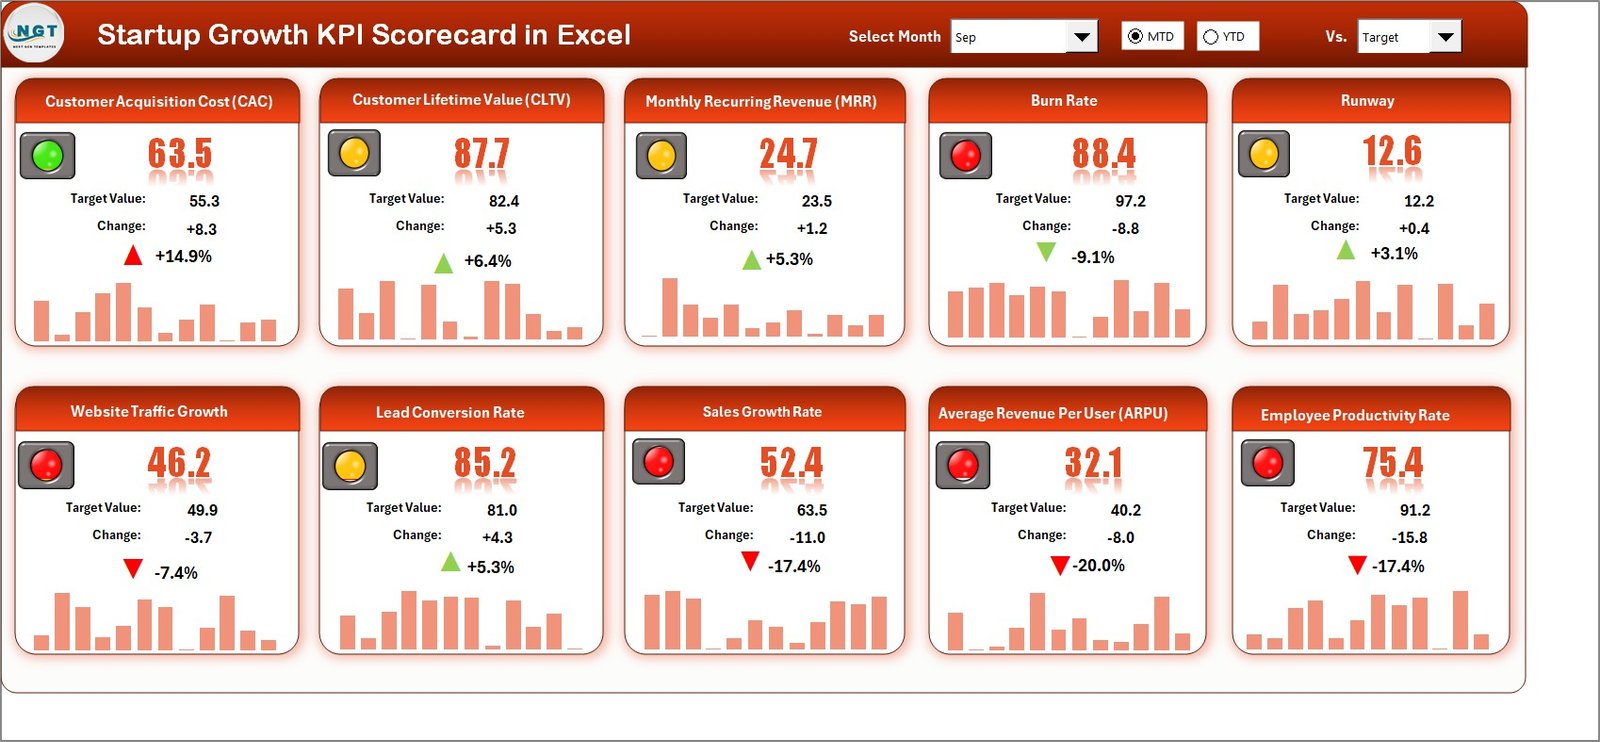
✨ Interactive Dashboard: Instantly analyze performance using dropdowns for Month, MTD, or YTD.
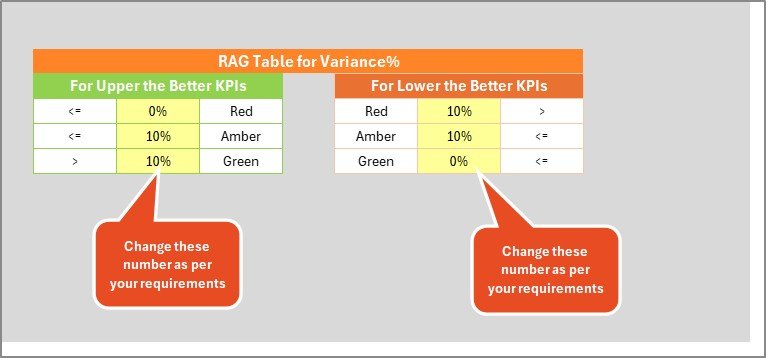
📊 Actual vs Target Comparison: Quickly spot performance gaps with color-coded visuals and conditional formatting.
💡 Dynamic KPI Overview: Monitor up to 10 KPIs in a single view with real-time insights.
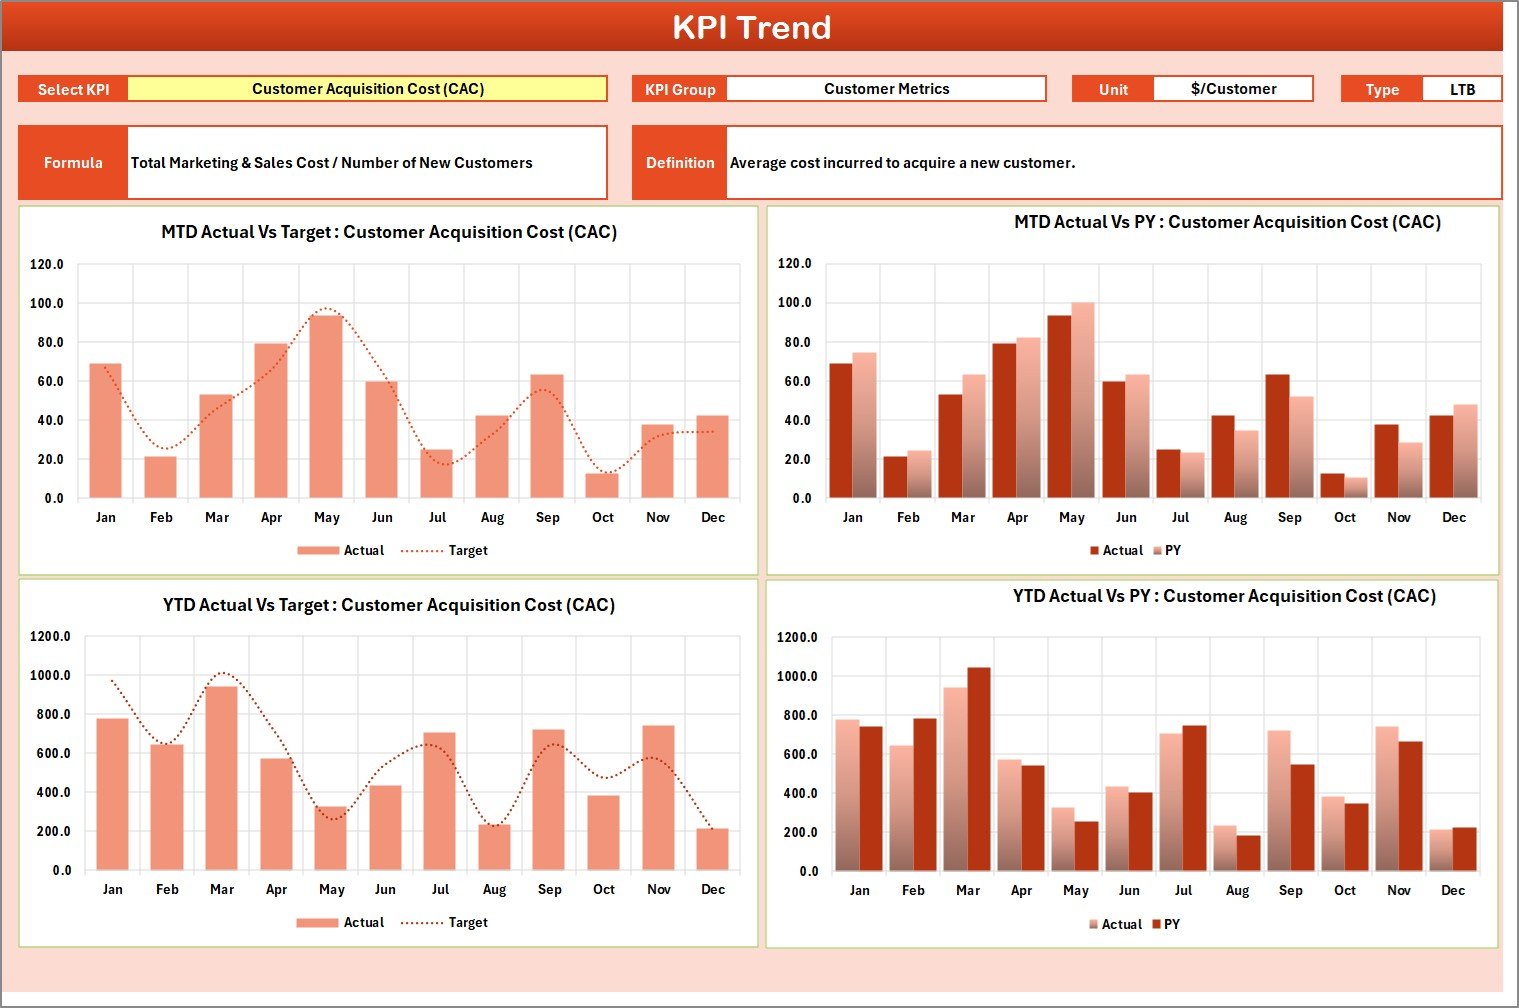
📈 Visual Trend Analysis: Dive into monthly trends to understand growth patterns and consistency.
🧩 Fully Editable & Customizable: Modify KPI names, formulas, and thresholds to match your business goals.
🔒 No Coding Required: Simply enter your data — Excel handles the rest automatically.
🌐 Integrates with Power BI & Google Sheets: Expand your analytics easily for deeper visualization.
This dashboard ensures that every KPI tells a story — your story of progress, performance, and profitability.
📂 What’s Inside the Startup Growth KPI Scorecard
The template includes four structured worksheets for complete control and clarity:
1️⃣ Scorecard Sheet: The heart of your performance tracker! Compare actual vs. target metrics with instant visual cues and monthly analysis.
2️⃣ KPI Trend Sheet: Select any KPI from the dropdown to view detailed MTD, YTD, and PY (Previous Year) comparisons — complete with line charts and trend indicators.
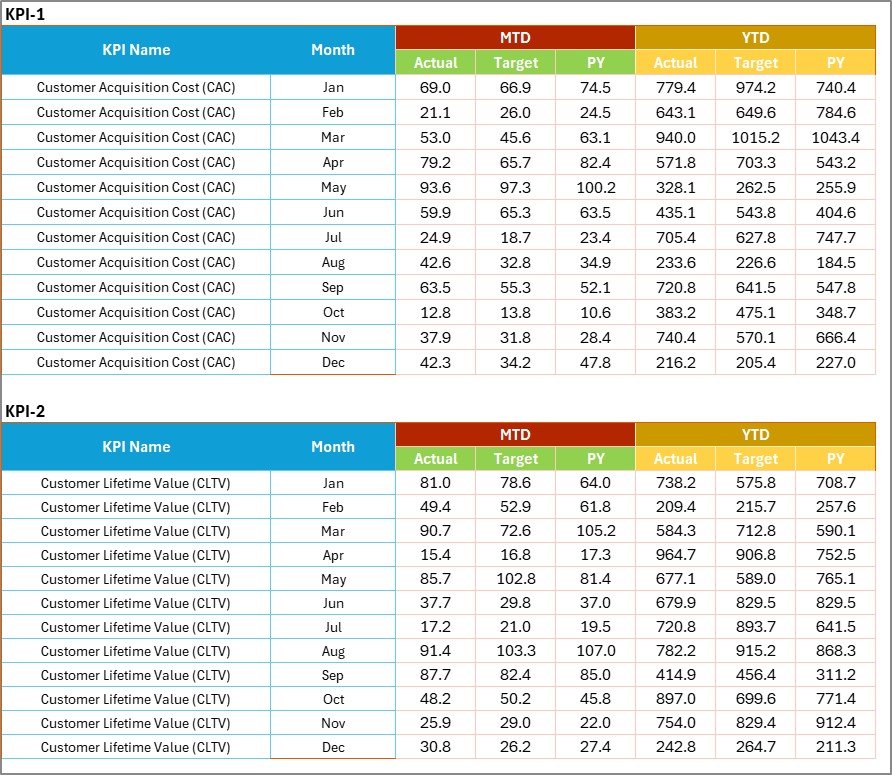
3️⃣ Input Data Sheet: Log your actual, target, and prior-year numbers. Every update auto-reflects across the dashboard and charts.
4️⃣ KPI Definition Sheet: Define KPI names, groups, formulas, and units so every team member speaks the same language.
With these structured sheets, your startup can easily organize, visualize, and interpret performance data in one place.
🧭 How to Use the Startup Growth KPI Scorecard
🪄 Step 1: Identify and define your KPIs in the KPI Definition Sheet (Sales, Marketing, Operations, HR, etc.).
📆 Step 2: Enter your monthly Actual, Target, and Previous Year numbers in the Input Data Sheet.
📊 Step 3: Switch to the Scorecard Sheet to view MTD, YTD, and overall performance with instant visuals.
📉 Step 4: Use the KPI Trend Sheet to track performance progress and take timely action.
🔁 Step 5: Update regularly to keep data fresh — ensuring your startup’s pulse stays accurate and relevant.
In just a few clicks, you’ll go from manual tracking chaos to automated insights that drive strategy.
🎯 Who Can Benefit from This KPI Scorecard
👨💼 Startup Founders & CEOs: Get real-time visibility of growth and profitability.
👩💻 Operations Managers: Track team performance and identify efficiency gaps.
💰 Investors & Financial Analysts: Evaluate growth, burn rate, and ROI trends effortlessly.
📣 Marketing & Sales Teams: Monitor conversion rates, lead generation, and campaign results.
🧑🤝🧑 HR & People Managers: Measure employee productivity, satisfaction, and retention.
Whether you run a SaaS platform, E-commerce store, FinTech startup, or Manufacturing unit — this Excel-based scorecard adapts perfectly to your business model.
🌟 Why Choose This Scorecard
✅ Clarity: Visualize complex data instantly through charts and color-coded indicators.
✅ Efficiency: Focus on KPIs that truly impact business growth.
✅ Scalability: Add or modify KPIs as your startup evolves.
✅ Professionalism: Impress investors with clear, data-driven dashboards.
Start using the Startup Growth KPI Scorecard in Excel today — and turn your startup’s data into a roadmap for success!


Reviews
There are no reviews yet.