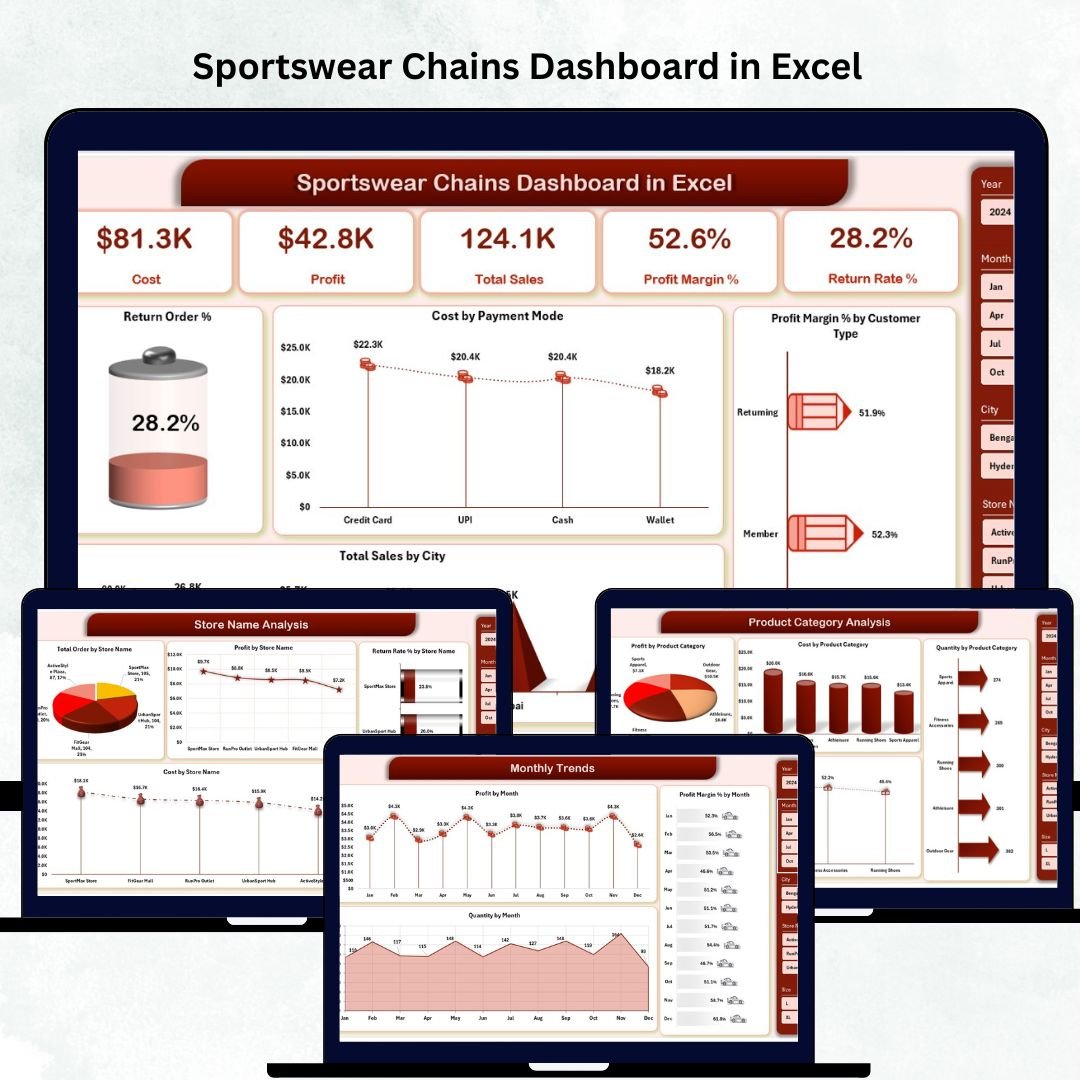
Sportswear retail chains operate in a highly competitive environment where customer tastes change fast, product trends shift quickly, and margins stay tight. Sportswear Chains Dashboard in Excel To stay ahead, retail managers must track sales, monitor store performance, analyze product categories, understand brand contribution, and manage returns—all from one place. But when this data stays scattered across multiple spreadsheets, reports, or POS systems, decision-making slows down and growth opportunities get missed.
The Sportswear Chains Dashboard in Excel solves this problem instantly. It gives retail teams a clear, structured, and interactive view of all their KPIs. Whether you manage multiple stores, multiple brands, or multiple product categories, this dashboard helps you analyze everything with speed and confidence. Designed for quick insights and easy updates, this dashboard is perfect for CEOs, retail managers, planners, merchandisers, and analysts who need fast, reliable, and actionable insights.
✨ Key Features of the Sportswear Chains Dashboard in Excel
This dashboard comes with five powerful analytical pages and a clean Page Navigator for easy switching between views.
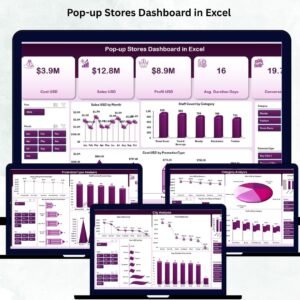
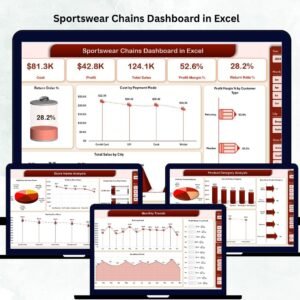
📌 Overview Page – Your Complete Business Snapshot
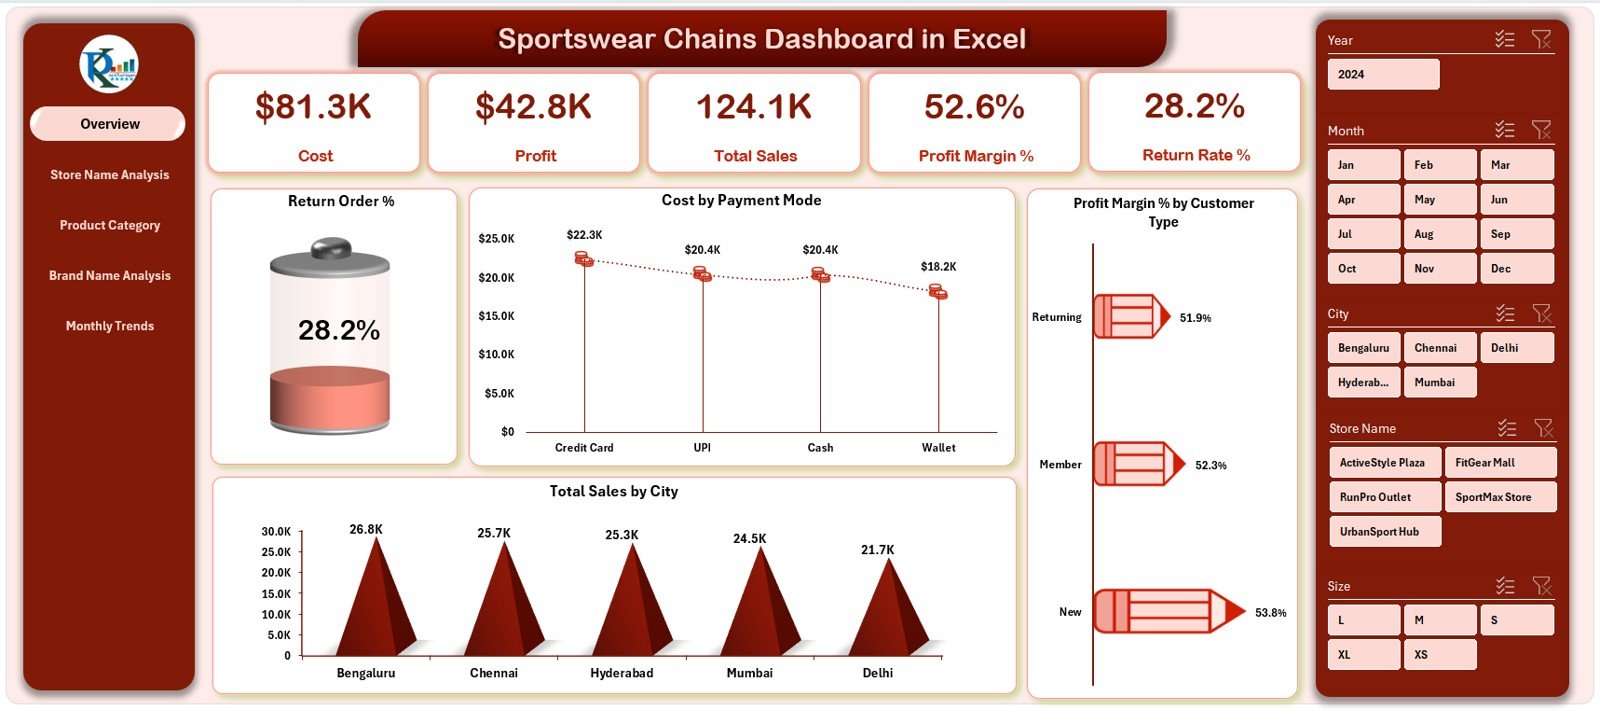
This page highlights the most important KPIs of your sportswear retail chain:
• Total Sales – Understand your total revenue at a glance
• Total Profit – See your bottom-line performance
• Profit Margin % – Monitor your profitability with ease
• Total Quantity Sold – Track overall customer demand
• Return Order % – Identify product quality or customer service issues
4 Interactive Charts Include:
📊 Return Order %
📊 Cost by Payment Mode
📊 Total Sales by City
📊 Profit Margin % by Customer Type
This page is ideal for leadership teams needing quick insights.
📦 What’s Inside the Sportswear Chains Dashboard in Excel
When you download this template, you get a professionally designed dashboard packed with retail intelligence:
✔ Dashboard (.XLSX file) with 5 Fully Designed Pages
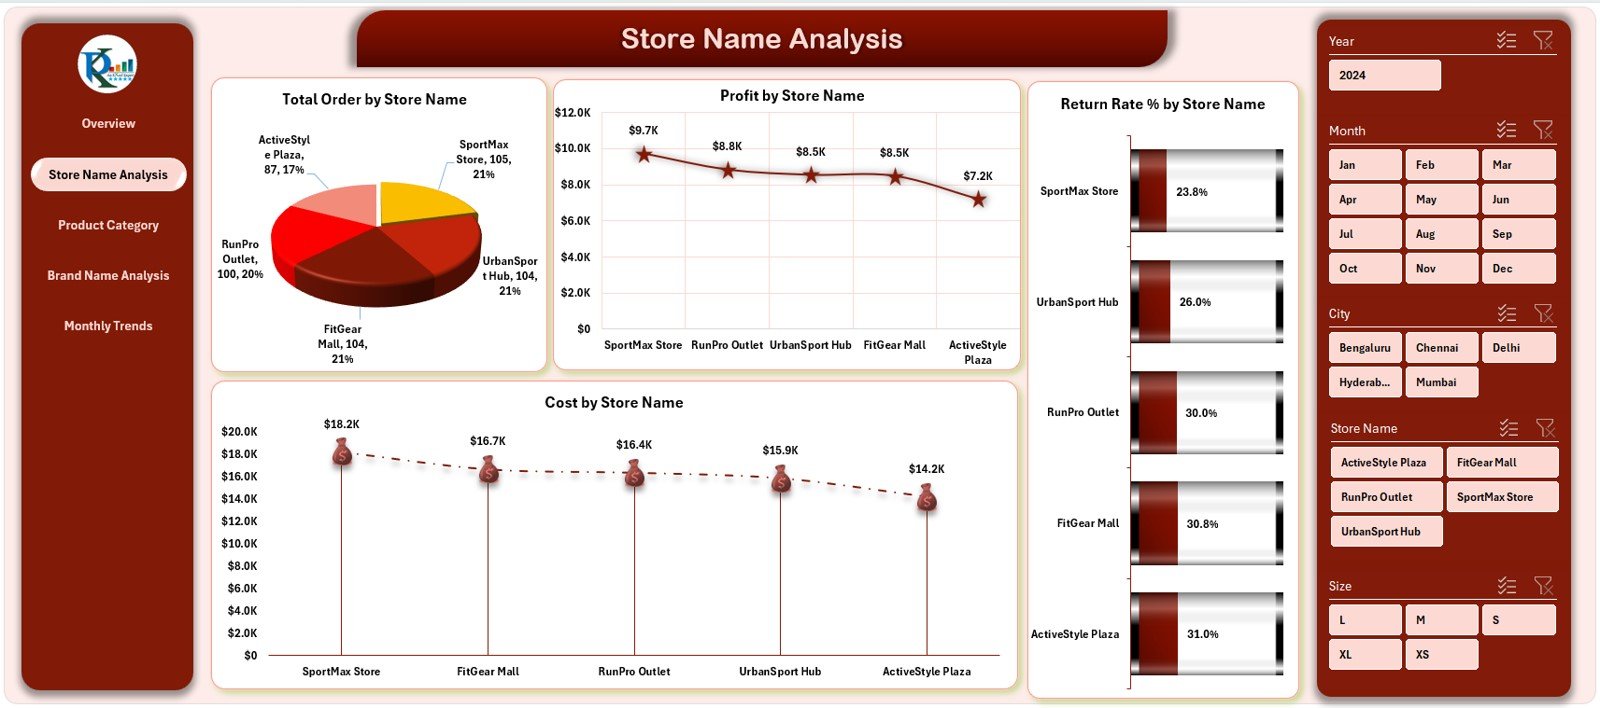
Each page contains store-wise, category-wise, brand-wise, and monthly analytics.
✔ Structured Data Sheet
Enter your raw data (sales, cost, quantity, store, brand, category, etc.) in a simple, clean format.
✔ Support Sheet
Contains dropdown lists, references, category mapping, and validation fields.
✔ Pre-Built Charts & KPI Cards
All formulas, calculations, and visual elements are ready to use.
✔ Fully Editable & Customizable Template
Modify charts, add categories, expand store lists, or change visuals anytime.
🛠️ How to Use the Sportswear Chains Dashboard in Excel
Using the dashboard is effortless—even for beginners.
🔹 Step 1: Enter Your Raw Data
Update the Data Sheet with sales, cost, return %, payment mode, customer type, store, and category details.
🔹 Step 2: Refresh Or Recalculate
Your dashboard updates instantly across all pages.
🔹 Step 3: Use Filters for Deep Insights
Slice by store, brand, category, month, or city to explore hidden patterns.
🔹 Step 4: Present Results with Confidence
The visual charts and KPIs are perfect for meetings, performance reviews, and planning sessions.
🔹 Step 5: Customize as Needed
Add new stores, brands, or product types without breaking the dashboard.
🎯 Who Can Benefit from This Sportswear Chains Dashboard in Excel
This dashboard is ideal for all levels of retail teams who need accurate, real-time insights:
👑 Retail Directors & CEOs
Track enterprise-wide performance and strategic trends.
📈 Category & Merchandise Planners
Understand category profitability and demand patterns.
🏬 Store Managers & Supervisors
Compare store performance and identify improvement areas.
📦 Inventory & Supply Chain Teams
Optimize stock based on category & monthly trends.
💹 Finance & Profitability Analysts
Monitor cost, margin %, and return rate impact.


Reviews
There are no reviews yet.