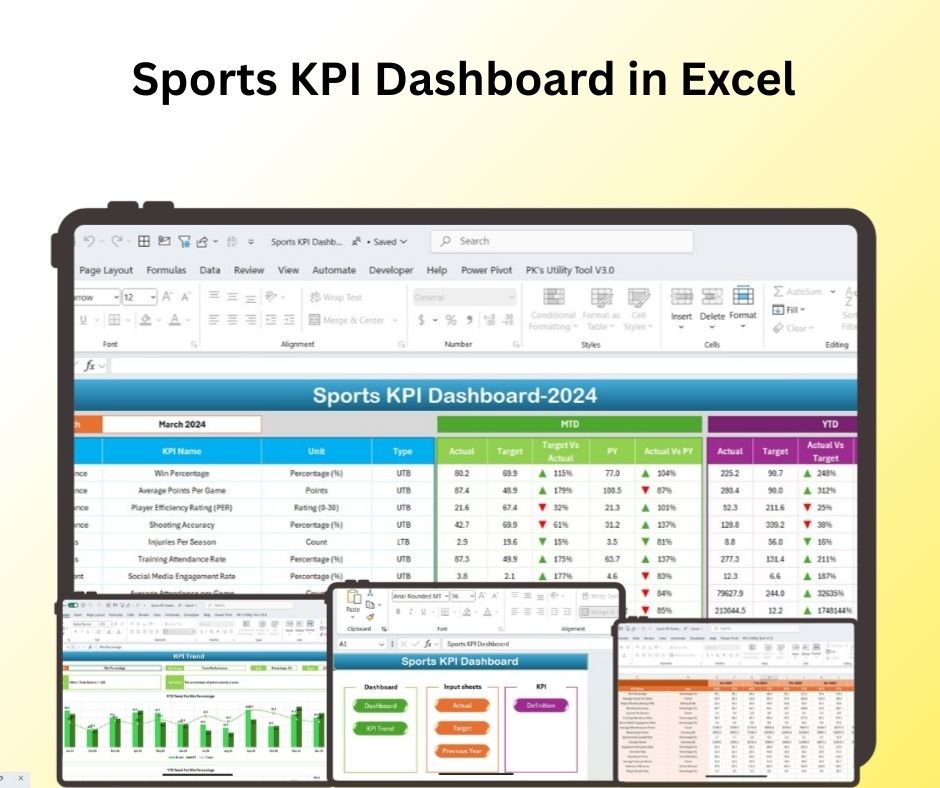
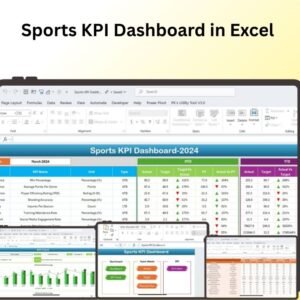
The Sports KPI Dashboard in Excel is a dynamic tool designed to help sports teams, coaches, managers, and sports analysts track, analyze, and optimize performance across multiple sports disciplines. Whether you are managing a team, analyzing player statistics, or evaluating match performance, this customizable dashboard provides a comprehensive overview of key performance indicators (KPIs) that impact athletic success.
With the ability to monitor player stats, team performance, and match outcomes, this dashboard offers real-time insights into metrics like player efficiency, scoring, assists, win rates, and much more. It’s perfect for coaches, team managers, sports analysts, and anyone involved in performance optimization in the sports industry.

Key Features of the Sports KPI Dashboard in Excel:
📊 Comprehensive KPI Tracking
Track various KPIs such as player performance, team performance, scoring stats, assists, and win/loss ratios—all in one dashboard.
📈 Real-Time Performance Monitoring
Monitor the performance of your team and players in real time with up-to-date stats for each match or game.
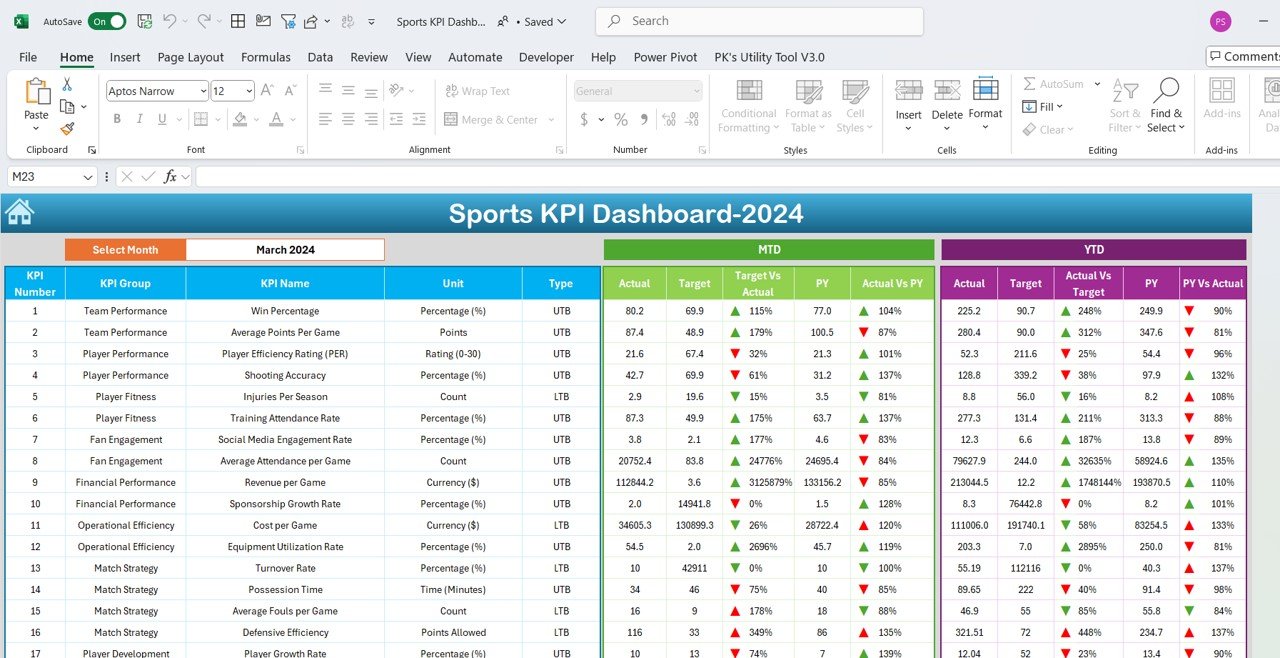
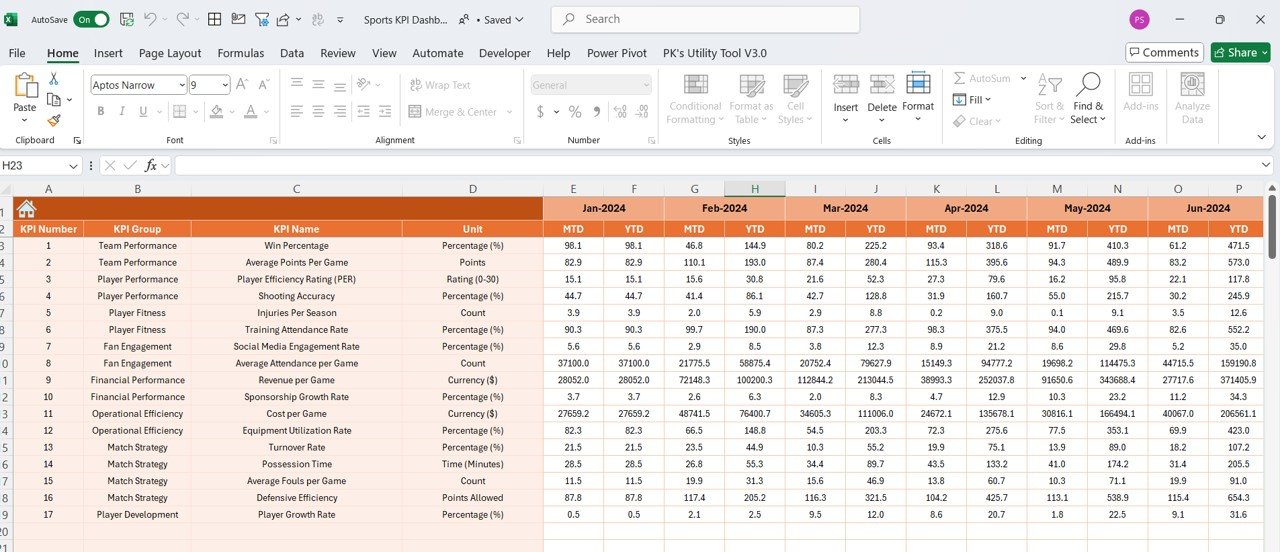
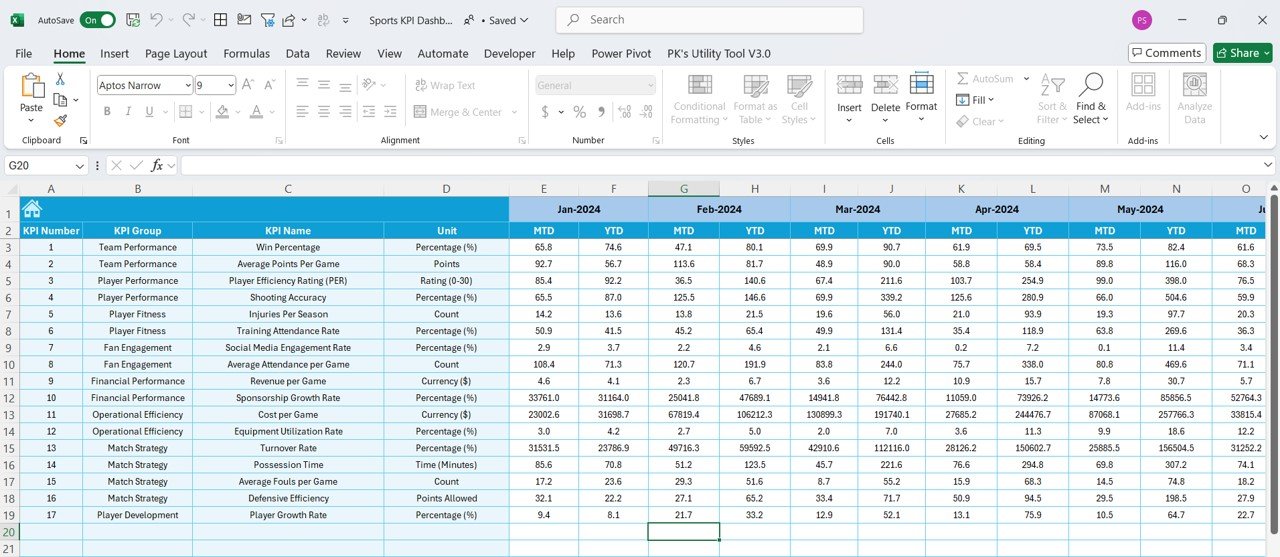
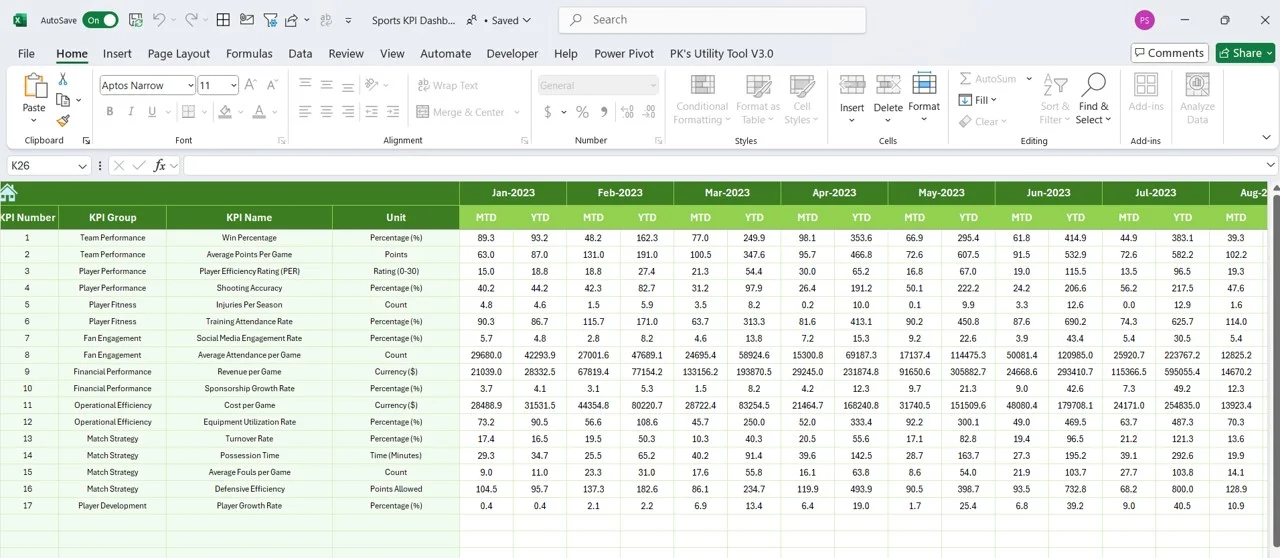
📅 Month-to-Date (MTD) and Year-to-Date (YTD) Performance
Track performance trends over time with MTD and YTD views, helping you identify patterns and adjust strategies.
🎯 Goal Setting and Target Comparison
Set specific performance targets for your players and teams and compare actual results with these targets, ensuring alignment with long-term goals.
🛠 Customizable Inputs
Easily input your own player and team data and adjust KPIs to track metrics that matter most to your sport, whether it’s football, basketball, or any other athletic discipline.
🔔 Conditional Formatting Alerts
Use color-coded indicators to highlight key metrics such as high performance (green), needs improvement (yellow), and underperformance (red), making it easier to identify critical areas.
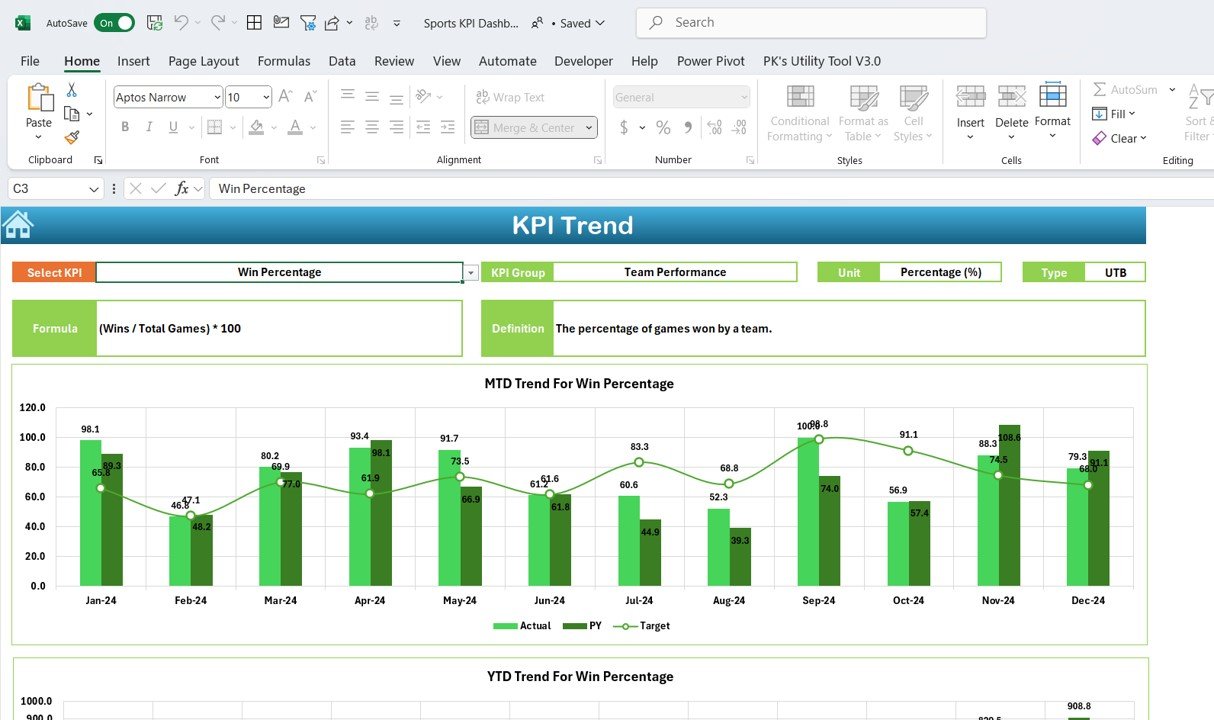
💡 Player and Team Performance Insights
Gain deeper insights into individual player efficiency, team dynamics, scoring opportunities, and match performance with dynamic graphs and charts.
🚀 Why You’ll Love the Sports KPI Dashboard in Excel:
✅ Track Team and Player Performance – Consolidate all performance data in one place to track both individual player stats and team performance.
✅ Make Data-Driven Decisions – Use real-time insights to make informed decisions and adjust strategies to improve overall performance.
✅ Boost Team Efficiency – Identify key performance areas, including scoring efficiency, assist ratios, and win rates, and optimize performance based on insights.
✅ Easy-to-Use Interface – With an intuitive design, the dashboard makes it easy for non-technical users to input data and understand performance metrics.
✅ Fully Customizable – Adjust the dashboard to fit any sport, allowing you to track the most relevant KPIs for your team or sport.
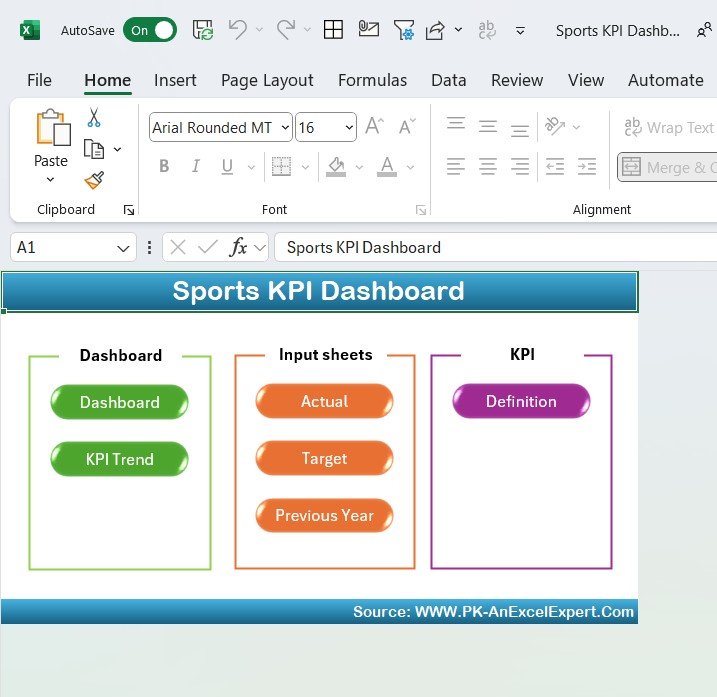
What’s Inside the Sports KPI Dashboard in Excel:
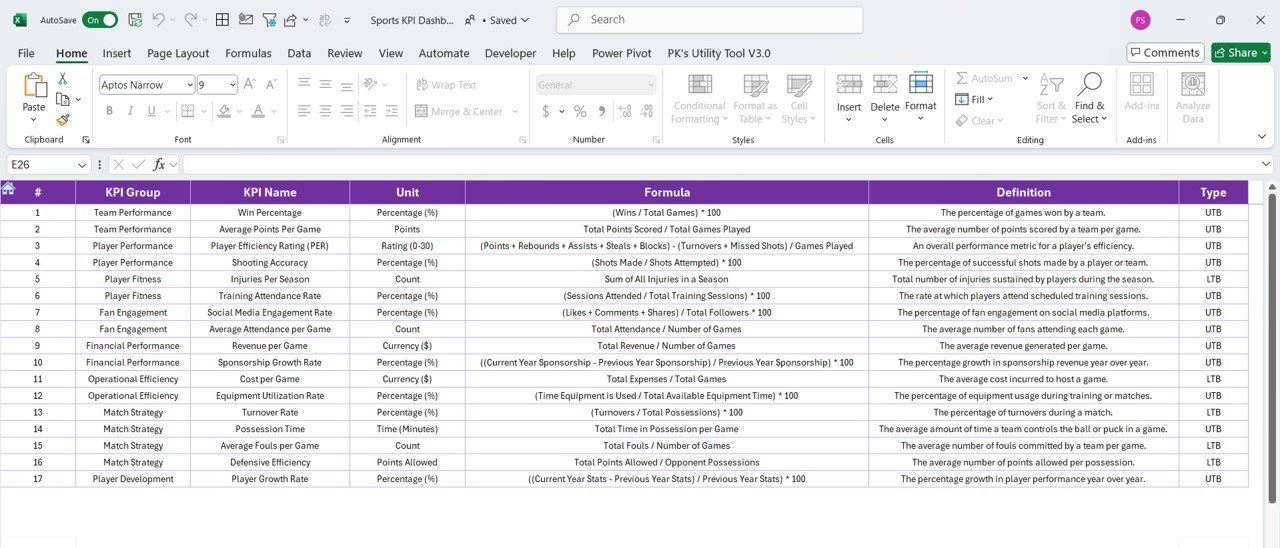
- Player Efficiency KPI: Track player performance based on key metrics like points scored, assists, rebounds, or tackles, depending on the sport.
- Team Performance KPI: Monitor team stats such as total points, team assists, possession percentage, and defensive efficiency.
- Match Win/Loss Ratio KPI: Evaluate your team’s success rate in various matches or tournaments.
- Scoring Opportunities KPI: Measure scoring chances and overall offensive efficiency for your team and individual players.
- Assist and Contribution KPI: Track the number of assists and other player contributions to overall team performance.
- Player Comparison KPI: Compare multiple players based on various performance metrics to identify top performers or areas for improvement.
How to Use the Sports KPI Dashboard in Excel:
1️⃣ Download the Template – Gain instant access to the Excel file upon purchase.
2️⃣ Input Your Data – Enter your player and team data into the pre-designed fields.
3️⃣ Set Targets – Define performance targets for key metrics such as scoring, assists, and overall team performance.
4️⃣ Track Your Progress – Monitor performance trends in real time and identify opportunities for improvement.
5️⃣ Generate Reports – Use the dashboard to generate performance reports for team meetings or analysis sessions.
Who Can Benefit from the Sports KPI Dashboard in Excel:
- Sports Coaches
- Team Managers
- Sports Analysts
- Athletic Directors
- Performance Analysts
- Sports Teams (All Disciplines)
- Fitness and Health Experts
The Sports KPI Dashboard in Excel is an invaluable tool for anyone in the sports industry looking to track performance, optimize team efficiency, and improve overall athletic success.
Click here to read the Detailed blog post
https://www.pk-anexcelexpert.com/sports-kpi-dashboard-in-excel/
Visit our YouTube channel to learn step-by-step video tutorials
Youtube.com/@PKAnExcelExpert


Reviews
There are no reviews yet.