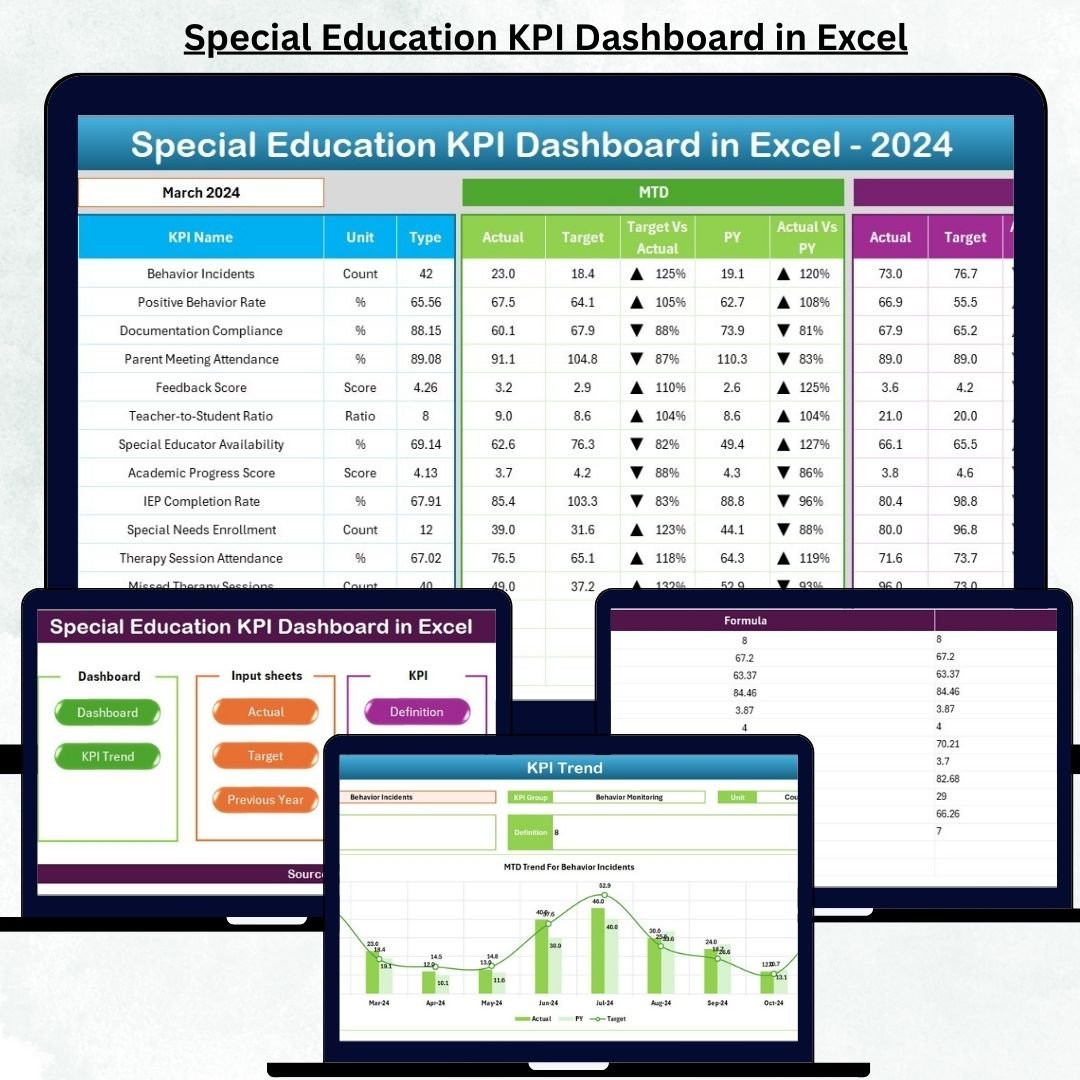
Managing a special education program is not simple. With growing student needs, individualized plans, compliance requirements, teacher coordination, and parent communication, schools often struggle to monitor performance effectively. The Special Education KPI Dashboard in Excel solves this challenge by transforming scattered data into a smart, visual, and fully automated performance-tracking system.
This ready-to-use tool helps special educators, administrators, and school leaders evaluate monthly and yearly performance through powerful KPI insights, interactive dashboards, and trend analysis — all inside Microsoft Excel.
Whether you want to improve academic results, track support services, measure student progress, or monitor resource utilization, this dashboard gives you the clarity and control you need to make informed decisions.
🌟 Key Features of the Special Education KPI Dashboard in Excel
1. Smart Navigation Panel
Navigate between sheets instantly using dedicated buttons—no more scrolling through large Excel files.
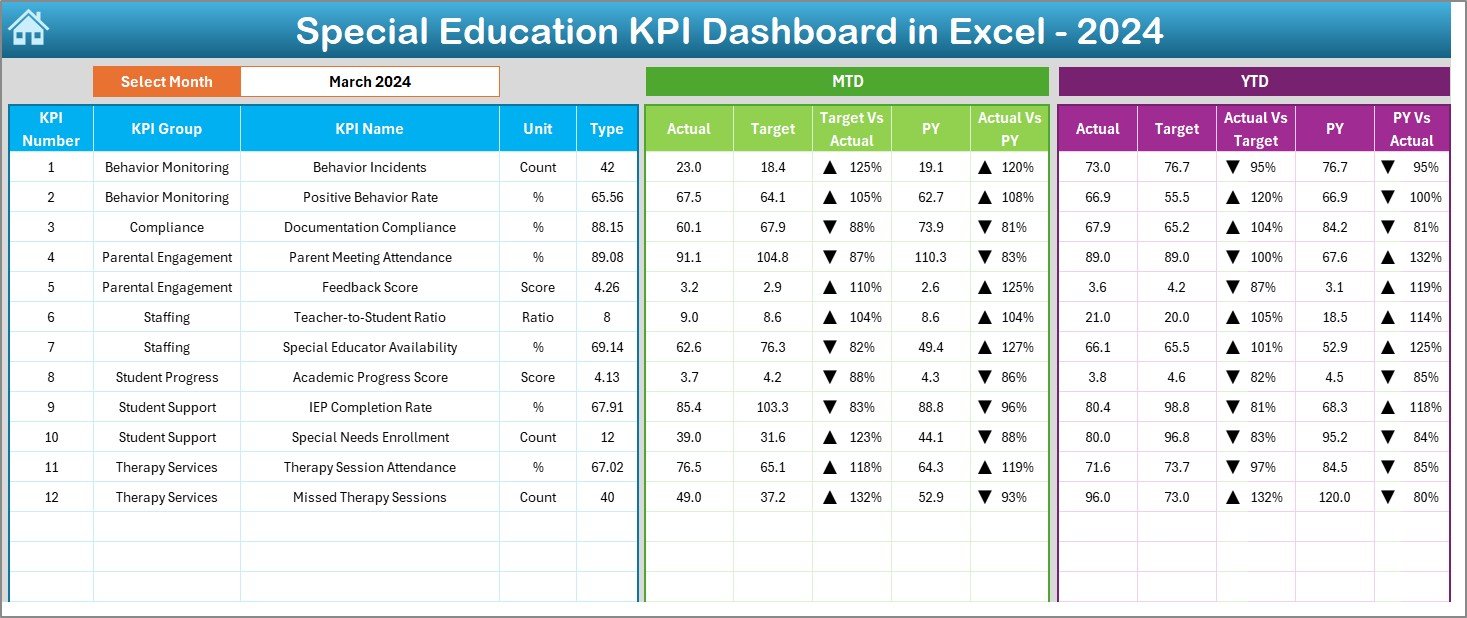
2. Interactive KPI Dashboard
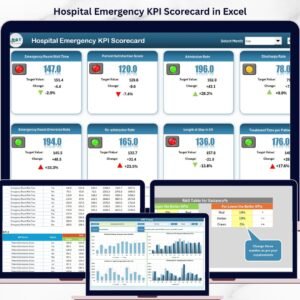
The main dashboard updates automatically when you select a month. View MTD (Month-to-Date) and YTD (Year-to-Date) performance, compare with targets, and analyze Previous Year numbers.
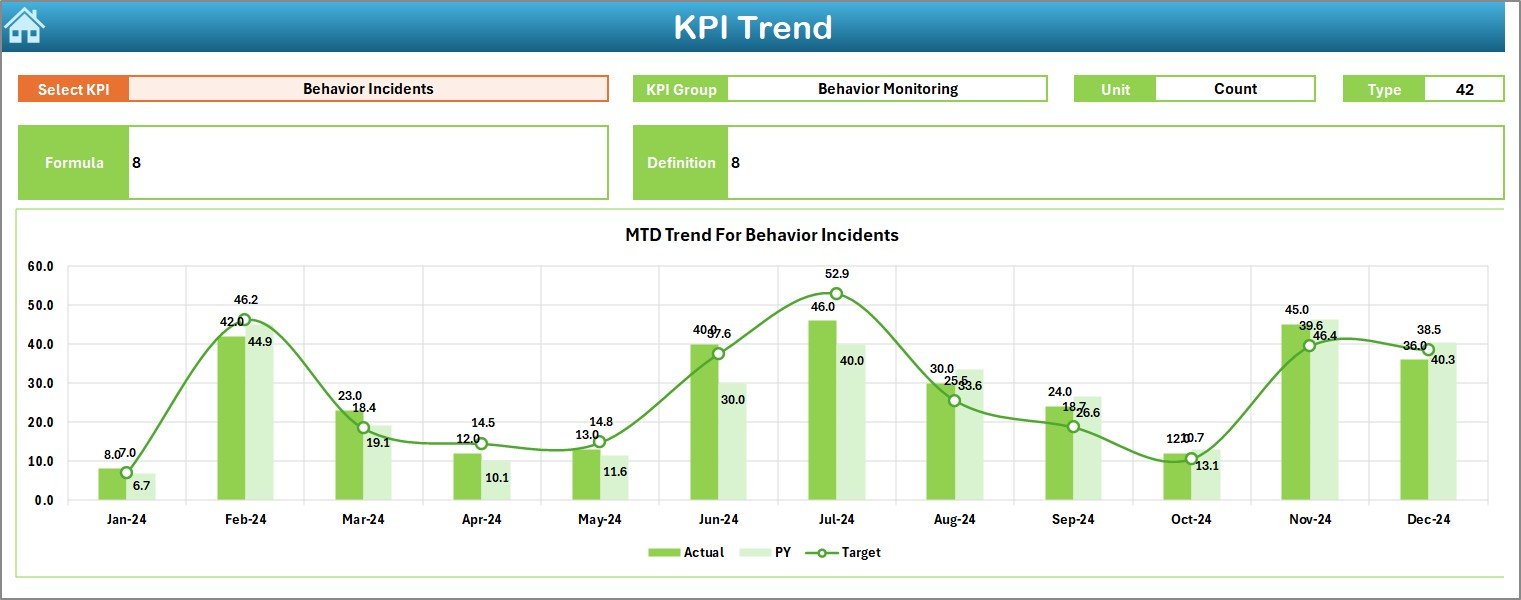
3. Trend Analysis for Every KPI
Visual trend lines help you understand monthly performance patterns and identify early warning signals.
4. Structured Worksheets
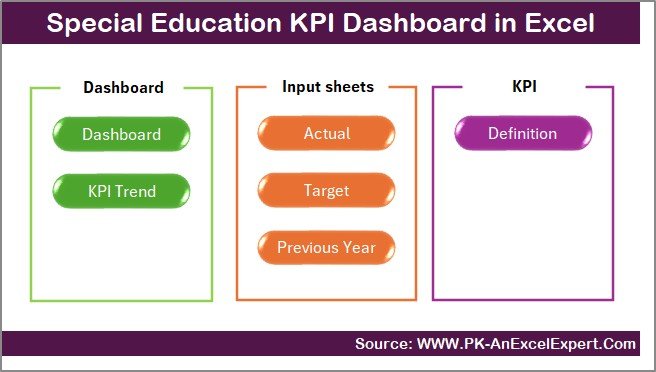
Includes Summary Page, Dashboard, Trend Sheet, Actual Input Sheet, Target Sheet, Previous Year Data Sheet, and KPI Definition Sheet.
5. Visual Indicators
Automatic up/down arrows show whether performance is improving or declining.
6. 100% Excel-Based
No paid software, no learning curve — works on any version of Excel.
📦 What’s Inside the Special Education KPI Dashboard
Inside this professionally-designed Excel file, you get:
📁 Summary Page
Your homepage with navigation buttons for instant access.
📊 Dashboard Sheet
Displays MTD/YTD Actuals, Targets, and Previous Year values with auto-updating visuals.
📈 Trend Sheet
Select any KPI and view its performance patterns throughout the year.
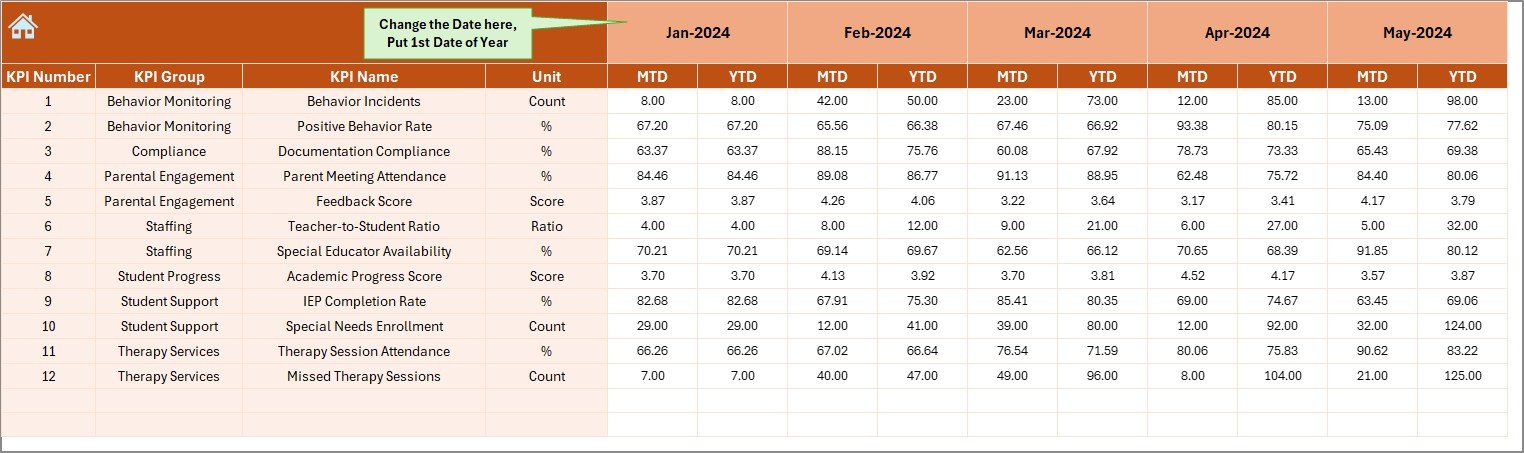
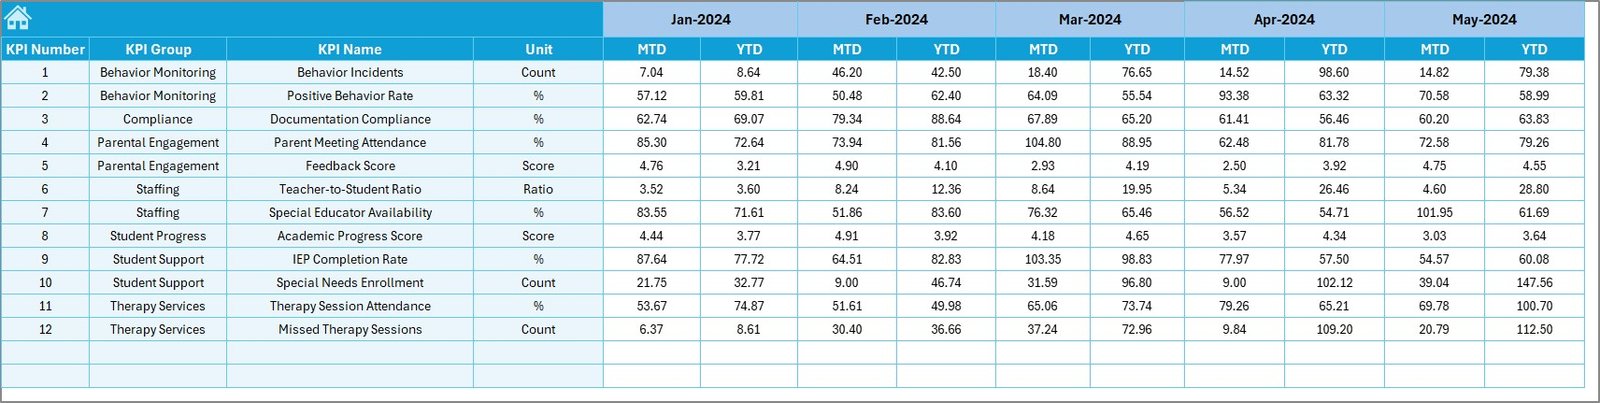
📝 Actual Numbers Input Sheet
Enter real performance numbers every month.
🎯 Target Sheet
Set MTD and YTD goals for every KPI.
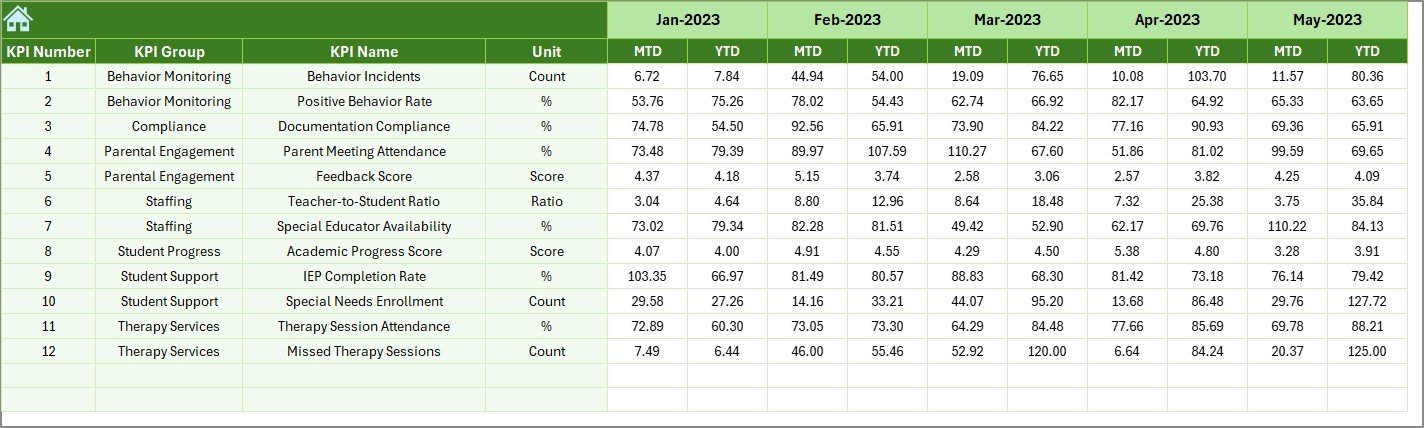
📚 Previous Year Sheet
Enter last year’s numbers for comparison and growth tracking.
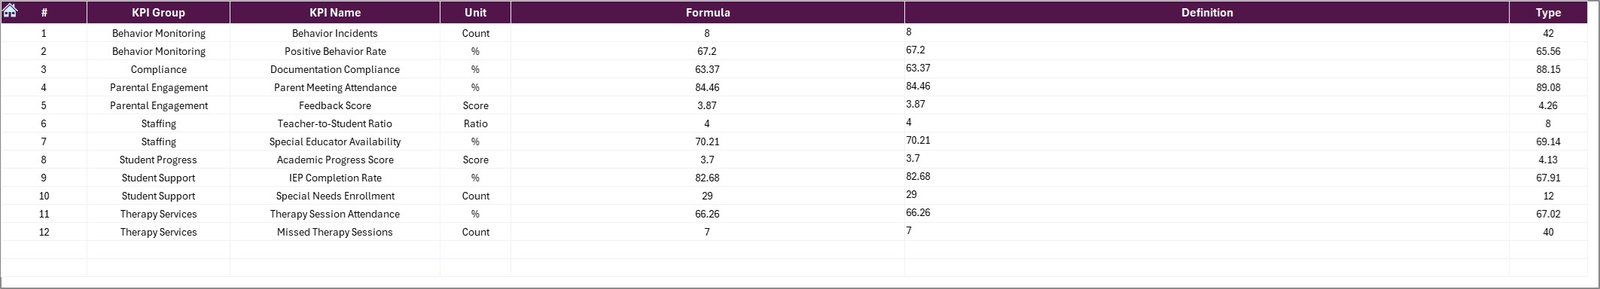
🔍 KPI Definition Sheet
Understand each KPI clearly — including Group, Unit, Formula, Type (UTB/LTB), and Definition.
Everything is organized so you can manage performance with confidence and accuracy.
🛠 How to Use the Special Education KPI Dashboard
Step 1: Enter Actual Data
Update monthly numbers in the Actual Input Sheet.
Step 2: Set Targets
Define clear MTD/YTD goals to drive accountability.
Step 3: Add Previous Year Values
Enable year-over-year comparison for better performance insights.
Step 4: View Dashboard
Select a month and instantly see all KPIs update.
Step 5: Track Trends
Open the Trend Sheet to analyze KPI performance over time.
Step 6: Review KPI Definitions
Ensure your team understands KPI meanings for consistent reporting.
Just update the sheets — the dashboard handles all calculations and visuals automatically.
🎯 Who Can Benefit from This Special Education KPI Dashboard
🏫 School Administrators
Get a complete snapshot of your special education department’s performance.
📘 Special Educators & Program Coordinators
Track academic progress, attendance, IEP completion, student support, and behavioral improvements.
📊 Data & Reporting Teams
Generate accurate monthly and annual reports in minutes.
💼 School Owners & Management
Make evidence-based decisions using data trends and performance indicators.
👨👩👧 Parents & Support Teams
Promote transparency and monitor student outcome improvements.
Anyone involved in special education planning, compliance, and performance review will benefit from this dashboard.
### Click here to read the Detailed Blog Post
Watch the step-by-step video tutorial:


Reviews
There are no reviews yet.