
Managing a Sovereign Wealth Fund (SWF) requires precision, transparency, and strategic insight. With portfolios worth billions spread across asset classes and regions, decision-makers need real-time visibility into investment performance and risk exposure. The Sovereign Wealth Funds Dashboard in Excel provides exactly that — a powerful, interactive, and ready-to-use reporting solution that transforms complex financial data into clear, actionable intelligence.
Built entirely in Microsoft Excel, this dashboard helps governments, fund managers, and financial analysts track performance, monitor diversification, and ensure long-term fiscal sustainability — all without the need for expensive BI tools or coding expertise.
⚙️ Key Features of the Sovereign Wealth Funds Dashboard in Excel
📊 Five Analytical Pages: Overview | Fund Name Analysis | Sector Analysis | Asset Class Analysis | Monthly Trends.
🗂️ Support & Data Sheets: Structured backend for inputs, slicers, and lookups.
💡 Page Navigator: Left-side panel for one-click navigation.
📈 Dynamic Visuals: KPIs, cards, and charts auto-update with each refresh.
🎯 Actual vs Target Comparisons: Identify outperforming or underperforming investments.
🌍 Regional Insights: See where capital is allocated and how it performs geographically.
💰 Risk & Return KPIs: Evaluate volatility, active investment %, and ROI trends.
📆 Monthly Performance View: Track consistency and detect early shifts.
✅ No Add-ins Required: Runs entirely on Excel formulas and pivot tables.
📊 Dashboard Structure Overview
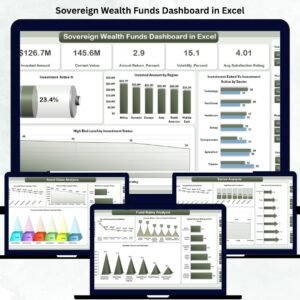
🏦 1️⃣ Overview Page — Fund Performance at a Glance
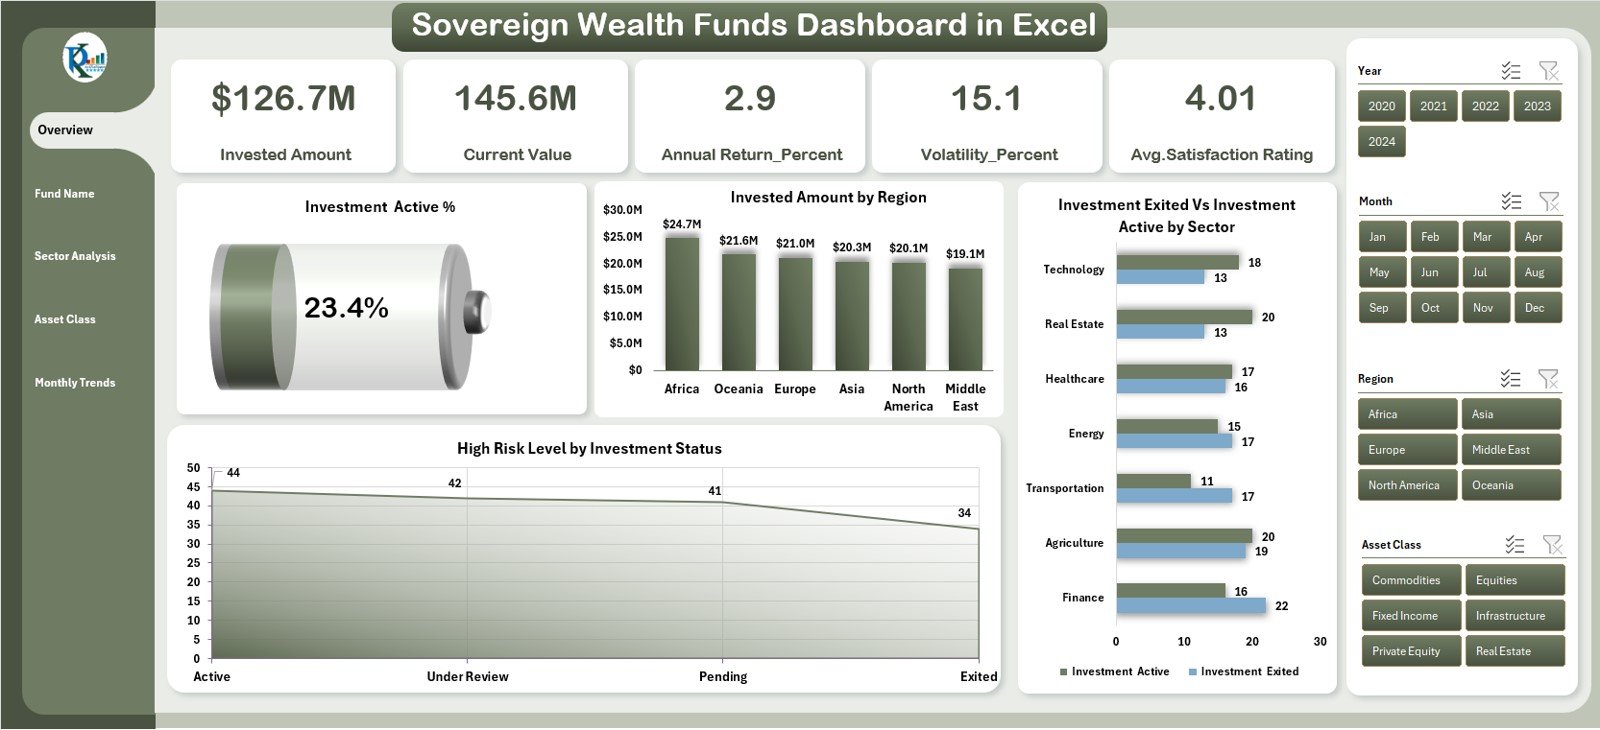
The command center for executives and analysts.
-
Five KPI cards summarize investment health.
-
Charts show Investment Active %, Invested Amount by Region, High-Risk Level by Status, and Active vs Exited Investments by Sector.
💡 Purpose: Provide a 360° snapshot of the fund’s portfolio distribution and risk concentration.
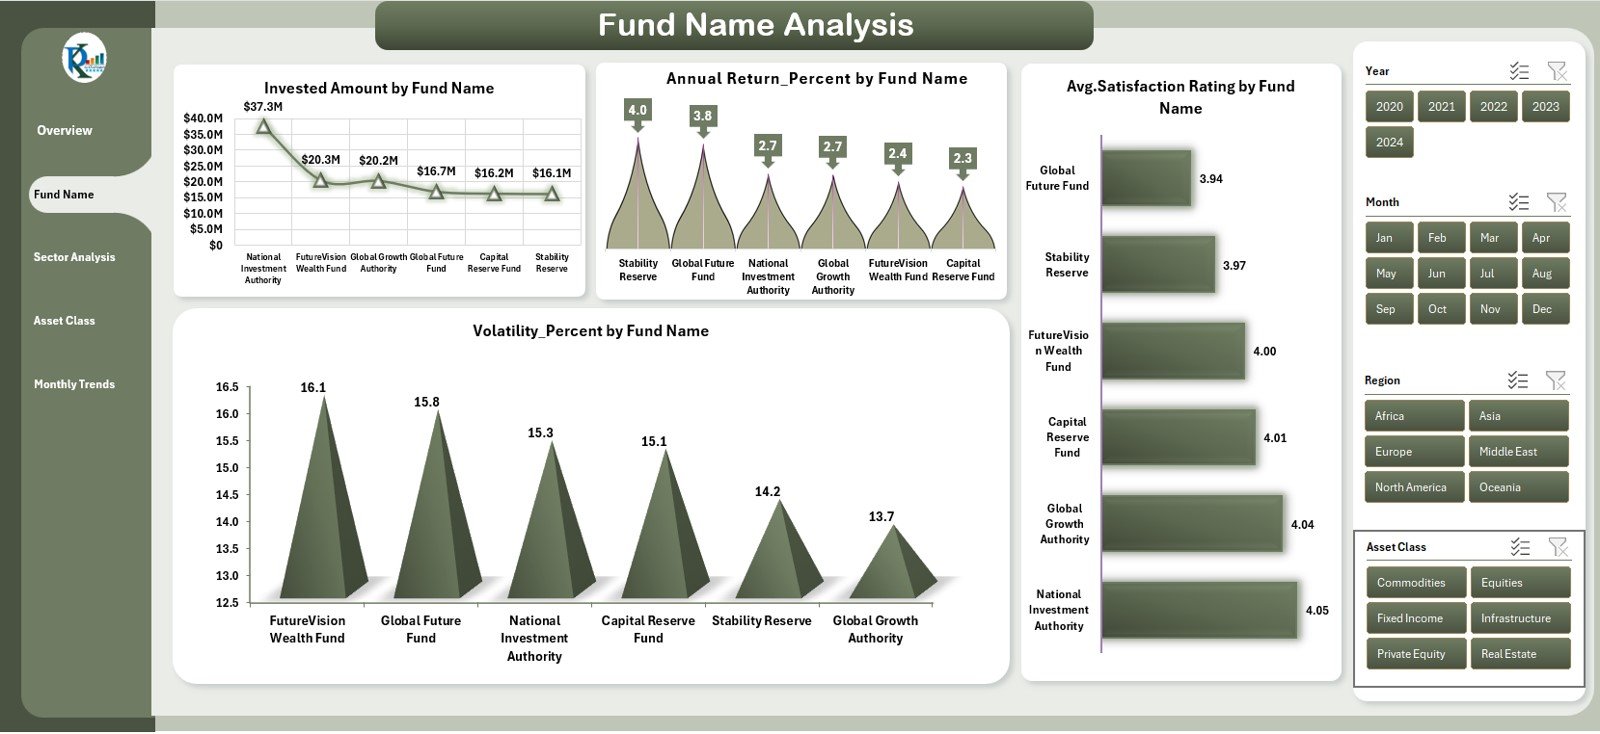
💰 2️⃣ Fund Name Analysis — Drill into Individual Funds
Analyze each sovereign fund separately.
-
KPIs include Annual Return %, Volatility %, Average Satisfaction Rating, and Invested Amount by Fund Name.
💡 Purpose: Identify top-performing and underperforming funds quickly.
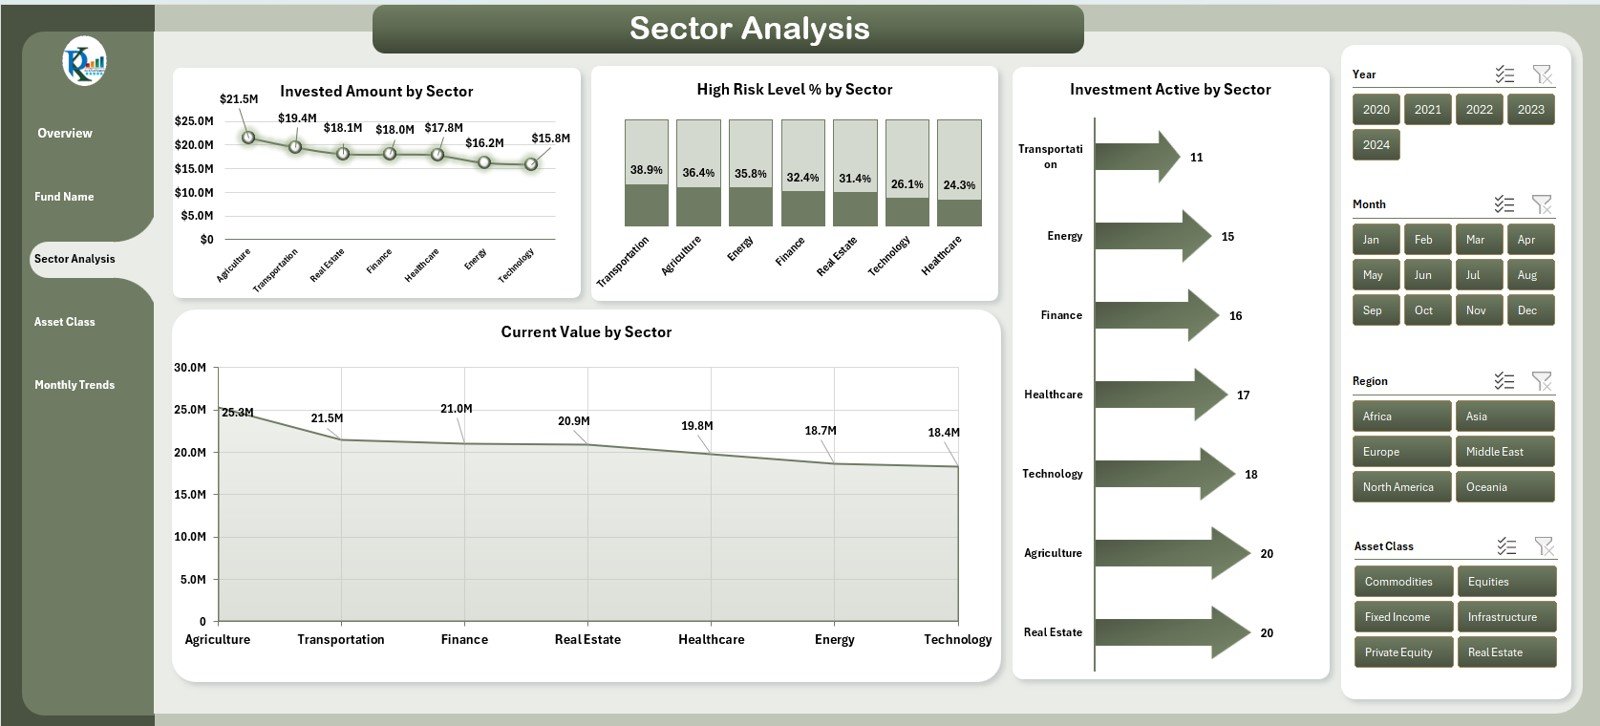
🏭 3️⃣ Sector Analysis — Industry Performance Breakdown
Review how sectors such as energy, infrastructure, healthcare, and technology contribute to returns.
-
Charts: Invested Amount, High-Risk Level %, Current Value, and Active Investments by Sector.
💡 Purpose: Optimize sectoral allocation for balanced growth.
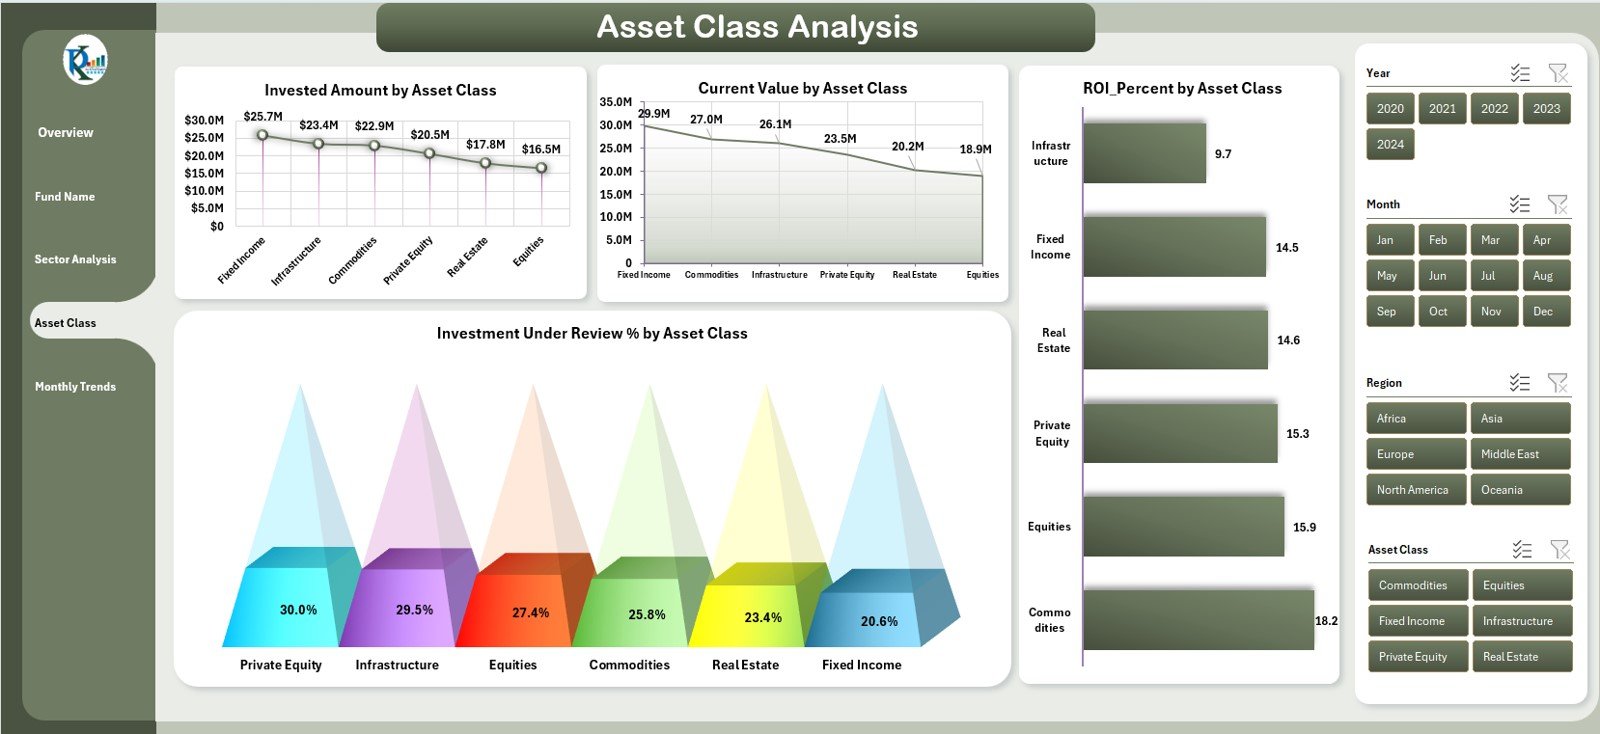
📊 4️⃣ Asset Class Analysis — Portfolio Diversification Insights
Understand how equities, bonds, real estate, and alternative assets perform.
-
Charts: Invested Amount, Current Value, Under Review %, and ROI % by Asset Class.
💡 Purpose: Maintain diversification and adjust exposure for risk control.
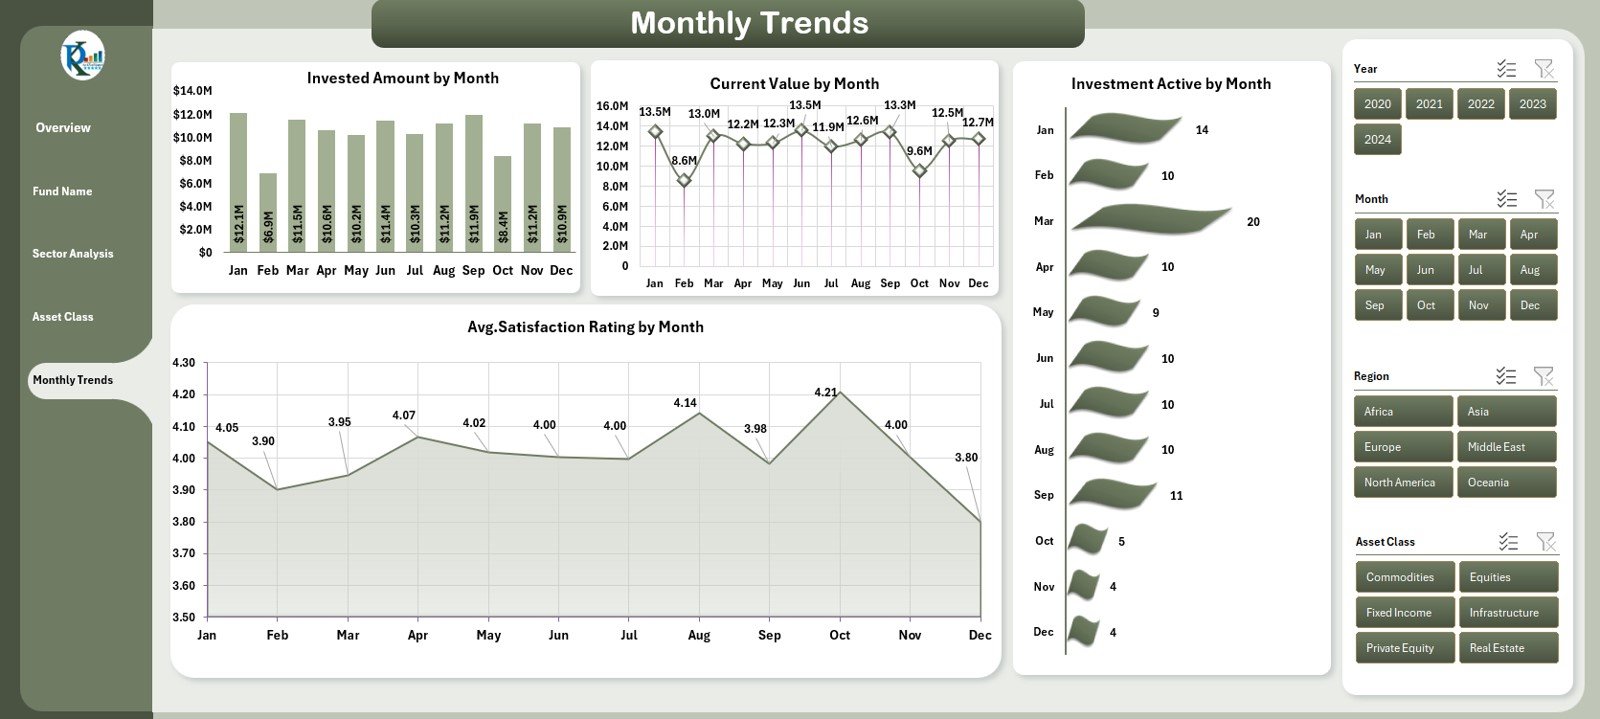
📅 5️⃣ Monthly Trends — Track Progress Over Time
Monitor monthly changes in fund activity and returns.
-
Charts: Invested Amount, Current Value, Satisfaction Rating, and Investment Active by Month.
💡 Purpose: Detect patterns, forecast performance, and plan future strategies.
🧾 Supporting Sheets — The Data Engine
📘 Support Sheet: Lookup tables for regions, sectors, and slicers.
📊 Data Sheet: Core database containing fund, asset, and performance metrics — update once to refresh all visuals.
🌟 Advantages of Using This Dashboard
✅ Centralized Monitoring: All portfolio data in one file.
✅ Real-Time Analysis: Refresh to update KPIs instantly.
✅ Enhanced Transparency: Clear visuals and formulas for auditability.
✅ Strategic Clarity: Spot trends and reallocate assets effectively.
✅ Cost Efficient: Get BI-level analytics without software fees.
✅ Customizable Design: Adapt KPIs, currencies, and layouts to local needs.
✅ Professional Presentation: Ideal for board reviews and government reporting.
💡 Best Practices for Using the Dashboard
📌 Keep data clean and validated.
📌 Define clear KPIs aligned to investment goals.
📌 Refresh data monthly for accurate trends.
📌 Use conditional formatting to highlight risks.
📌 Protect confidential sheets with passwords.
📌 Backup regularly for historical analysis.
📌 Integrate with Power BI or Power Query for automation.
👥 Who Can Benefit from This Template
🏛️ Government Investment Authorities
💼 Fund Managers & Portfolio Analysts
📊 Financial Institutions & Auditors
🌍 Sovereign Finance Departments
💰 Wealth Management Advisors
🧩 Conclusion
The Sovereign Wealth Funds Dashboard in Excel is an end-to-end investment analytics solution that combines data accuracy, transparency, and automation. It allows fund managers to evaluate sectoral performance, manage risks, and make informed allocation decisions — all within the familiar and powerful Excel environment.
💼 Empower sovereign investment decisions with clarity, confidence, and control — using Nextgen Templates’ Sovereign Wealth Funds Dashboard in Excel.


Reviews
There are no reviews yet.