Take control of your soil testing operations like never before! 🌱 The Soil Testing Services Dashboard in Power BI is a powerful, ready-to-use solution designed to turn complex soil data into clear, actionable insights. Whether you’re managing labs, analyzing crop data, or tracking performance, this dashboard gives you everything in one place.
Stop wasting time on manual reports and start making faster, smarter decisions with real-time visuals, dynamic charts, and interactive slicers. 💡
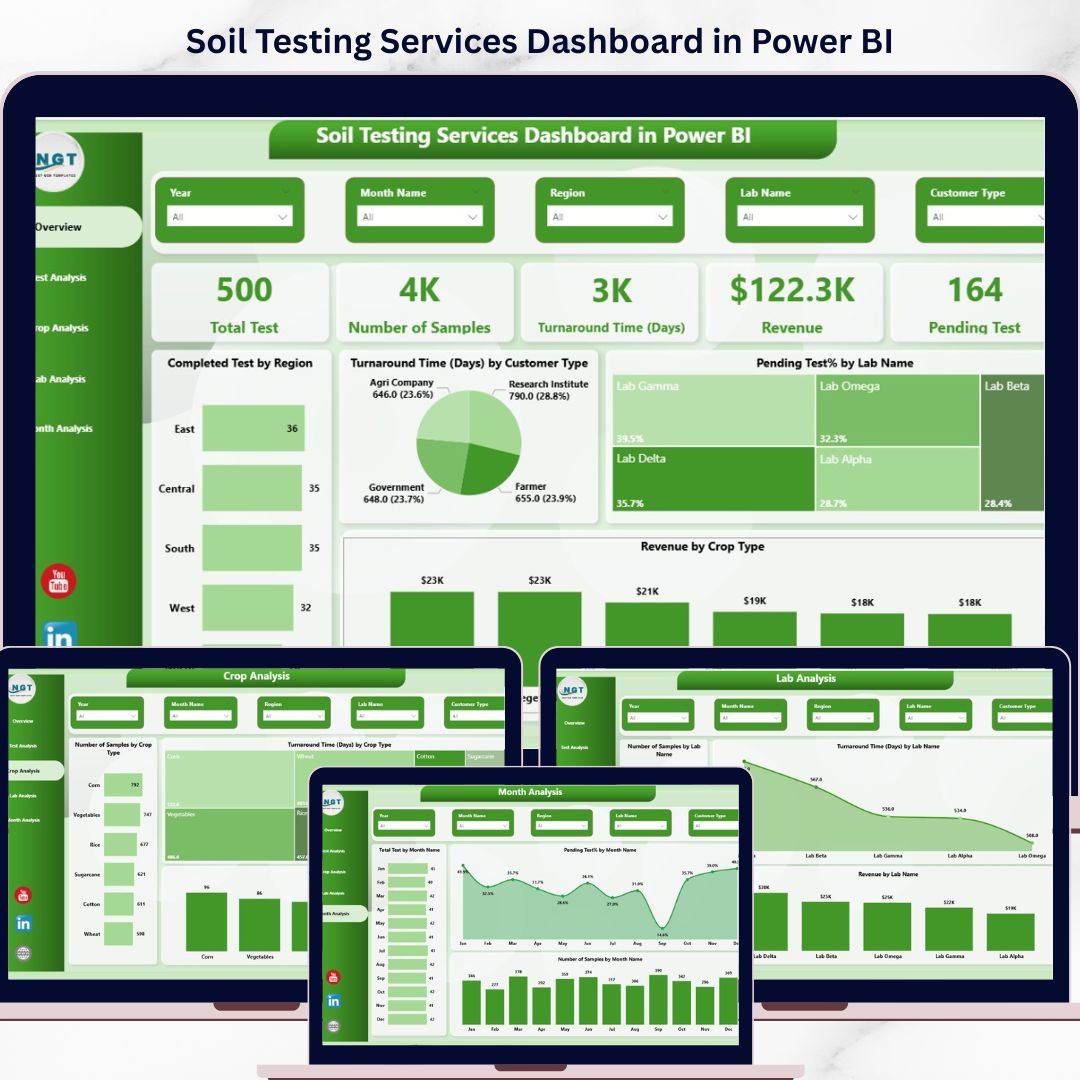
✨ Key Features of Soil Testing Services Dashboard in Power BI
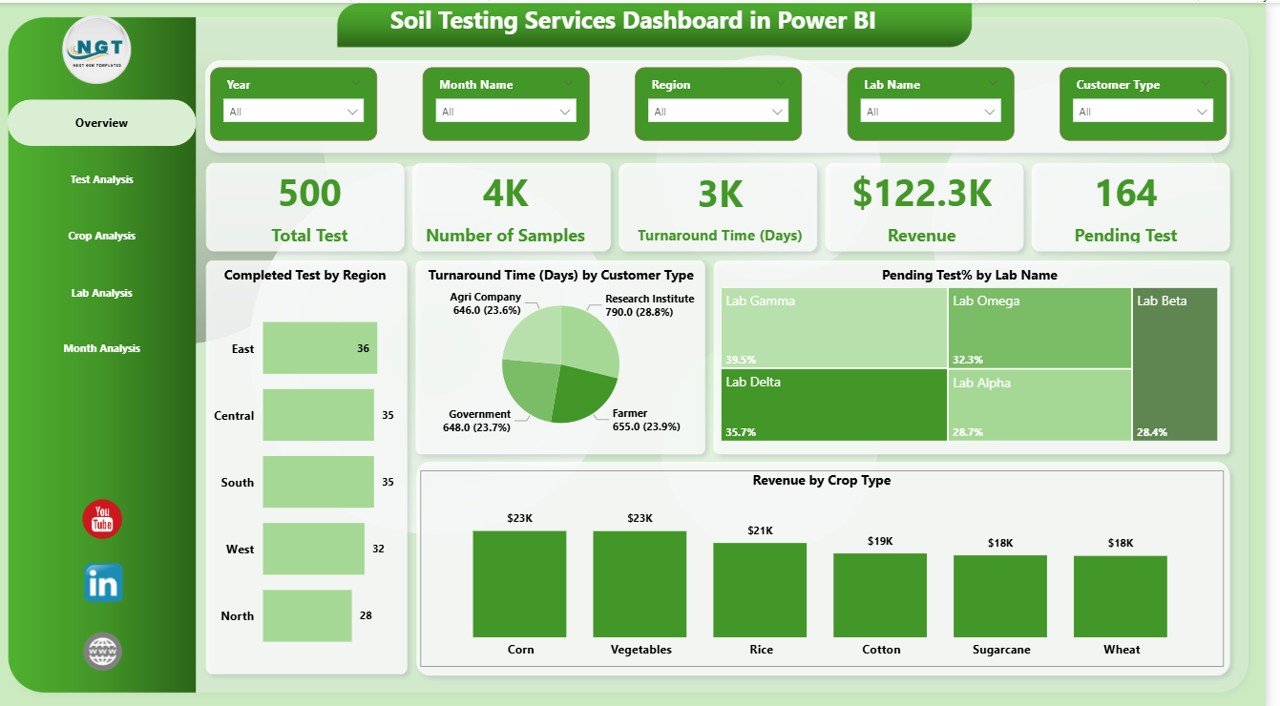
📊 Real-Time Performance Tracking
Monitor key KPIs like total tests, samples, revenue, and pending tests instantly.
📍 Region-Wise Analysis
Identify high-performing and underperforming regions with dynamic visuals.
⏱️ Turnaround Time Insights
Track average testing time across customer types, labs, and test categories.
💰 Revenue Analysis
Understand which crops and test types generate the most revenue.
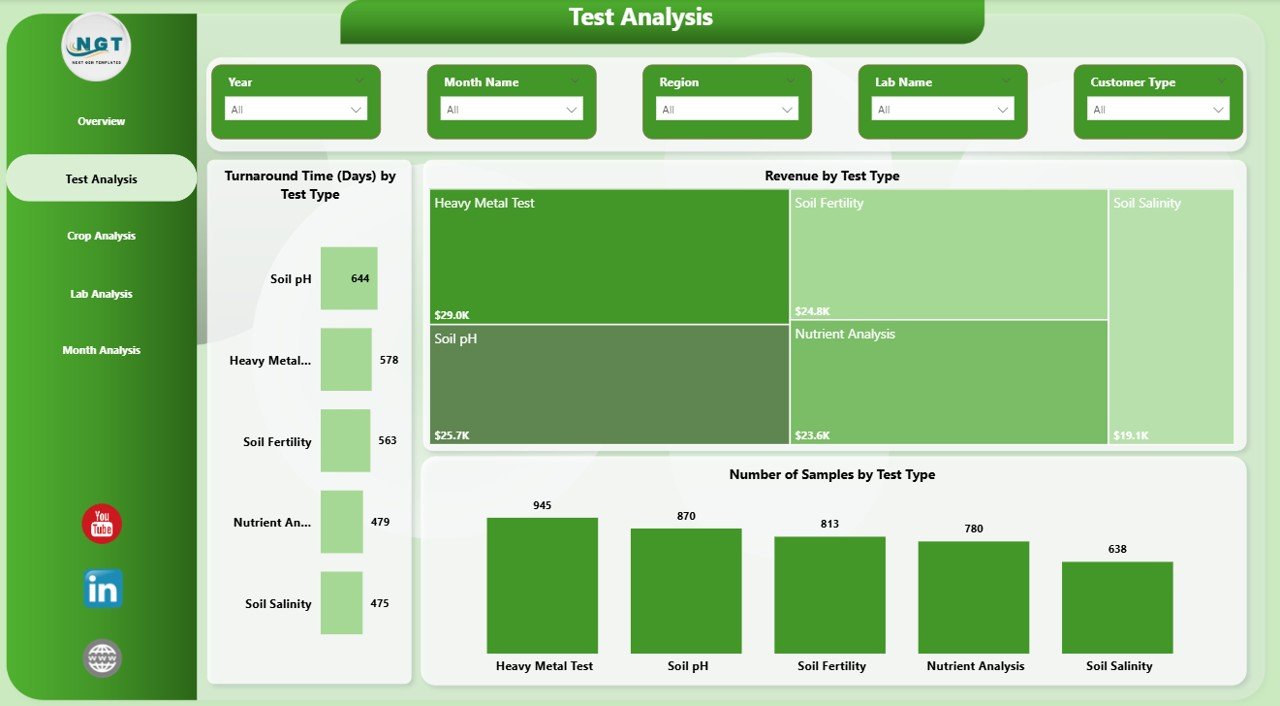
🧪 Detailed Test Analysis
Dive deep into test types with sample count, turnaround time, and revenue comparison.
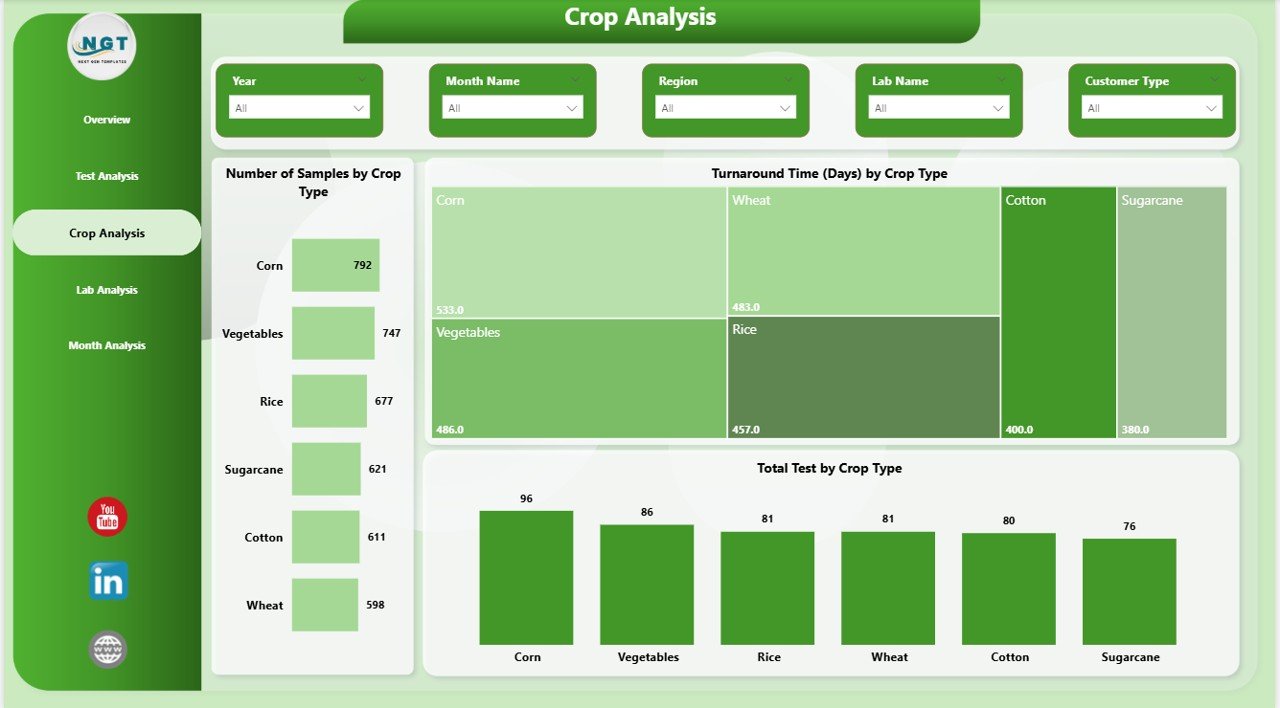
🌾 Crop-Based Insights
Analyze soil testing demand and trends across different crops.
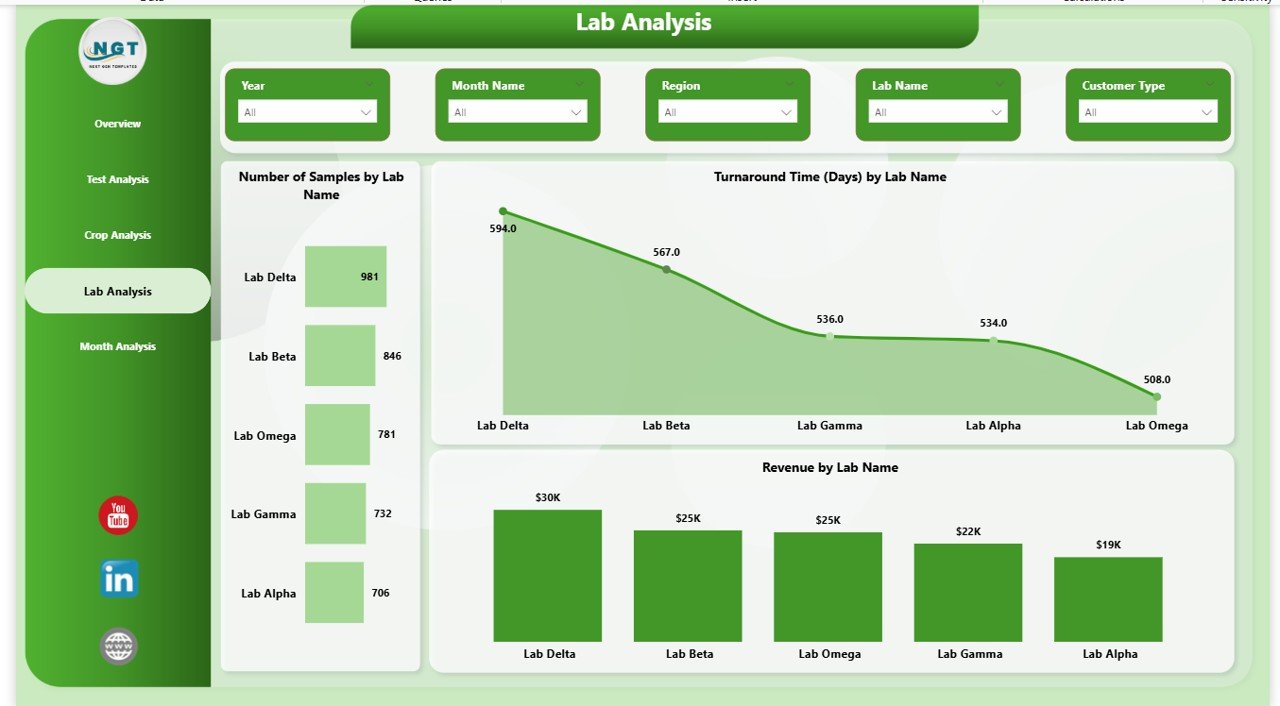
🏢 Lab Performance Monitoring
Evaluate lab efficiency, workload, and revenue contribution.
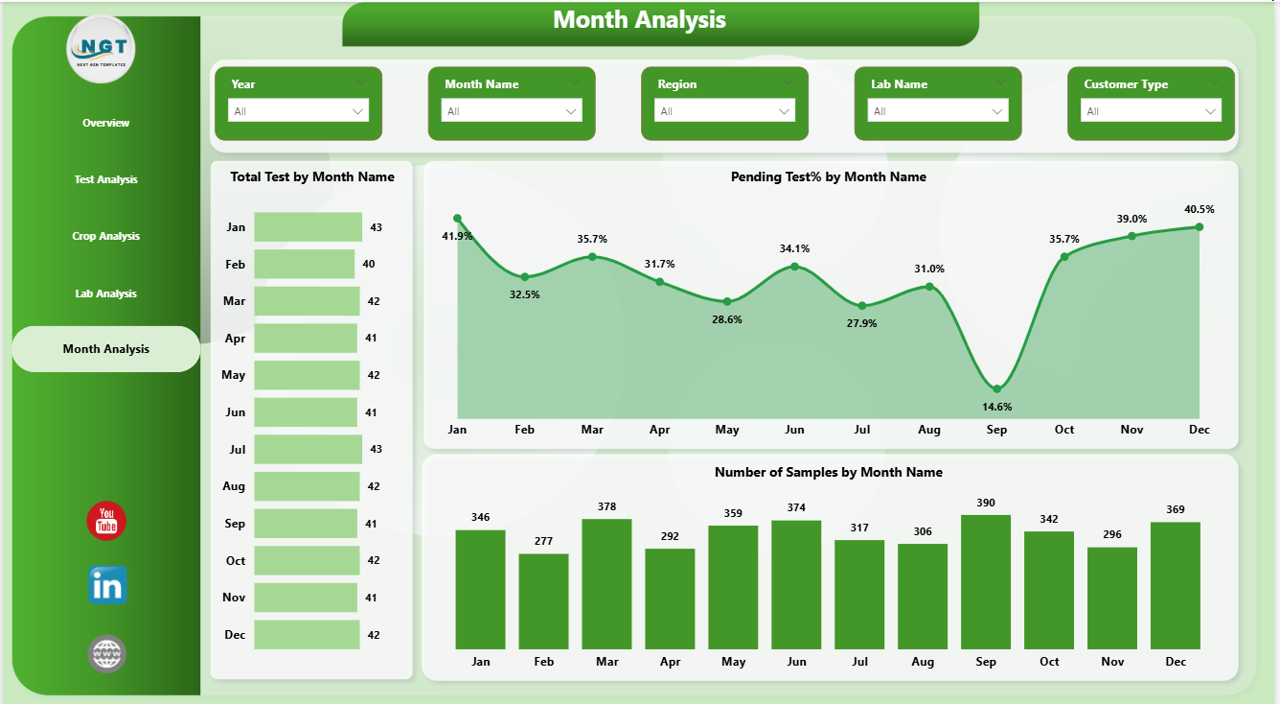
📅 Monthly Trend Analysis
Track performance over time and identify seasonal patterns.
🎯 Interactive Slicers & Filters
Quickly filter data for deeper insights and customized views.
🔄 Easy Data Refresh
Update your Excel/CSV data and refresh the dashboard in seconds.
📦 What’s Inside the Soil Testing Services Dashboard in Power BI
📁 5 Fully Interactive Dashboard Pages
- Overview Page (KPI summary + key visuals)
- Test Analysis Page
- Crop Analysis Page
- Lab Analysis Page
- Monthly Trends Page
📊 Powerful KPI Cards
- Total Tests
- Number of Samples
- Turnaround Time
- Revenue
- Pending Tests
📈 20+ Dynamic Charts & Visuals
- Bar Charts, Pie Charts, Tree Maps, Area Charts, and Column Charts
🎛️ User-Friendly Slicers
- Filter by region, crop, lab, customer type, and more
📂 Ready-to-Use Power BI File
Just plug in your data and start analyzing instantly
⚙️ How to Use the Soil Testing Services Dashboard in Power BI
1️⃣ Download the Dashboard File
Get instant access after purchase.
2️⃣ Update Your Data Source
Replace or update the Excel/CSV data file with your own data.
3️⃣ Refresh the Dashboard
Click “Refresh” in Power BI to load updated insights.
4️⃣ Use Slicers & Filters
Customize your analysis by selecting regions, labs, crops, or time periods.
5️⃣ Analyze & Take Action
Use insights to improve performance, reduce delays, and increase revenue.
👥 Who Can Benefit from This Soil Testing Services Dashboard in Power BI
🌱 Agriculture Testing Labs – Track performance and optimize testing workflows
🏢 Soil Testing Service Providers – Monitor revenue, samples, and turnaround time
📊 Data Analysts & Consultants – Deliver professional reports with ease
🚜 Agribusiness Companies – Improve decision-making using data insights
🏛️ Government & Research Organizations – Analyze soil data trends for policy and planning
🎓 Students & Trainers – Learn Power BI with a real-world project
🔥 Why This Dashboard is a Game-Changer
Instead of juggling multiple spreadsheets, this dashboard gives you a single source of truth for all your soil testing data. Moreover, it helps you identify bottlenecks, improve turnaround time, and boost operational efficiency.
As a result, you can save time, reduce errors, and make data-driven decisions faster than ever before! 🚀
Click here to read the Detailed blog post
Watch the step-by-step video tutorial:


