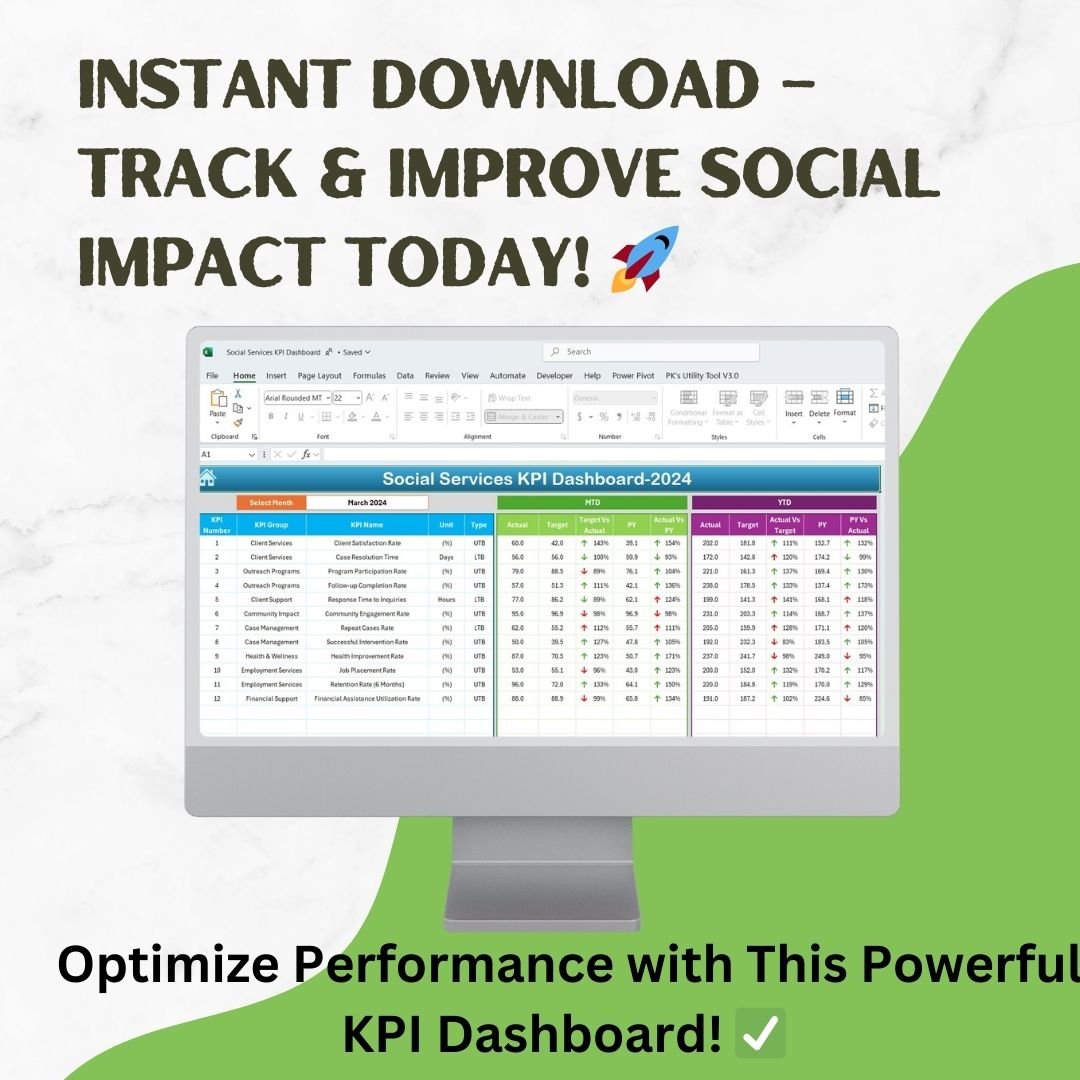


The Social Services KPI Dashboard in Excel is a powerful and fully automated solution designed to help organizations track, evaluate, and enhance their social impact. Whether you’re managing community outreach programs, client services, case management, or employment Social Services KPI Dashboard, this dashboard provides real-time insights to drive data-informed decision-making.
This Excel-based tool simplifies KPI tracking with dynamic reports, automated calculations, and interactive trend analysis, making it an essential resource for nonprofits, government agencies, and social service organizations.
Key Features
✅ Instant Download – Get Started in Seconds!
✅ Comprehensive KPI Dashboard – Track Key Metrics in Real-Time
✅ Automated Calculations – No Manual Work Needed!
✅ Interactive Charts & Trends – Visualize Performance Over Time
✅ Customizable & Scalable – Modify Metrics to Fit Your Needs
✅ Excel-Based – No Extra Software Required
What’s Inside?
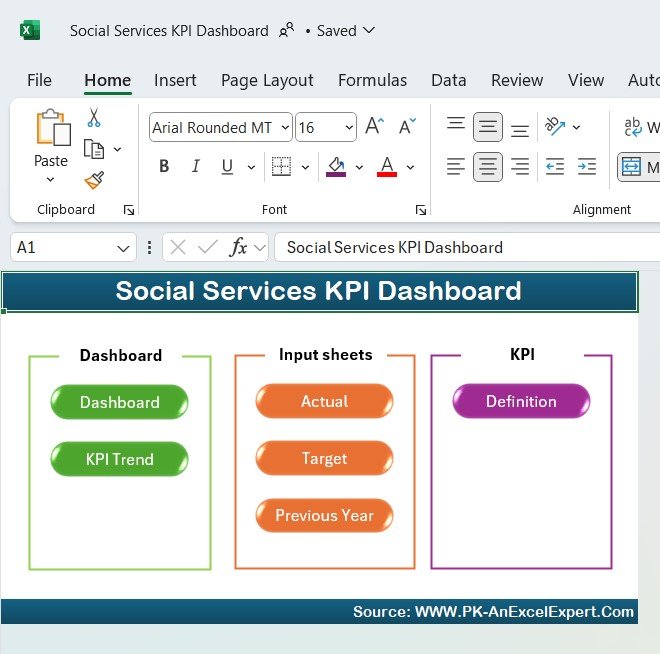
This Social Services KPI Dashboard includes seven well-structured sheets, each serving a distinct purpose to streamline data input, tracking, and analysis.
1. Home Sheet – The Central Hub
The Home Sheet acts as the main navigation panel, allowing easy access to all sections of the dashboard.
🖱️ Quick Navigation: Jump to any section with a single click.
📁 User-Friendly Layout: Clearly defined sections improve usability.
📊 Enhanced Productivity: Reduces time spent searching for relevant data.
💡 Simplify Your KPI Management with One-Click Access!
2. Dashboard Sheet – Instant Performance Overview
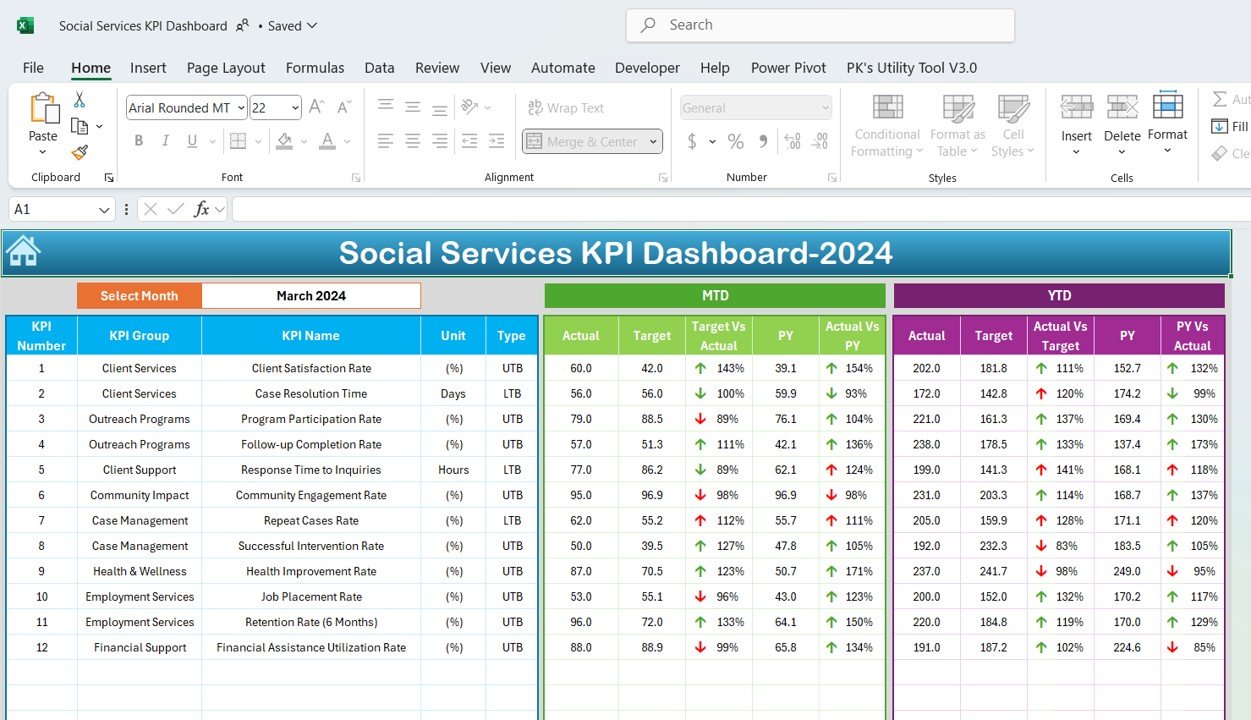
The Dashboard Sheet is the heart of the KPI tracking system, providing real-time insights into organizational performance.
📊 Key Metrics Covered:
- Month-to-Date (MTD) Data: Compare Actual vs. Target performance.
- Year-to-Date (YTD) Data: View trends and assess long-term impact.
- Historical Comparison: See progress against the Previous Year (PY).
- Dynamic Selection: Choose a specific month, and the dashboard updates instantly.
🔍 Why It’s Powerful?
✔ Real-Time Tracking – Get instant insights with auto-updated data.
✔ Visual Performance Indicators – Green/Red arrows for quick assessment.
✔ Comprehensive Reporting – Covers all essential social service KPIs.
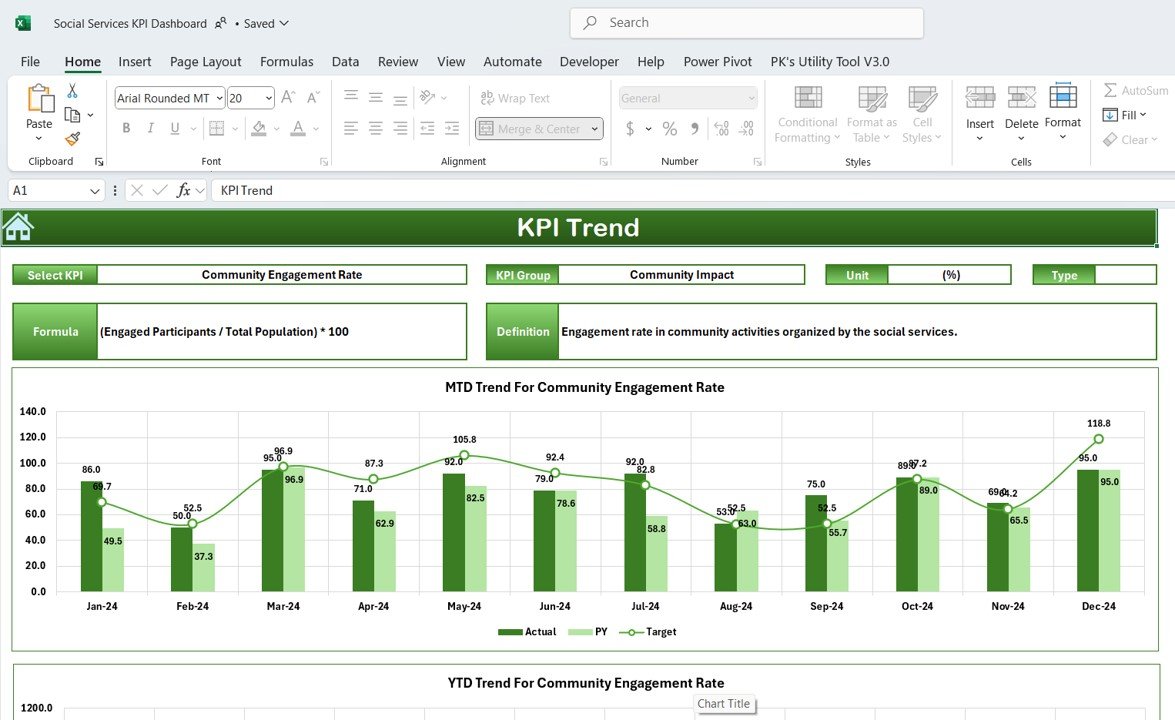
3. KPI Trend Sheet – Analyze Long-Term Performance
This sheet helps organizations monitor trends and identify patterns over time to drive better decision-making.
📌 What You’ll Find Here:
- KPI Selection (Dropdown in Cell C3): Choose a KPI to view its trends.
- KPI Group & Definition: Understand the importance of each KPI.
- Performance Type: Know whether a higher or lower value is better.
- MTD & YTD Charts: Easily track Actual, Target, and PY performance.
📈 Make Data-Driven Decisions with Clear Trends & Insights!
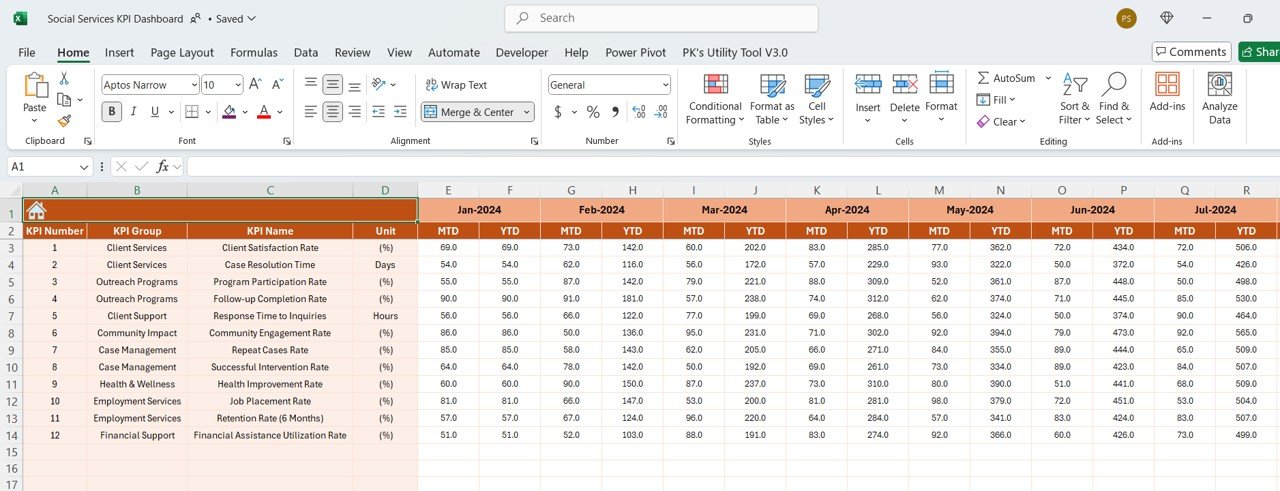
4. Actual Numbers Input Sheet – Record Real-Time Data
This sheet is used to input actual KPI performance for each month.
✍ Customizable Input Fields:
- Set the starting month (Cell E1) to align with reporting periods.
- Enter Month-to-Date (MTD) and Year-to-Date (YTD) figures easily.
- Automatically updates dashboard reports and trend charts.
📌 Why This Sheet Matters?
✔ Ensures accurate performance tracking for each KPI.
✔ Helps in identifying strengths and areas for improvement.
5. Target Sheet – Define Performance Benchmarks
The Target Sheet allows organizations to set realistic monthly and yearly performance goals.
🎯 Why This Sheet is Essential?
- Establishes clear benchmarks for success.
- Compares Actual vs. Target performance dynamically.
- Enables goal-driven decision-making for social impact initiatives.
6. Previous Year Numbers Sheet – Year-over-Year Comparisons
This sheet helps organizations track their historical performance trends by allowing input of last year’s KPI values.
📊 Key Benefits:
✔ Identify growth opportunities by comparing past and current performance.
✔ Evaluate long-term success of social programs.
✔ Highlight key impact areas that need more focus.
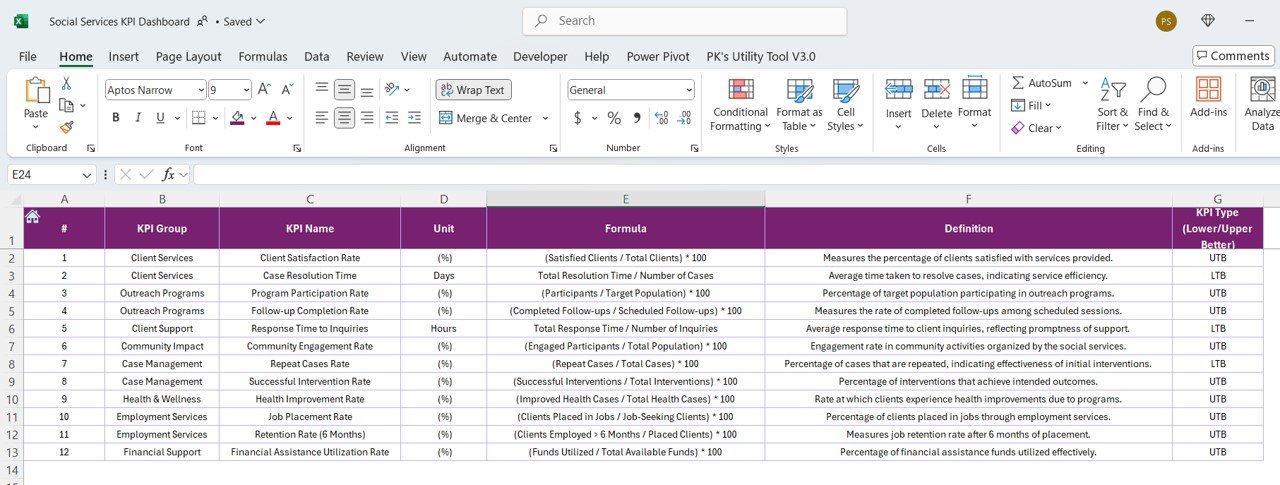
7. KPI Definition Sheet – A Complete KPI Guide
To ensure clear understanding of each KPI, this reference sheet includes:
📌 What You’ll Find Here:
- KPI Name & Group – Organizes metrics into relevant categories.
- Unit of Measurement – Defines how performance is quantified.
- Formula for Calculation – Ensures consistency in reporting.
- Definition & Performance Type (UTB/LTB) – Clarifies how the KPI should be interpreted.
📖 Ensure Consistency & Accuracy in KPI Reporting!
Why Choose This Social Services KPI Dashboard?
✅ Fully Automated: Eliminates manual work with real-time calculations.
✅ Professionally Designed: Clear, structured, and visually appealing.
✅ Customizable & Scalable: Modify KPI formulas and categories based on organizational needs.
✅ Excel-Based & Easy to Use: No additional software required.
✅ Data-Driven Decision-Making: Helps improve program impact, service efficiency, and client satisfaction.
📢 Perfect for:
✔ Nonprofit Organizations
✔ Government Agencies
✔ Community Outreach Programs
✔ Healthcare & Social Services
✔ Employment & Financial Assistance Programs
🔥 Take Control of Your Social Service KPIs & Improve Impact Today!
Get Your Copy Now!
The Social Services KPI Dashboard in Excel is a must-have tool for organizations looking to enhance performance, service quality, and program efficiency.
💡 Start Tracking & Improving Social Impact with Confidence!
Click hare to read the Detailed blog post
Visit our YouTube channel to learn step-by-step video tutorials


Reviews
There are no reviews yet.