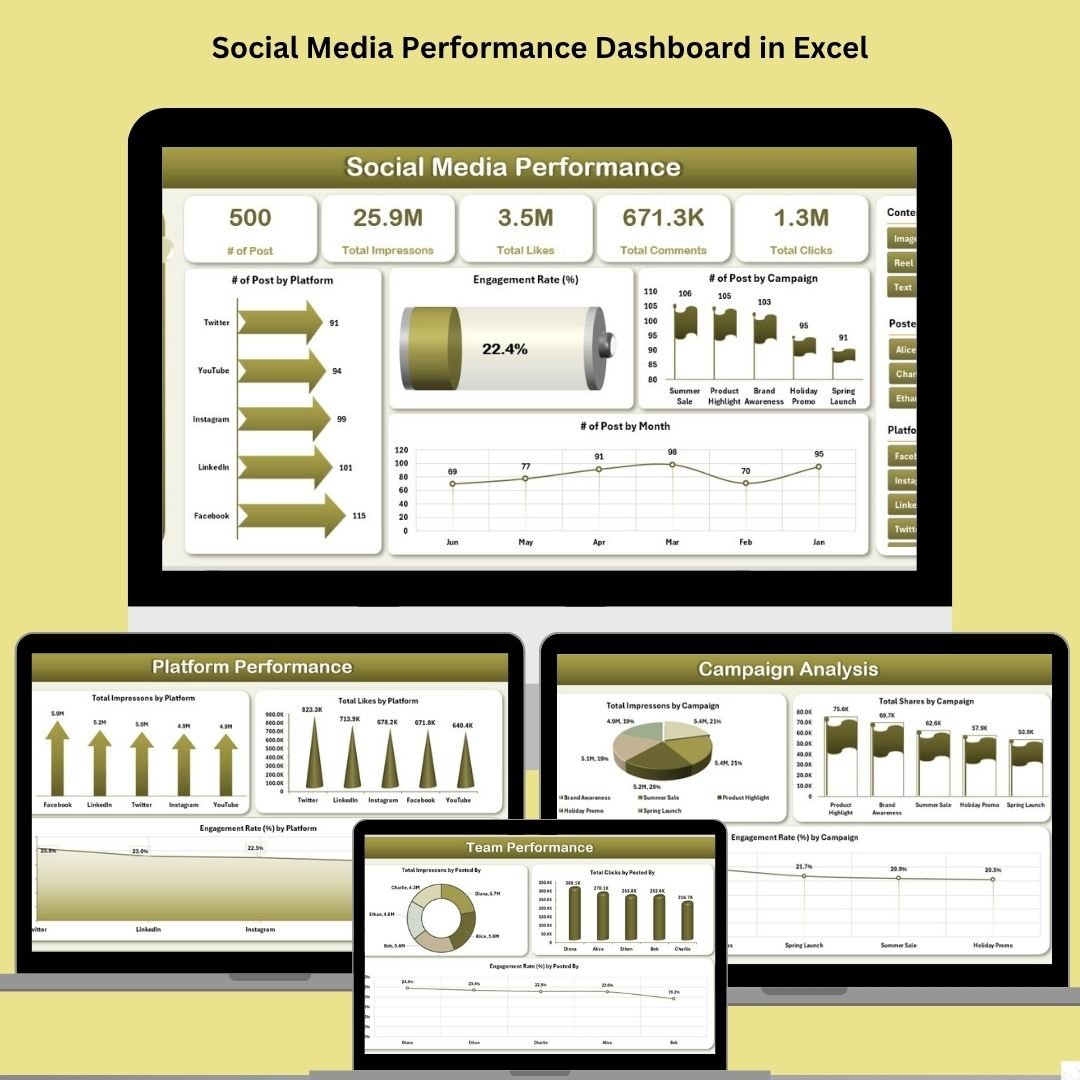
Take control of your social media performance—all in Excel!
If you’re tired of jumping between multiple analytics platforms, copying data into spreadsheets, and struggling with messy reports, we’ve got the solution. The Social Media Performance Dashboard in Excel is your all-in-one toolkit to monitor campaigns, track engagement, and showcase ROI—all without writing a single formula. 💼📈
This powerful Excel template consolidates key performance metrics from various platforms like Facebook, Instagram, LinkedIn, and Twitter. With interactive charts, easy slicers, and a sleek layout, you’ll turn raw data into stunning visuals in seconds.
⚙️ Key Features of Social Media Performance Dashboard
✅ Fully Interactive Dashboard Pages

-
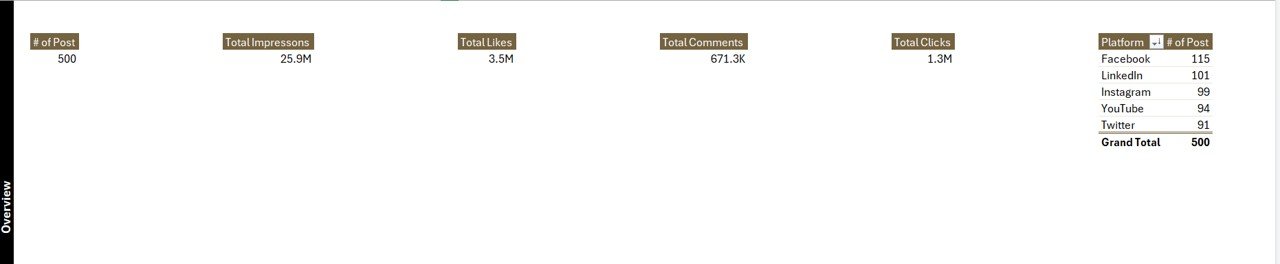
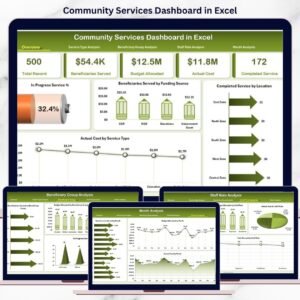
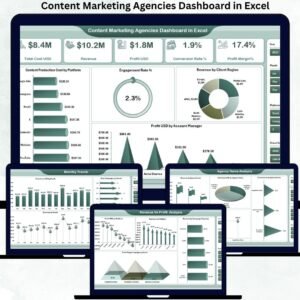
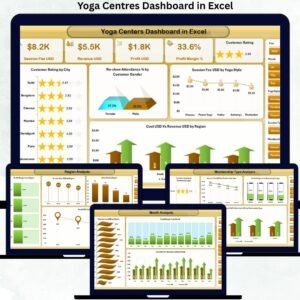
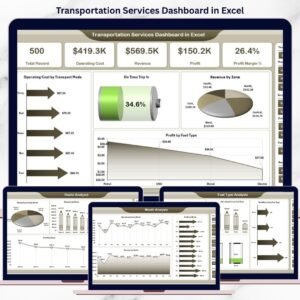
Overview Page with performance KPIs & charts
-
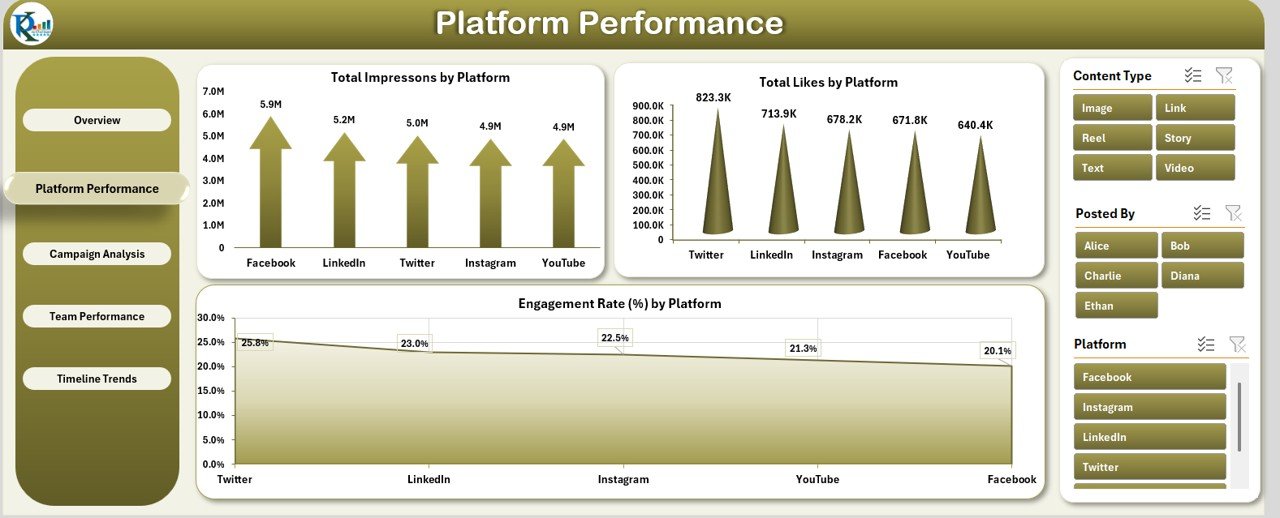
Platform Comparison to track impressions, likes & engagement
-
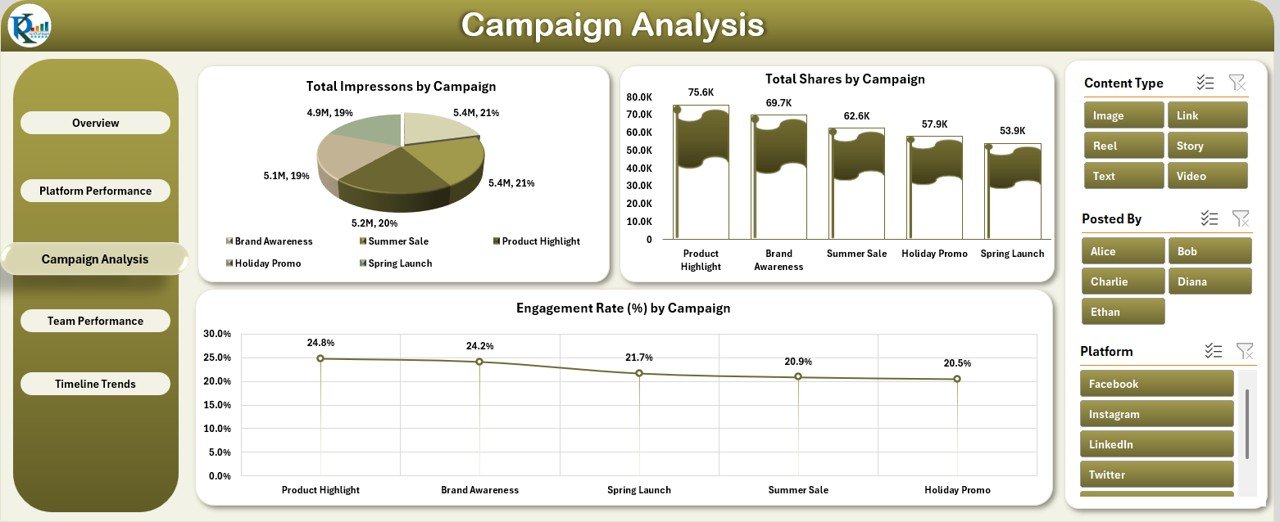
Campaign Analysis to fine-tune marketing efforts
-
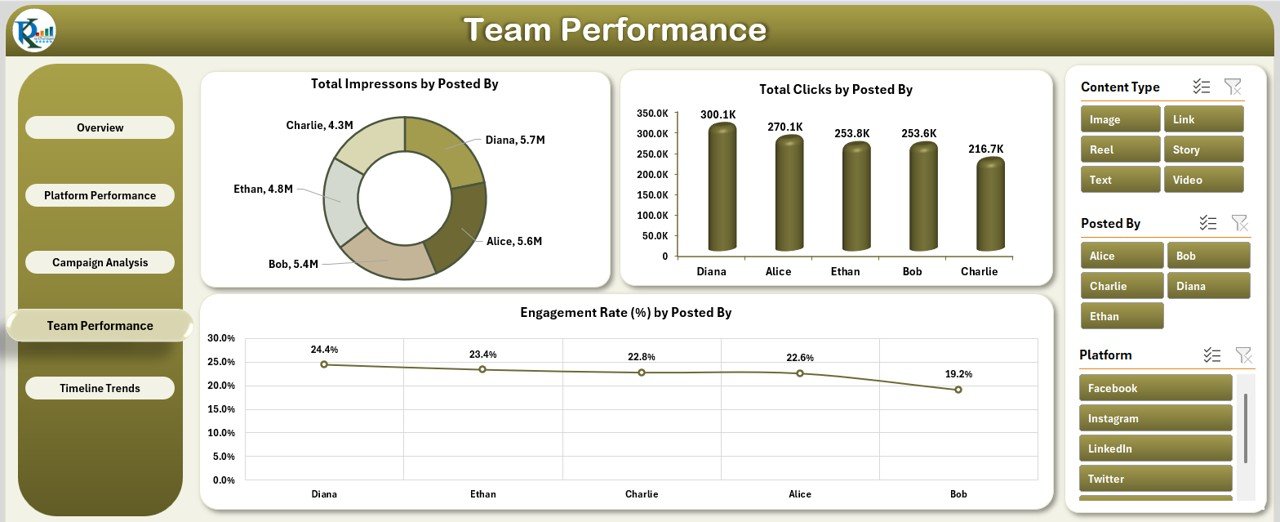
Team Performance to monitor employee productivity
-
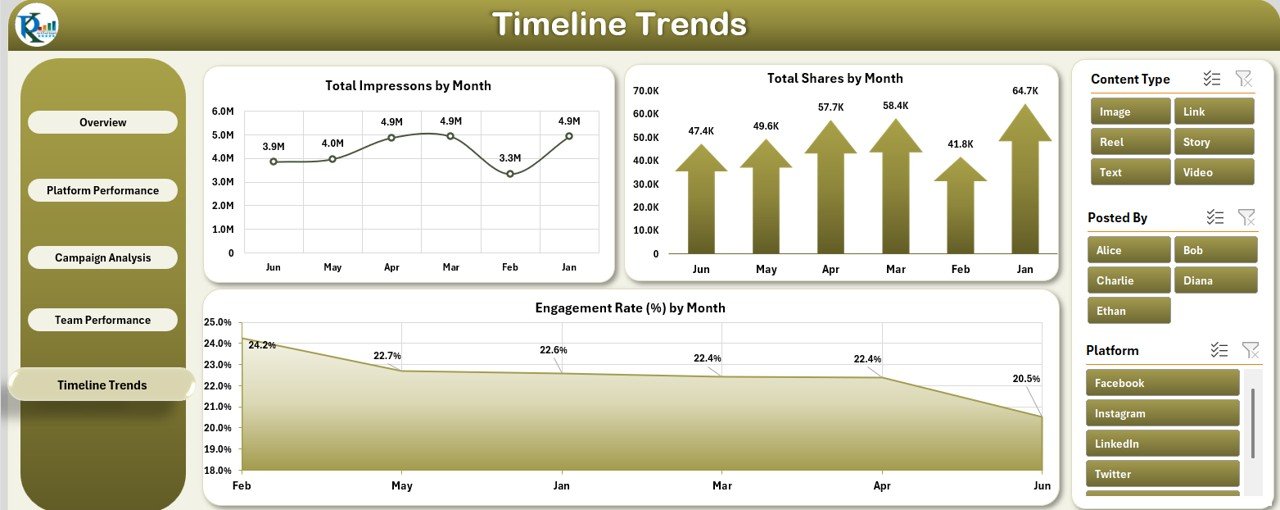
Timeline Trends to uncover monthly or seasonal patterns
✅ Dynamic Slicers on Every Page
Quickly filter by Platform, Month, Year, Campaign, and Posted By. Just a few clicks give you targeted insights.
✅ One-Click Page Navigation
Use the fixed left panel to instantly jump between dashboard sections—no more scrolling!
✅ Customizable Design
Match your brand by changing colors, logos, and chart formats. 🎨
📦 What’s Inside the Social Media Dashboard
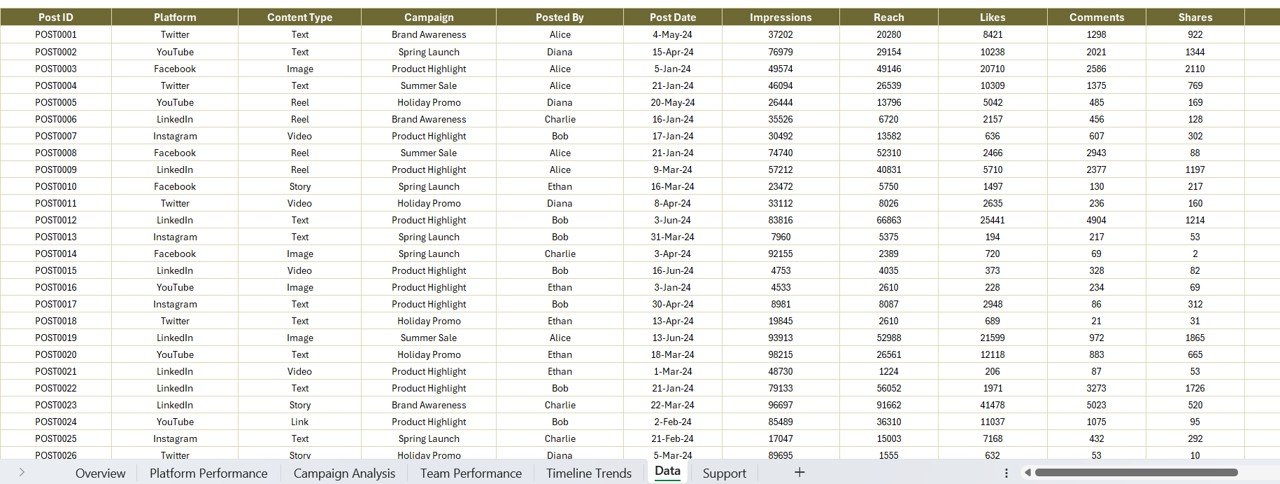
📄 Data Sheet
A structured table to input your raw data. Just copy-paste columns like:
-
Platform
-
Campaign
-
Posted By
-
Post Date
-
Impressions, Reach, Likes, Comments, Shares, Clicks
-
Month and Year
Everything updates automatically via Pivot Tables.
📑 Support Sheet
Stores dropdown values like platform names or campaigns for error-free slicers.
📊 5 Dashboard Tabs
Each dashboard page focuses on a different reporting angle to give you total visibility of your performance.
🧠 How to Use the Dashboard
-
Open the file in Excel (2016 or later).
-
Go to the Data Sheet and paste your social media data.
-
Use the left panel to navigate to any dashboard tab.
-
Apply slicers to filter by month, platform, or campaign.
-
Review KPIs, interpret trends, and export your insights.
💡 Tip: You can filter for client-specific reports, quarterly reviews, or individual team member performance.
🎯 Who Can Benefit from This Dashboard?
This Excel tool is built for anyone managing social media performance. Whether you’re working solo or managing a team, this dashboard is your game-changer:
-
📱 Social Media Managers
-
🧑💼 Marketing Executives & Agencies
-
🏢 Small Businesses & Startups
-
📊 Corporate Marketing Teams
-
🎨 Freelancers & Influencers
-
🤝 Non-Profits and Campaign Managers
🌟 Use Cases for the Dashboard
🔍 Campaign Reporting – Show off results before & after promotions
📅 Monthly Reviews – Present data-backed insights to stakeholders
📥 Client Reports – Create polished, ready-to-send updates
📈 Performance Tracking – See who’s leading the content game
🔄 Trend Analysis – Monitor seasonal dips or viral growth
🤝 Best Practices for Maximum Impact
✅ Update data weekly or monthly
✅ Use consistent naming for platforms, campaigns & team members
✅ Leverage slicers to filter by platform, month, or campaign
✅ Monitor engagement rate closely—it reflects audience interest
✅ Back up your file before every major data update
🔗 Click here to read the Detailed blog post
📹 Visit our YouTube channel to learn step-by-step video tutorials
👉 youtube.com/@PKAnExcelExpert


Reviews
There are no reviews yet.