
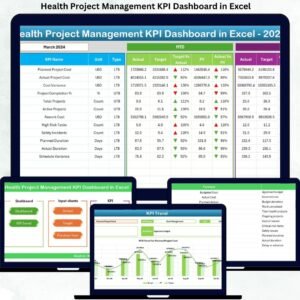
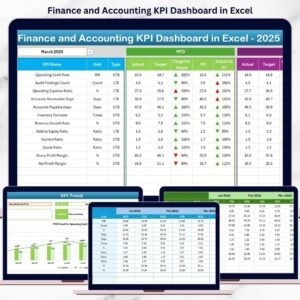
The Smart Home Industry KPI Dashboard in Excel is an innovative tool designed for businesses in the smart home sector, including manufacturers, service providers, and integrators. This customizable dashboard helps you track, monitor, and analyze key performance indicators (KPIs) that are critical to the success of your smart home products and services. With this dashboard, you can gain insights into sales performance, customer satisfaction, product usage, and installation efficiency, enabling you to optimize your smart home offerings and drive business growth.
Whether you’re managing smart home devices, home automation services, or IoT-based solutions, this Excel-based dashboard provides real-time insights into your operations, allowing you to make data-driven decisions. The Smart Home Industry KPI Dashboard in Excel is the perfect tool to help businesses in the smart home industry stay competitive and improve both product performance and customer experience.
Key Features of the Smart Home Industry KPI Dashboard in Excel
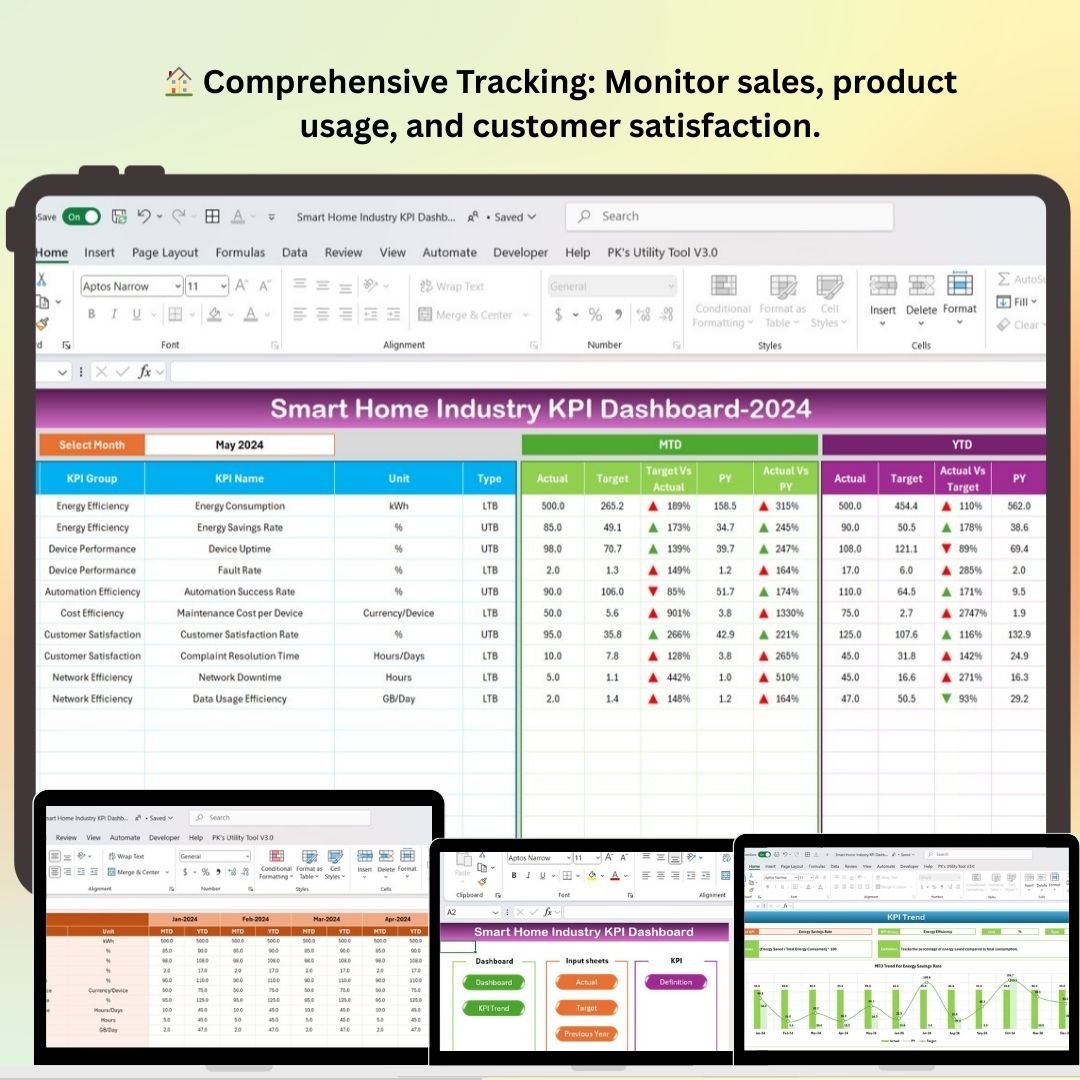
🏠 Comprehensive Smart Home Tracking
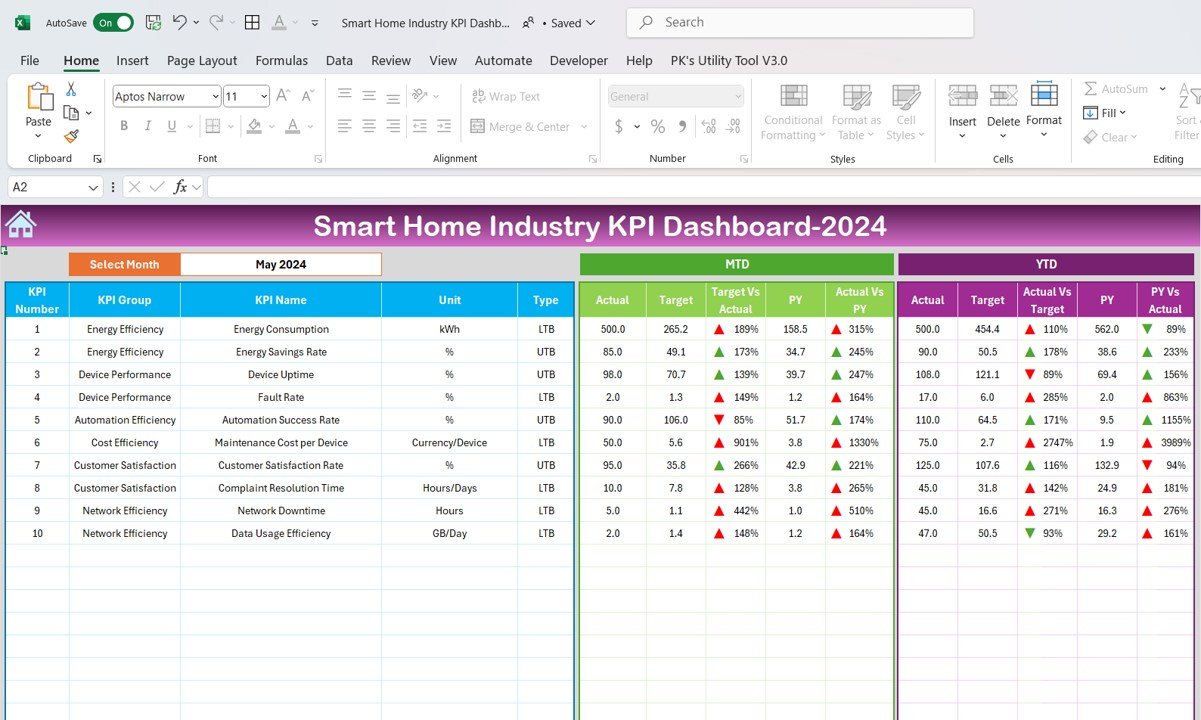
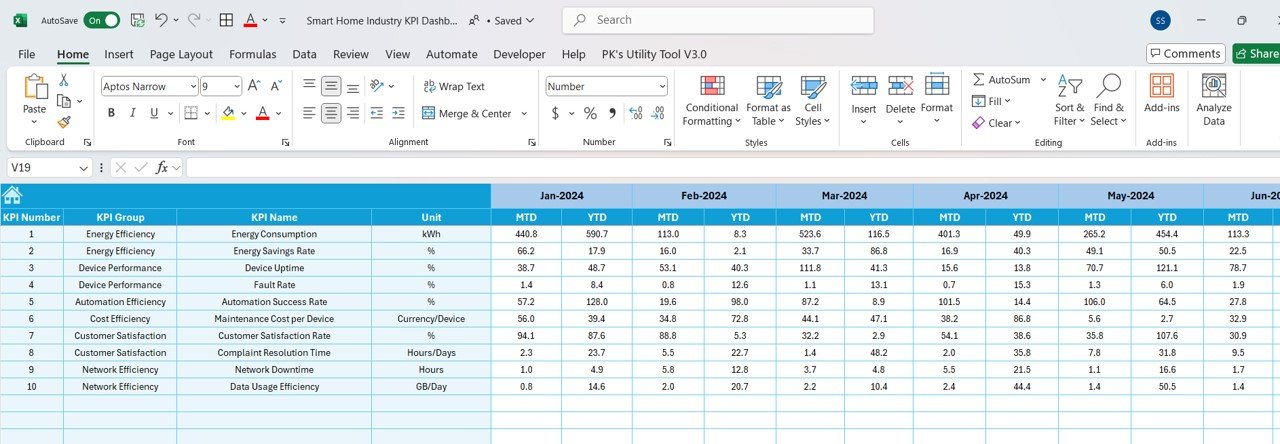
Track KPIs related to smart home sales, product usage, installation times, customer satisfaction, and device performance. Get a complete view of your business operations and product performance.
⚡ Real-Time Sales & Performance Monitoring
Monitor sales trends, product demand, and the effectiveness of marketing campaigns in real-time. Track which smart home products are performing well and which ones need improvement.
📈 Customer Satisfaction & Usage Insights
Analyze customer feedback, satisfaction levels, and product usage data to understand customer preferences and improve product offerings and customer support.
📅 Installation & Service Efficiency
Monitor the efficiency of installations and service requests. Track the number of installations completed, service response times, and the overall quality of service to ensure customer satisfaction.
🖥️ Interactive & User-Friendly Interface
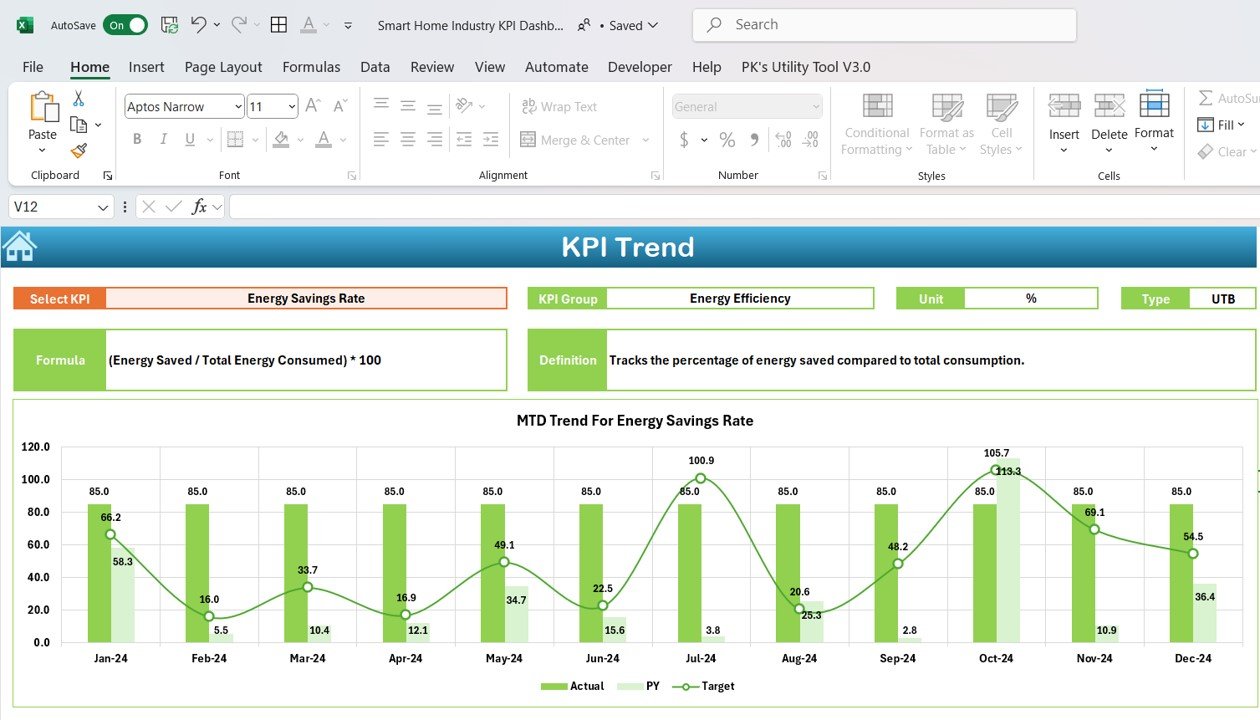
The Excel dashboard is designed to be easy to navigate, offering interactive charts, filters, and slicers that allow you to drill down into specific data points and track your smart home business performance.
Why You’ll Love the Smart Home Industry KPI Dashboard in Excel

✅ Track Smart Home Sales Performance
Monitor sales trends, product demand, and customer acquisition rates to identify high-performing products and adjust your sales strategies accordingly.
✅ Optimize Product Usage & Customer Satisfaction
Track customer feedback, product usage data, and satisfaction levels to improve customer experience and ensure that your products meet customer expectations.
✅ Enhance Installation & Service Efficiency
Track installation completion rates, service request response times, and customer satisfaction with service delivery to ensure efficient operations.
✅ Make Data-Driven Business Decisions
Leverage insights from real-time data to make informed decisions about product offerings, sales strategies, and customer support, helping you stay competitive in the smart home market.
✅ Maximize ROI on Smart Home Solutions
Monitor revenue, sales performance, and customer retention to ensure that your smart home solutions are delivering a positive return on investment.
What’s Inside the Smart Home Industry KPI Dashboard Template?
- Sales & Product Tracking: Monitor sales performance, product demand, and market trends to optimize your smart home offerings.
- Customer Satisfaction Analysis: Track customer satisfaction levels, feedback, and usage data to ensure high-quality experiences.
- Installation & Service Monitoring: Monitor installation efficiency, service response times, and customer support performance.
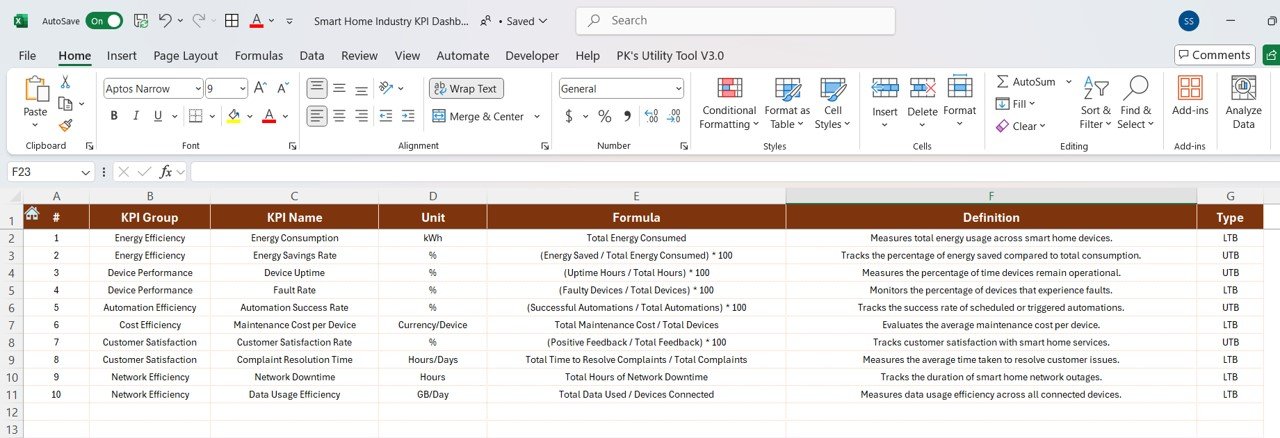
- Customizable KPIs: Adjust the dashboard to track specific metrics such as device performance, IoT system usage, or customer retention.
- Interactive Reporting: Use dynamic charts, filters, and slicers to dive deeper into smart home data and improve business operations.
How to Use the Smart Home Industry KPI Dashboard in Excel
1️⃣ Download the Template: Get instant access to your Smart Home Industry KPI Dashboard.
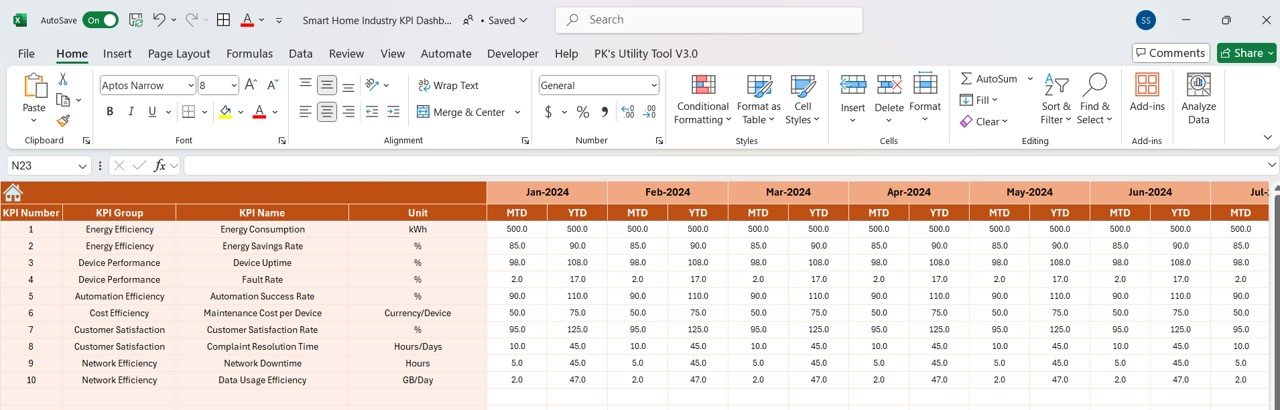
2️⃣ Input Sales & Performance Data: Enter data such as sales figures, product usage stats, customer satisfaction scores, and installation times.
3️⃣ Track & Monitor KPIs: Use the dashboard to monitor real-time performance across all aspects of your smart home business.
4️⃣ Analyze & Optimize: Use insights from the dashboard to optimize product offerings, sales strategies, and customer support to improve business efficiency.
Who Can Benefit from the Smart Home Industry KPI Dashboard in Excel?
🔹 Smart Home Manufacturers & Product Developers
🔹 Home Automation Service Providers
🔹 IoT Solution Providers & Installers
🔹 Sales & Marketing Teams in the Smart Home Industry
🔹 Business Owners & Entrepreneurs in the Smart Home Sector
🔹 Customer Support & Operations Managers
Track, analyze, and optimize your smart home business with the Smart Home Industry KPI Dashboard in Excel. Monitor sales, customer satisfaction, product performance, and service efficiency to ensure that your products meet the needs of today’s tech-savvy consumers.
Click here to read the Detailed blog post
Visit our YouTube channel to learn step-by-step video tutorials
Youtube.com/@PKAnExcelExpert


Reviews
There are no reviews yet.