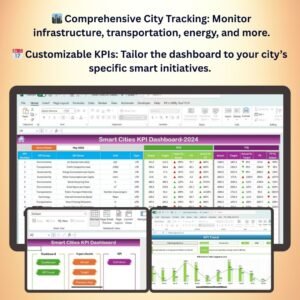
The Smart Cities KPI Dashboard is an innovative tool designed for urban planners, city managers, and decision-makers to track, analyze, and optimize key performance indicators (KPIs) for smart city initiatives. This interactive dashboard provides real-time insights into various aspects of urban life, including infrastructure, transportation, energy consumption, safety, and public services, helping to improve the quality of life for city residents.
Whether you are monitoring traffic patterns, energy usage, or waste management, the Smart Cities KPI Dashboard in Excel gives you a comprehensive overview of your city’s performance. With customizable KPIs and a user-friendly interface, this dashboard is an essential tool for efficiently managing city operations, reducing costs, and driving sustainable development.
Key Features of the Smart Cities KPI Dashboard
🏙️ Comprehensive City Performance Tracking
Track a wide range of KPIs related to infrastructure, transportation, waste management, energy consumption, public health, safety, and urban mobility. Get a holistic view of your city’s smart systems and performance.
⚡ Real-Time Monitoring & Analytics
Monitor real-time data on city performance, from traffic flows to energy usage. Use live data to identify trends, bottlenecks, and areas for improvement, ensuring your city operates efficiently and sustainably.
📈 Urban Mobility & Infrastructure Insights
Analyze the performance of city transportation systems, road usage, and public infrastructure. Track key metrics like traffic congestion, transit ridership, and road maintenance, and make data-driven decisions to improve mobility and infrastructure.
📅 Customizable KPIs for Smart Cities
Easily tailor the dashboard to your city’s unique smart initiatives. Track specific KPIs that align with your city’s goals, such as waste diversion rates, public health metrics, or renewable energy usage.
🖥️ Interactive & User-Friendly Interface
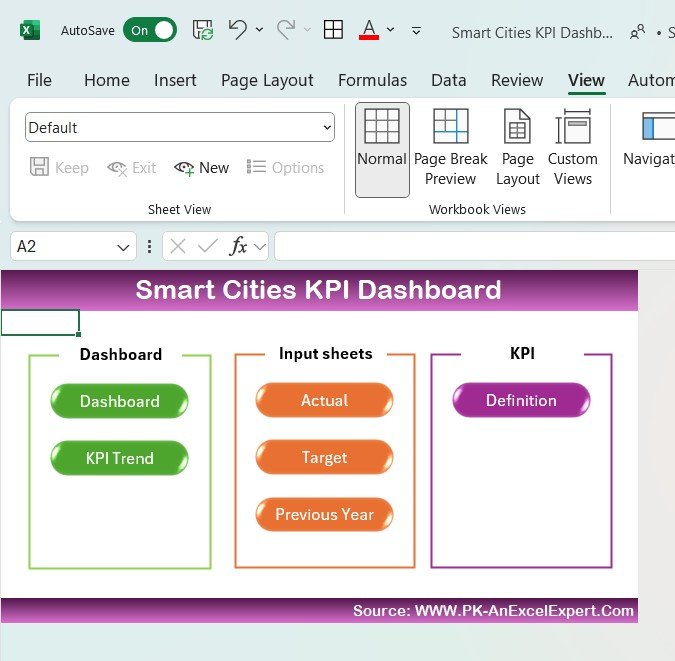
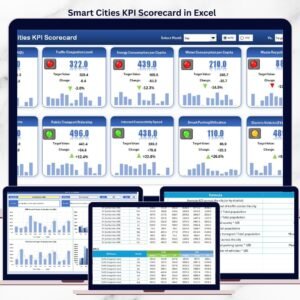
The Excel-based dashboard is intuitive and easy to navigate, offering interactive charts and filters that allow you to explore different aspects of your city’s performance and drill down into detailed data.
Why You’ll Love the Smart Cities KPI Dashboard
✅ Track Urban Performance Across Multiple Sectors
Monitor and analyze key metrics related to transportation, energy, safety, and public services. Get a comprehensive overview of your city’s smart operations to drive efficiency and sustainability.
✅ Optimize Resource Management
Track energy consumption, waste management, and public services to optimize resource allocation, reduce costs, and ensure a sustainable and eco-friendly city environment.
✅ Enhance Urban Mobility & Infrastructure
Use insights from traffic monitoring, public transportation performance, and road infrastructure to make informed decisions that improve mobility and reduce congestion.
✅ Improve Public Safety & Quality of Life
Monitor crime rates, emergency response times, and health metrics to improve public safety and ensure a higher quality of life for city residents.
✅ Make Data-Driven City Planning Decisions
Leverage real-time data to make informed decisions about urban planning, infrastructure development, and the implementation of smart technologies in your city.
What’s Inside the Smart Cities KPI Dashboard?
- City Infrastructure & Transportation Monitoring: Track traffic patterns, public transit performance, road usage, and infrastructure health.
- Energy Consumption & Sustainability Metrics: Monitor energy usage, renewable energy integration, and waste management performance.
- Public Health & Safety Tracking: Track crime rates, emergency services response times, and healthcare metrics to ensure the well-being of residents.
- Customizable KPIs: Adjust the dashboard to track specific KPIs relevant to your city’s smart initiatives, such as air quality or water management.
- Interactive Reporting: Use dynamic charts, filters, and slicers to analyze and track city performance over time.
How to Use the Smart Cities KPI Dashboard
1️⃣ Download the Template: Instantly access your Smart Cities KPI Dashboard.
2️⃣ Input City Data: Enter data related to city infrastructure, energy, transportation, safety, and public services.
3️⃣ Track & Monitor KPIs: Use the dashboard to monitor real-time performance of your city’s key initiatives and services.
4️⃣ Analyze & Optimize: Use insights from the dashboard to improve urban planning, resource management, and public services.
Who Can Benefit from the Smart Cities KPI Dashboard?
🔹 City Planners & Urban Developers
🔹 Government Officials & Decision-Makers
🔹 Transportation & Infrastructure Managers
🔹 Energy Providers & Environmental Planners
🔹 Smart City Project Managers & Consultants
🔹 Any Stakeholder Involved in Urban Development & Sustainability
Track, analyze, and optimize your city’s smart initiatives with the Smart Cities KPI Dashboard. Monitor key performance metrics, improve resource management, and drive sustainable development for a smarter, more efficient urban environment.
Click here to read the Detailed blog post
Visit our YouTube channel to learn step-by-step video tutorials
Youtube.com/@PKAnExcelExpert
















Reviews
There are no reviews yet.