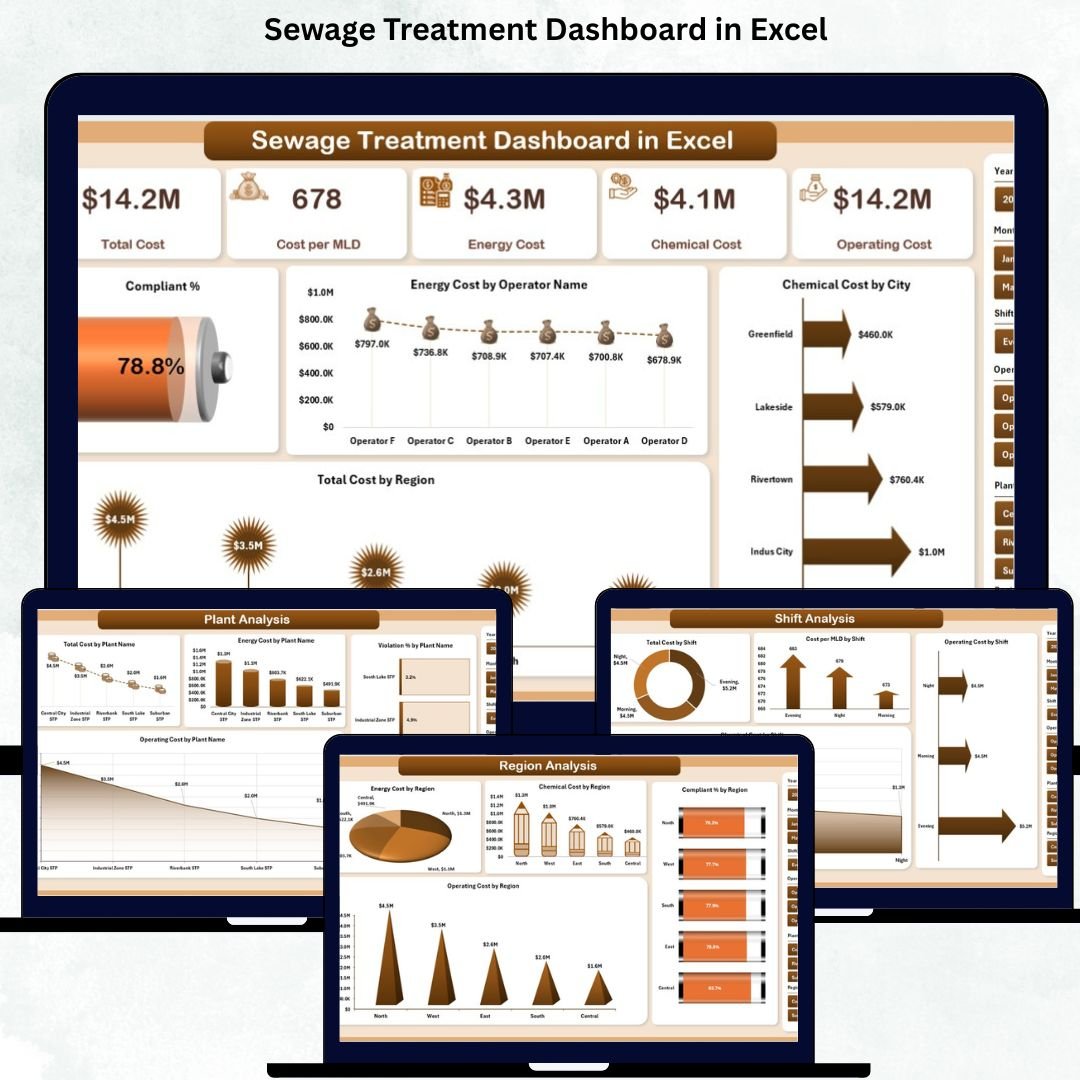
The Sewage Treatment Dashboard in Excel is a powerful, ready-to-use analytics tool designed to help teams monitor, analyze, and improve sewage treatment operations with complete clarity. Managing sewage plants involves tracking multiple KPIs—costs, compliance, violations, operator efficiency, chemical usage, energy consumption, plant performance, regional trends, shift insights, and month-wise variations. Manually managing all this data in scattered spreadsheets leads to inaccuracies, delays, and incomplete reporting.
This dashboard solves all these challenges. It transforms raw data into meaningful visuals, interactive charts, and smart performance indicators—right inside Excel. No technical expertise is needed. With automated updates, clean dashboard pages, and slicers for deep filtering, every team member gets real-time insights instantly. Whether you are a plant manager, operator, environmental officer, supervisor, or corporate leader, this dashboard gives you the complete visibility needed to make fast, confident, and cost-effective decisions.
✨ Key Features of the Sewage Treatment Dashboard in Excel
This dashboard is thoughtfully designed with five analytical pages, smart slicers, KPI cards, and prebuilt visuals that help you assess performance from every angle.
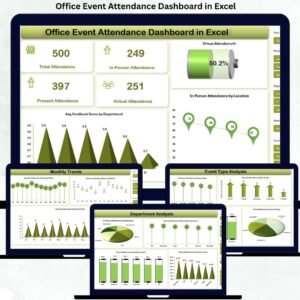
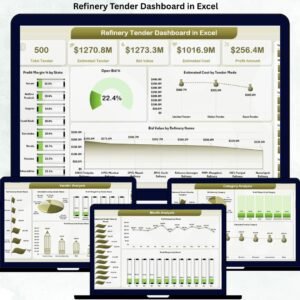
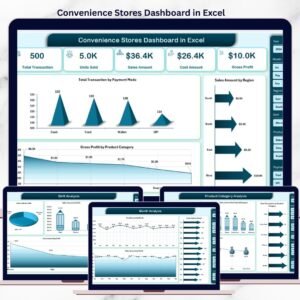
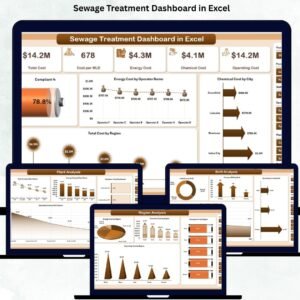
⭐ Overview Page – Your Entire Operation at a Glance
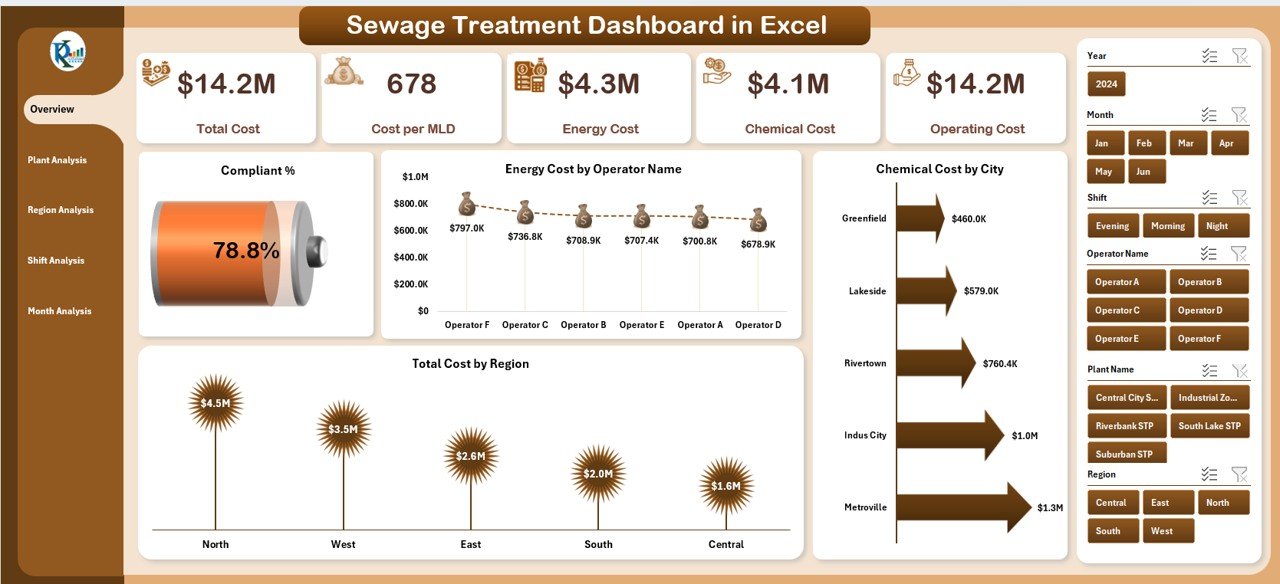
✔ Right-side slicer for Month, Region, Operator, and Plant Type
✔ 5 KPI cards for instant performance tracking
✔ 4 powerful charts showing:
-
Compliant %
-
Energy Cost by Operator Name
-
Chemical Cost by City
-
Total Cost by Region
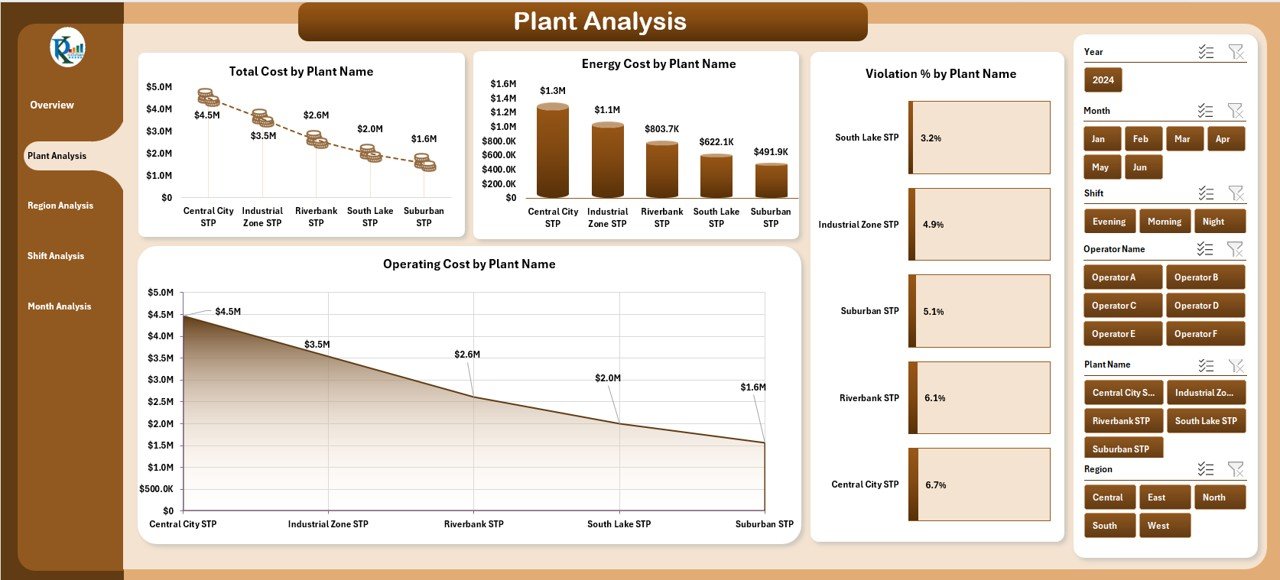
⭐ Plant Analysis Page – Identify High & Low Performing Plants
✔ Total Cost by Plant
✔ Energy Cost by Plant
✔ Violation % by Plant Type
✔ Operating Cost by Plant
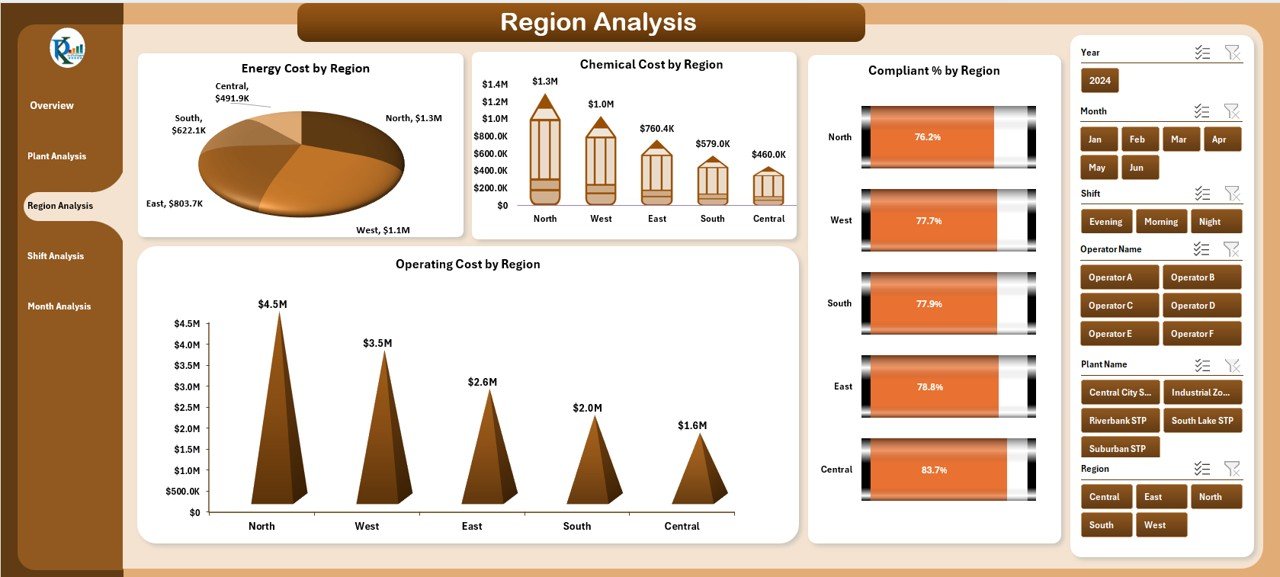
⭐ Region Analysis Page – Compare Regional Efficiency
✔ Energy Cost by Region
✔ Chemical Cost by Region
✔ Compliant % by Region
✔ Operating Cost by Region
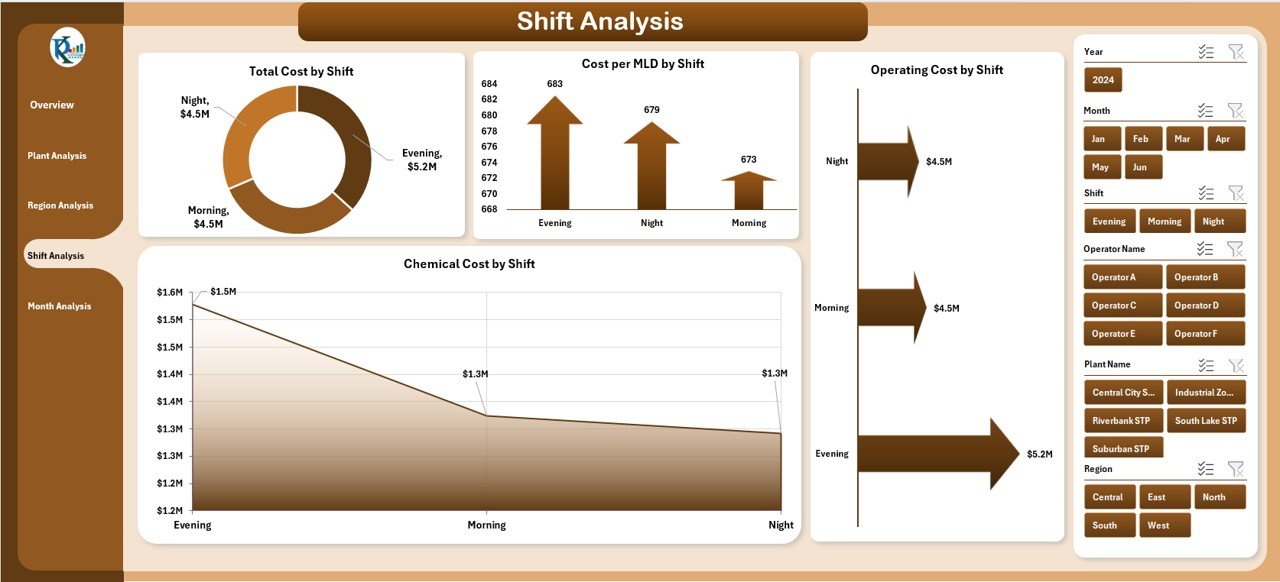
⭐ Shift Analysis Page – Understand Shift-Wise Performance
✔ Total Cost by Shift
✔ Cost Per MLD by Shift
✔ Operating Cost by Shift
✔ Chemical Cost by Shift
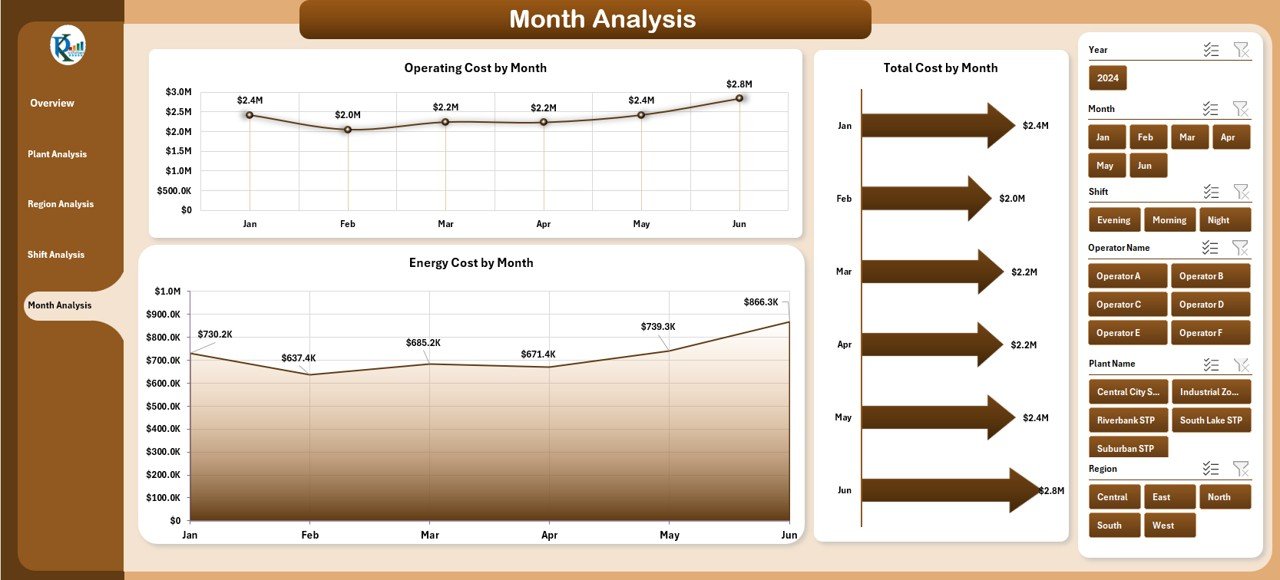
⭐ Month Analysis Page – Track Performance Trends Across the Year
✔ Total Cost by Month
✔ Operating Cost by Month
✔ Energy Cost by Month
📦 What’s Inside the Sewage Treatment Dashboard in Excel
Inside the Excel file, you get:
✨ Professionally designed dashboard pages
✨ Left-side page navigator for seamless movement
✨ Automated charts linked to your data
✨ KPI cards for quick decision-making
✨ Slicers for deep filtering
✨ Clean, structured Data Sheet for easy input
✨ Yearly, monthly, shift-wise, region-wise, and plant-wise performance visuals
Every component is crafted to make your operational review process faster and smarter.
🛠️ How to Use the Sewage Treatment Dashboard in Excel
Using this dashboard is extremely simple:
1️⃣ Open the Excel file and go to the Data Sheet
2️⃣ Enter plant data, compliance %, operating cost, energy & chemical usage
3️⃣ Switch to the dashboard pages
4️⃣ Use slicers to filter by Month, Region, Operator, Plant, or Shift
5️⃣ Analyze KPI cards, charts, and trends
6️⃣ Compare plants, regions, and shifts for performance improvements
7️⃣ Share insights with supervisors and leadership
The entire dashboard updates automatically—no formulas or manual reports required.
👥 Who Can Benefit from This Sewage Treatment Dashboard in Excel
This powerful reporting system is ideal for:
✔ Plant Managers – Track overall performance and reduce costs
✔ Operators – Understand efficiency levels and resource usage
✔ Environmental Teams – Monitor compliance and violation trends
✔ Supervisors – Compare shifts and identify improvement areas
✔ Finance Teams – Plan budgets using accurate cost insights
✔ Leadership Teams – Get a top-level view of plant operations
✔ Consultants – Provide data-driven recommendations
✔ Government/Compliance Officers – Track standards and regulatory KPIs
Whether you manage a single sewage plant or multiple locations, this dashboard delivers unmatched clarity and value.
### 📘 Click here to read the Detailed blog post
Visit our YouTube channel to learn step-by-step video tutorials
👉 Youtube.com/@PKAnExcelExpert


Reviews
There are no reviews yet.