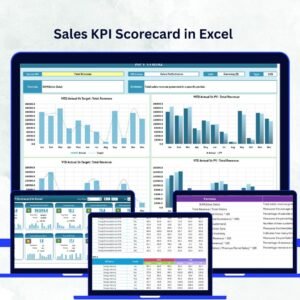
Seasonal sales can be unpredictable, but they also bring the biggest opportunities for growth. Whether you’re running a retail store, e-commerce platform, or wholesale business, demand often peaks during festivals, events, or seasonal changes. Without a proper system, businesses risk stockouts, overstocking, or missing out on profitable sales windows.
This is where the Seasonal Sales KPI Dashboard in Excel comes in. Designed with simplicity, accuracy, and flexibility in mind, this ready-to-use dashboard empowers business owners and managers to track key sales performance indicators (KPIs), compare results with targets, and plan for future demand with confidence.
✨ Key Features of Seasonal Sales KPI Dashboard in Excel
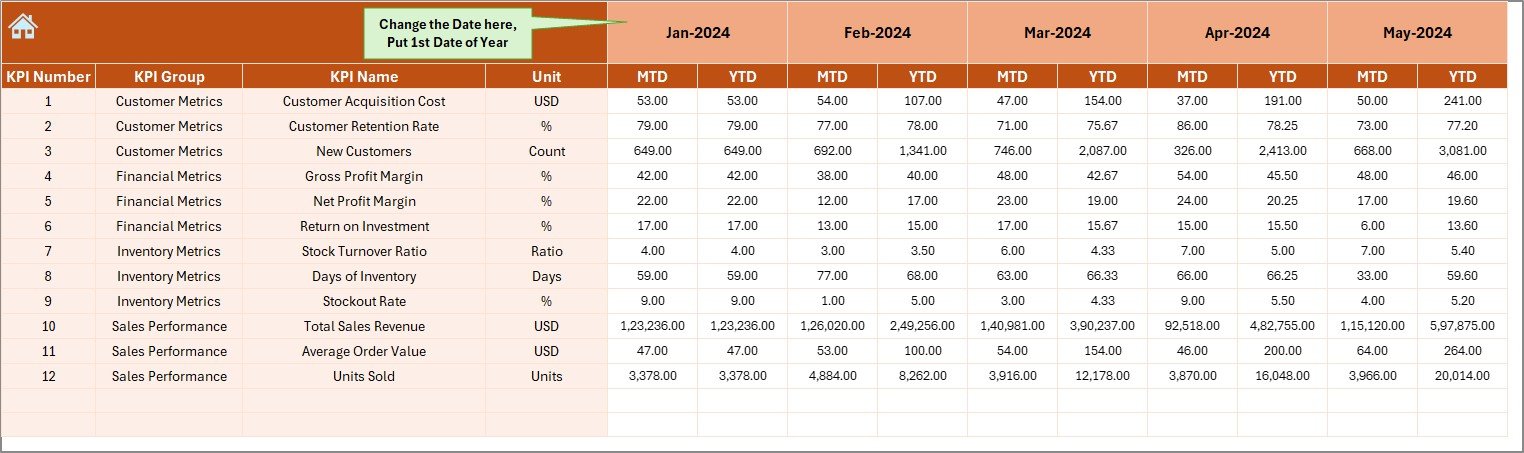
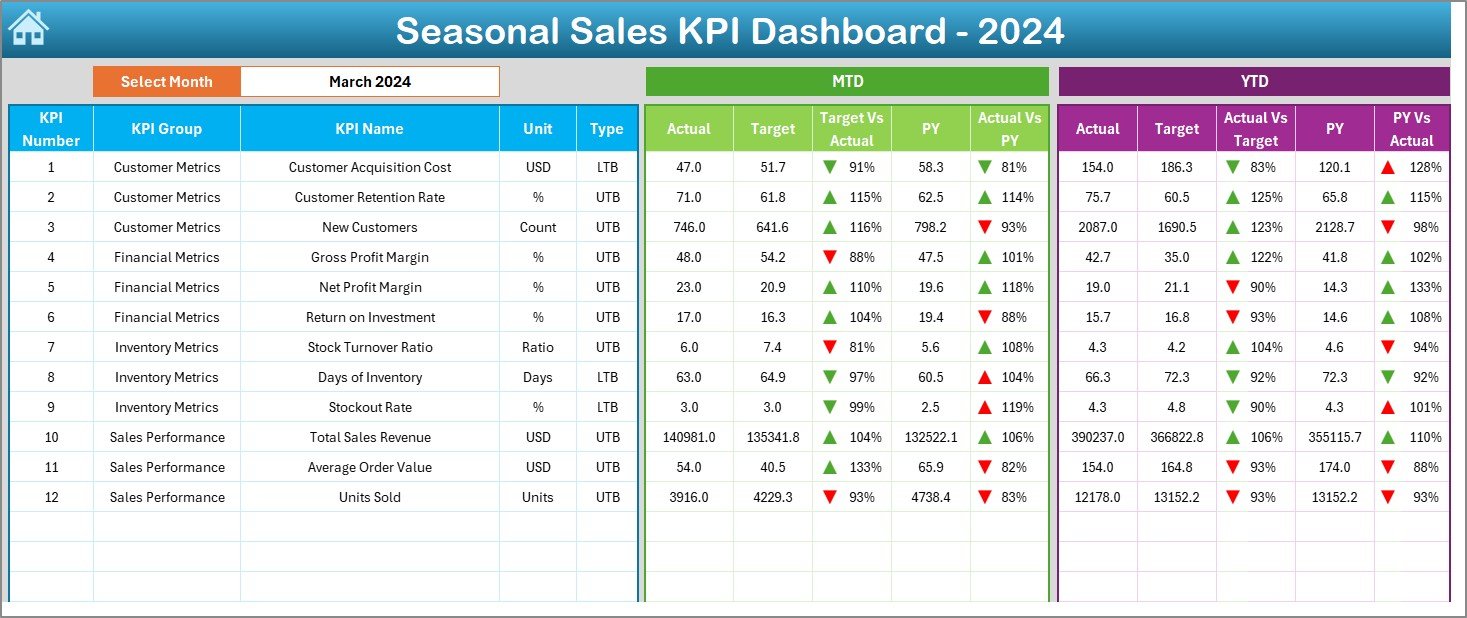
✅ All-in-One Sales Monitoring – Track MTD (Month-to-Date) and YTD (Year-to-Date) numbers in one place.
✅ Target vs Actual Comparison – Instantly see where you stand against business goals.
✅ Previous Year Benchmarking – Compare current sales with past performance for seasonal insights.
✅ Interactive Drop-Downs – Select months or KPIs from drop-down menus for real-time updates.
✅ Visual Indicators – Conditional formatting with arrows shows performance trends at a glance.
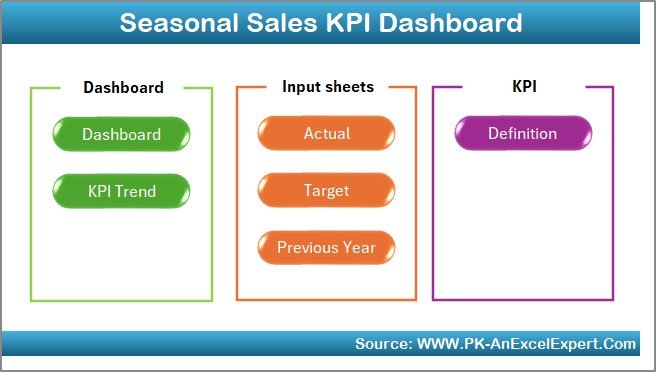
✅ Seven Organized Sheets – From Actual Data to KPI Definitions, every detail is structured.
✅ User-Friendly Design – No advanced Excel skills required; works with simple formulas and charts.
✅ Cost-Effective Tool – Get powerful analytics without investing in expensive software.
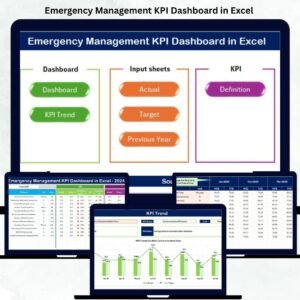
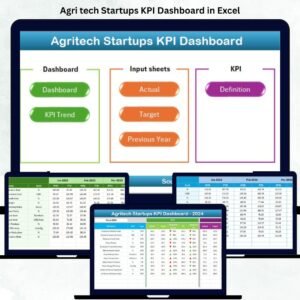
📂 What’s Inside the Seasonal Sales KPI Dashboard in Excel
The template is neatly structured into seven worksheets, each serving a unique role:
-
Home Sheet 🏠 – An index page with quick navigation buttons.
-
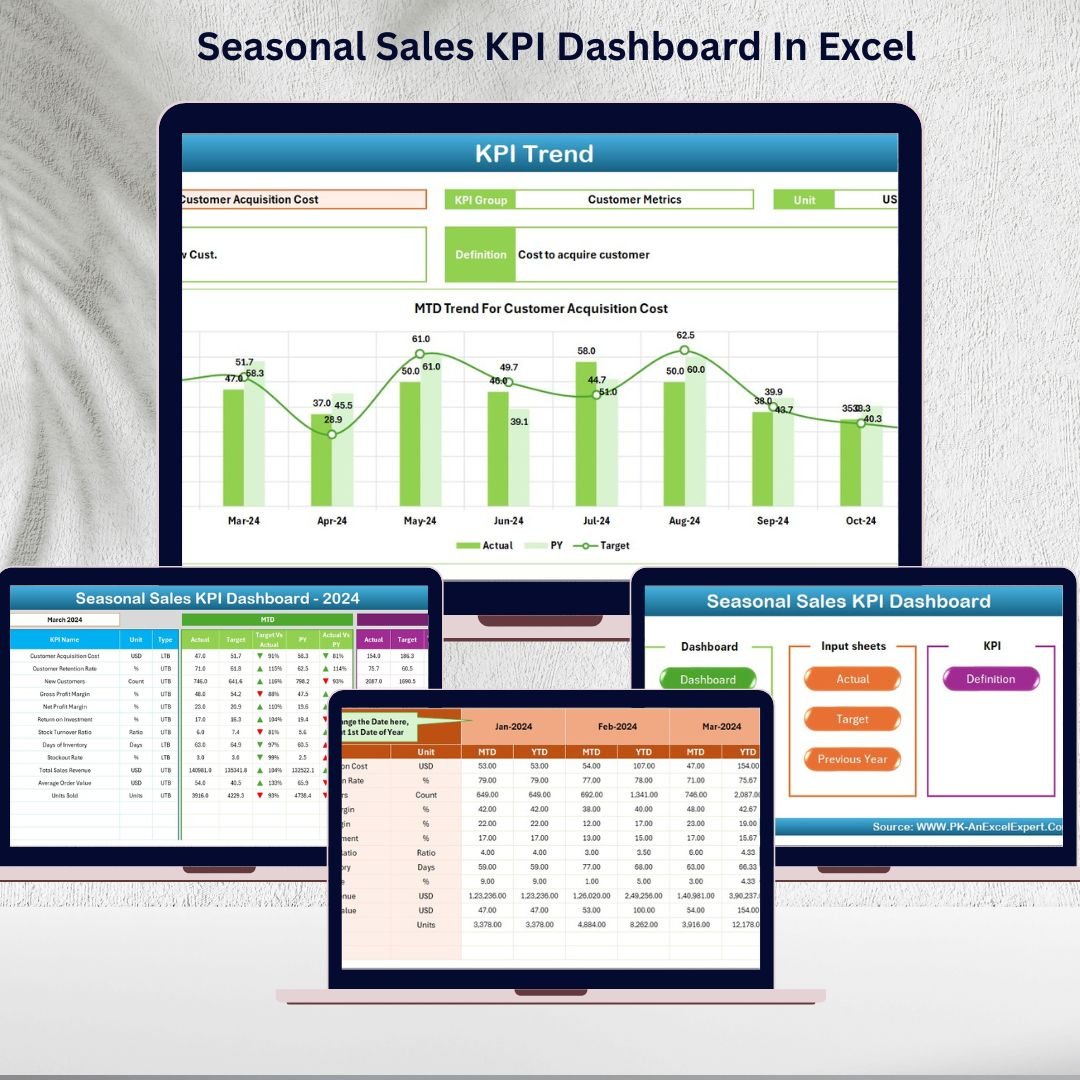
Dashboard Sheet 📊 – The main hub showing MTD & YTD actuals, targets, and PY comparisons.
-
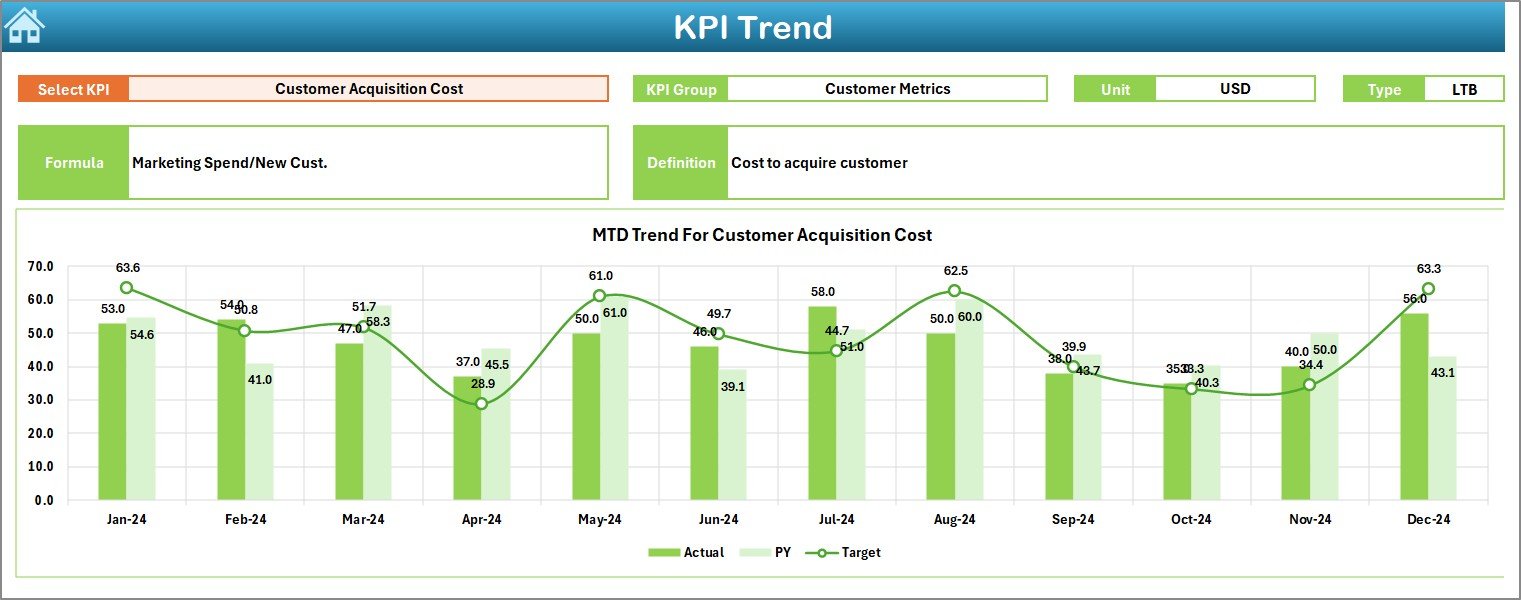
KPI Trend Sheet 📈 – Analyze KPI performance over time with dynamic charts.
-
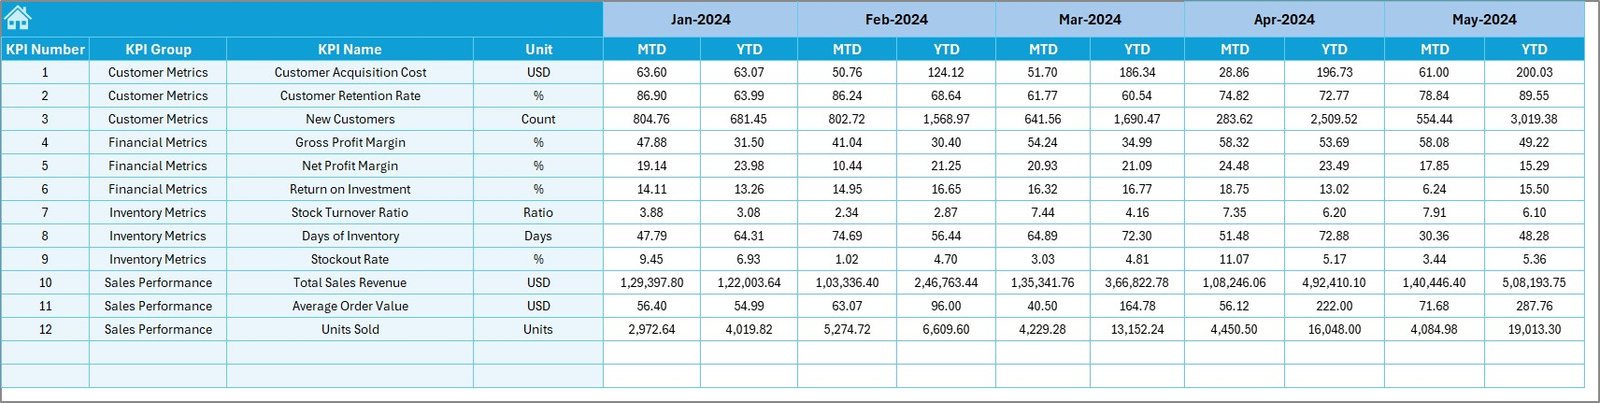
Actual Numbers Input Sheet ✍️ – Enter monthly sales data; updates flow through the dashboard.
-
Target Sheet 🎯 – Define seasonal targets aligned with peak or off-peak demand.
-
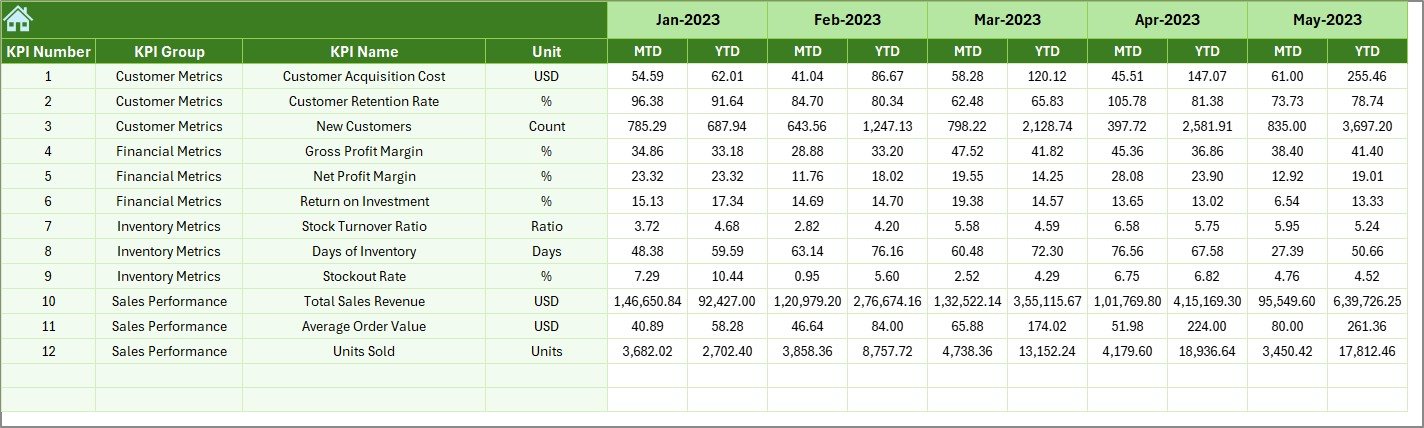
Previous Year Sheet 📅 – Store last year’s numbers for benchmarking.
-
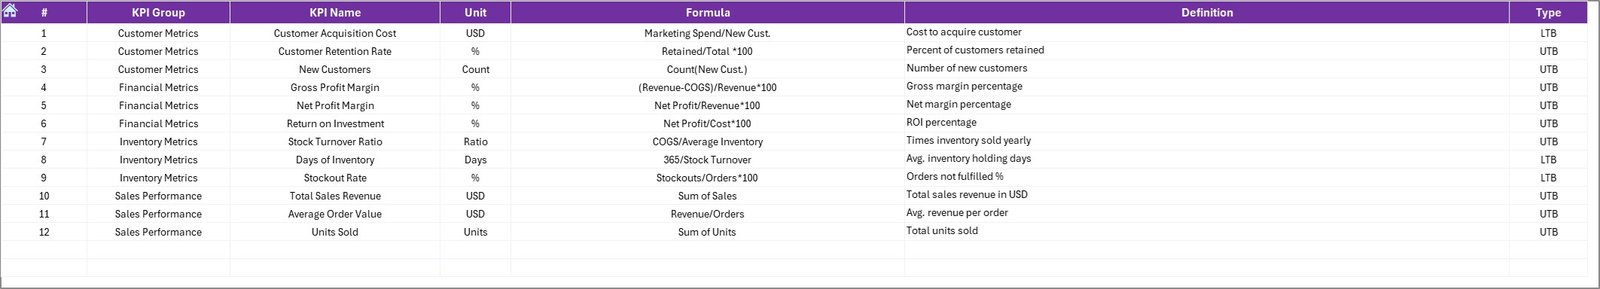
KPI Definition Sheet 📖 – Clear details of every KPI (Name, Group, Unit, Formula, Type).
🛠️ How to Use the Seasonal Sales KPI Dashboard in Excel
-
Input Sales Data – Enter your actual MTD & YTD numbers in the “Actual Numbers Input” sheet.
-
Set Targets – Add monthly goals in the “Target” sheet.
-
Compare with PY – Update the “Previous Year” sheet with last year’s data.
-
Track KPIs – View seasonal KPIs like revenue, margins, conversion rate, or order value.
-
Analyze Trends – Use the KPI Trend sheet to identify patterns and performance gaps.
-
Plan Better – Adjust strategies for upcoming peak seasons based on dashboard insights.
Within minutes, you’ll have a clear visual snapshot of your seasonal sales performance.
👩💼 Who Can Benefit from This Seasonal Sales KPI Dashboard in Excel
-
🛍️ Retail Business Owners – Track festive and event-driven demand.
-
🌐 E-commerce Analysts – Monitor online seasonal campaigns like Black Friday or Diwali.
-
📦 Wholesale Distributors – Manage stock turnover across peak and off-peak months.
-
📊 Sales Managers – Compare actuals against targets in real time.
-
💼 Financial Controllers – Align sales data with budgets and forecasts.
-
🏭 Consumer Goods Brands – Plan production based on seasonal trends.
Click here to read the Detailed blog post
Watch the step-by-step video tutorial:
Visit our YouTube channel to learn step-by-step video tutorials


Reviews
There are no reviews yet.