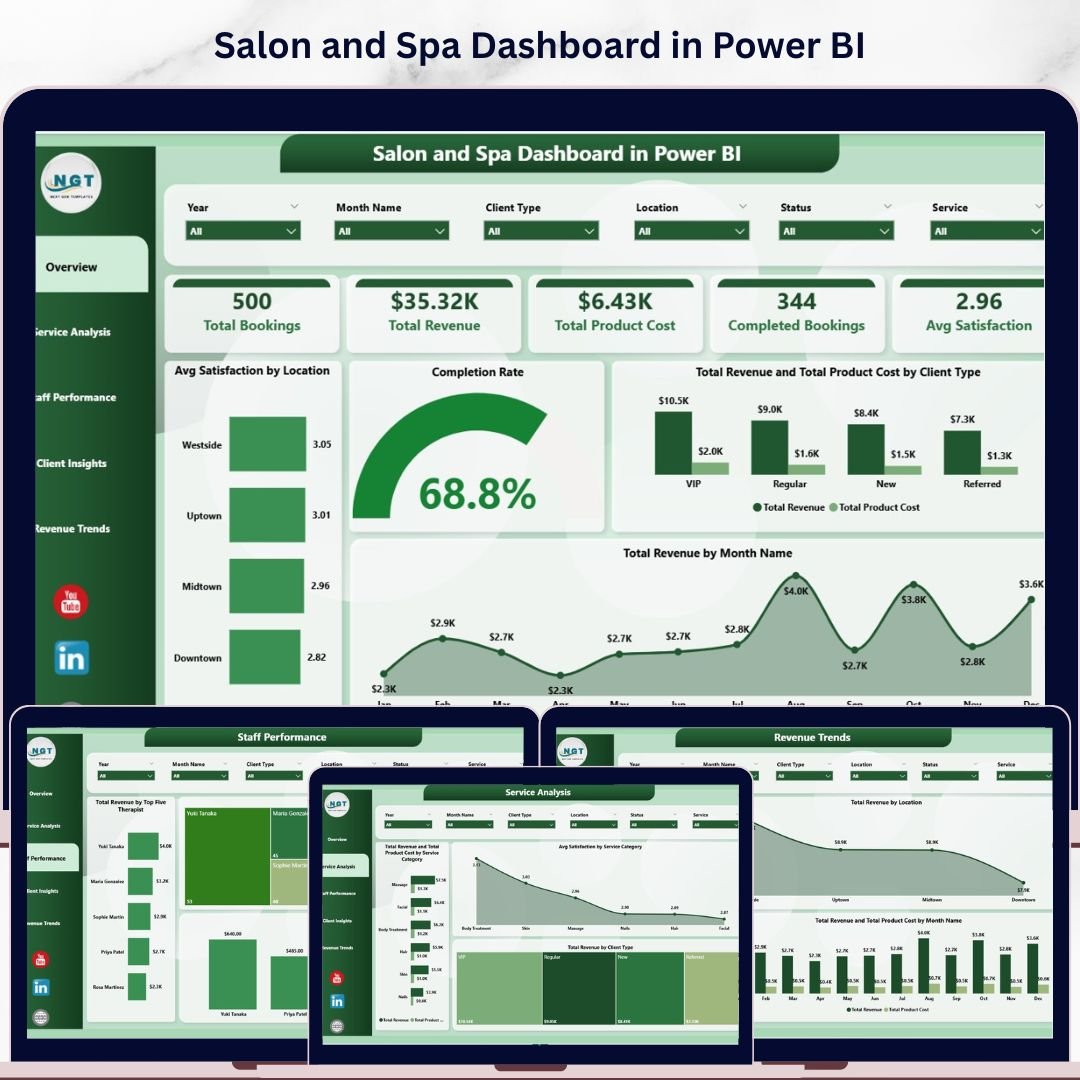
Salon and Spa Dashboard in Power BI is a professionally designed analytics template built for salon owners, spa managers, and beauty business operators who want to track revenue, monitor staff performance, analyze client behavior, and visualize service trends — all in one powerful Power BI report. This Power BI Dashboard includes 5 interactive analysis pages covering every critical aspect of your salon and spa operations, from high-level KPI overviews to deep-dive revenue breakdowns.
🔑 Key Features of Salon and Spa Dashboard in Power BI
This Salon and Spa Dashboard in Power BI delivers everything you need to run a data-driven beauty business. It includes 5 dedicated dashboard pages — Overview, Service Analysis, Staff Performance, Client Insights, and Revenue Trends — covering every operational metric that matters. The template tracks 5 core KPIs on the overview page: Total Bookings, Total Revenue, Total Product Cost, Completed Bookings, and Avg Satisfaction, giving you an instant snapshot of your salon’s health. Multiple interactive slicers let you filter the entire dashboard by date, location, service category, and more. Whether you manage a single spa location or a multi-branch beauty salon chain, this dashboard scales to meet your analytical needs. If you’re looking for an Excel version, check out the Salon and Spa Dashboard in Excel as well.
📦 What’s Inside the Salon and Spa Dashboard in Power BI
1 – Overview Page: This is your high-level command center. At the top, you’ll find KPI cards showing Total Bookings, Total Revenue, Total Product Cost, Completed Bookings, and Avg Satisfaction. Below, interactive charts display Avg Satisfaction by Location, Completion Rate, Total Revenue and Total Product Cost by Client Type, and Total Revenue by Month Name. Dynamic slicers let you filter the entire view instantly.
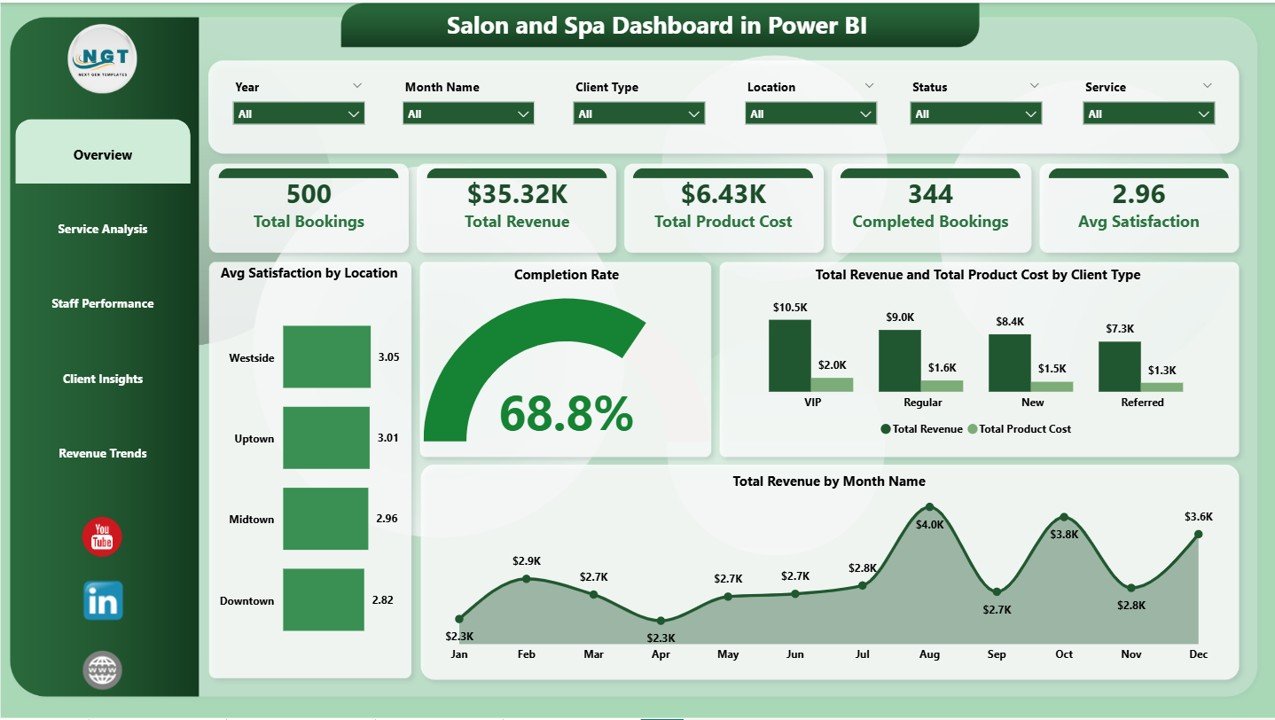 Salon and Spa Dashboard in Power BI
2 – Service Analysis: Dive deep into your service offerings with charts showing Total Revenue and Total Product Cost by Service Category, Avg Satisfaction by Service Category, and Total Revenue by Client Type. Understand which services generate the most revenue and which ones deliver the highest client satisfaction.
 Service Analysis
3 – Staff Performance: Evaluate your team with Top 5 Therapist rankings by Total Revenue, Total Bookings, and Total Tips. Instantly identify your highest-performing staff members and recognize who drives the most business. This page is essential for performance reviews and incentive planning.
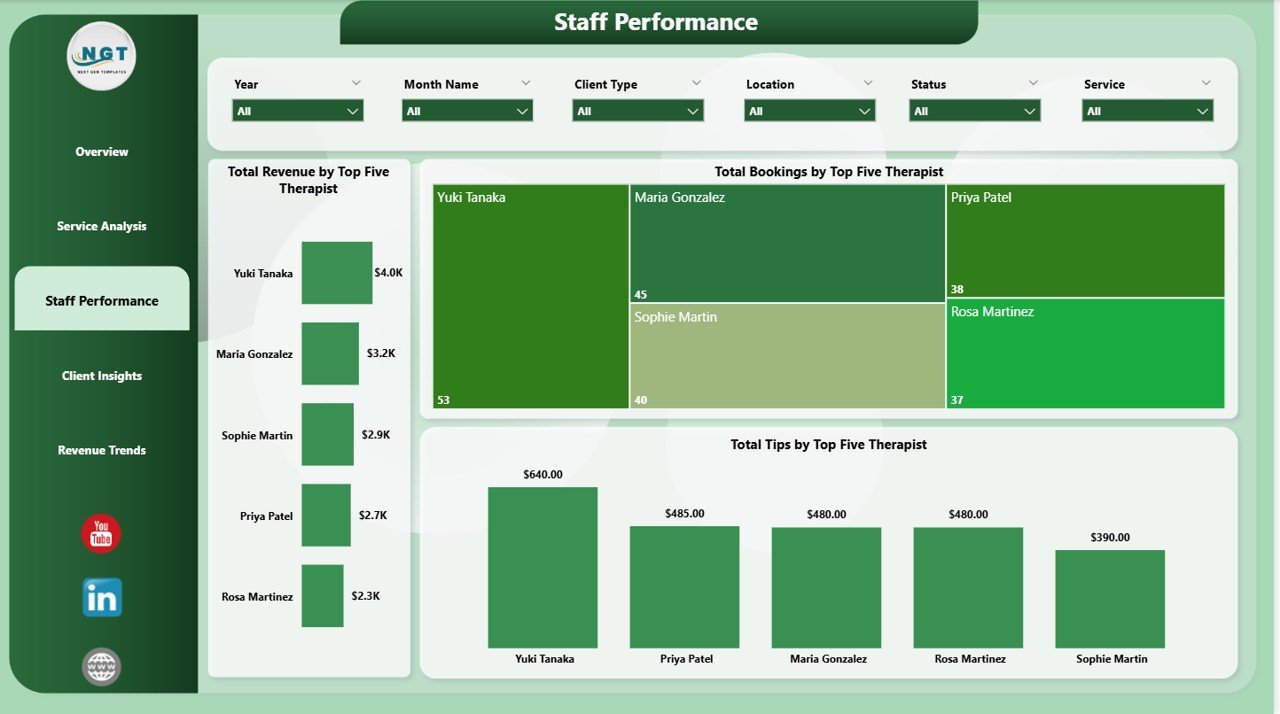 Staff Performance
4 – Client Insights: Understand your customers better with analysis of Avg Satisfaction by Client Type, Total Bookings by Booking Source, and Total Revenue by Booking Source. Discover which channels bring in the most clients and which customer segments drive the highest revenue. Also explore the Beauty Salons Dashboard in Power BI for even more beauty industry analytics.
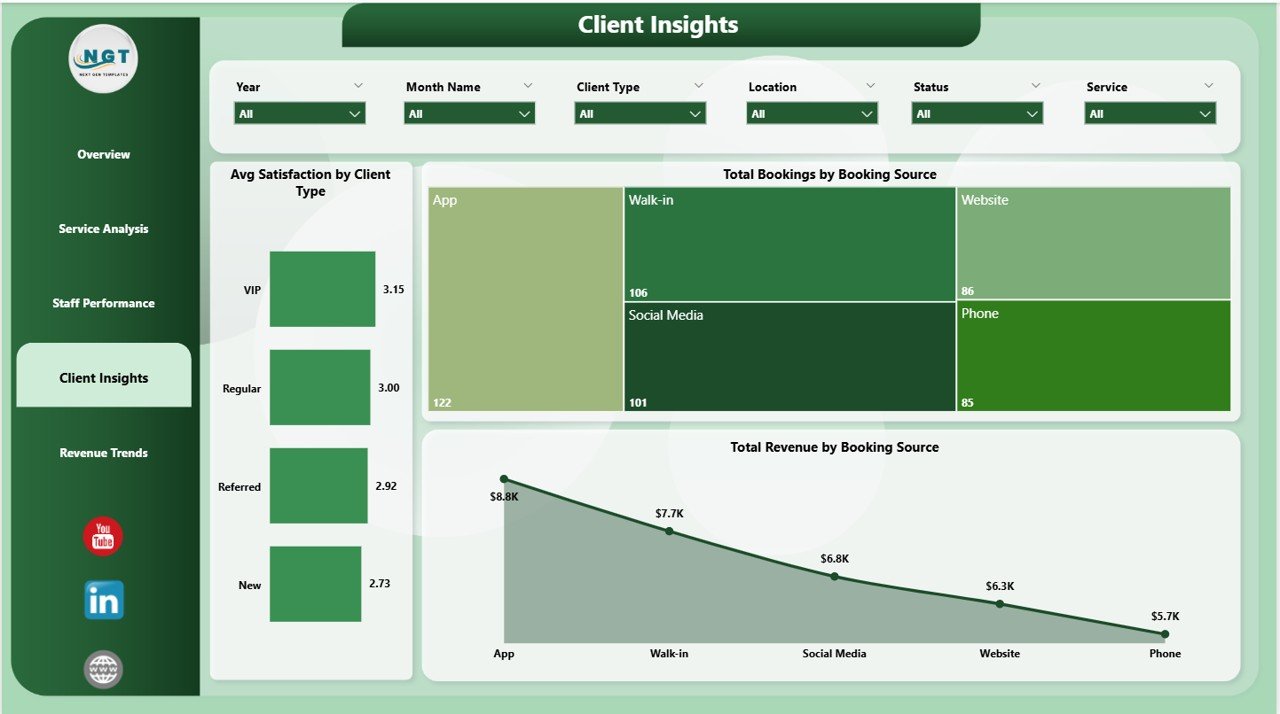 Client Insights
5 – Revenue Trends: Track your financial performance over time with Total Revenue by Payment Method, Total Revenue by Location, and Total Revenue and Total Product Cost by Month Name. This page helps you spot seasonal patterns, evaluate location profitability, and understand payment preferences.
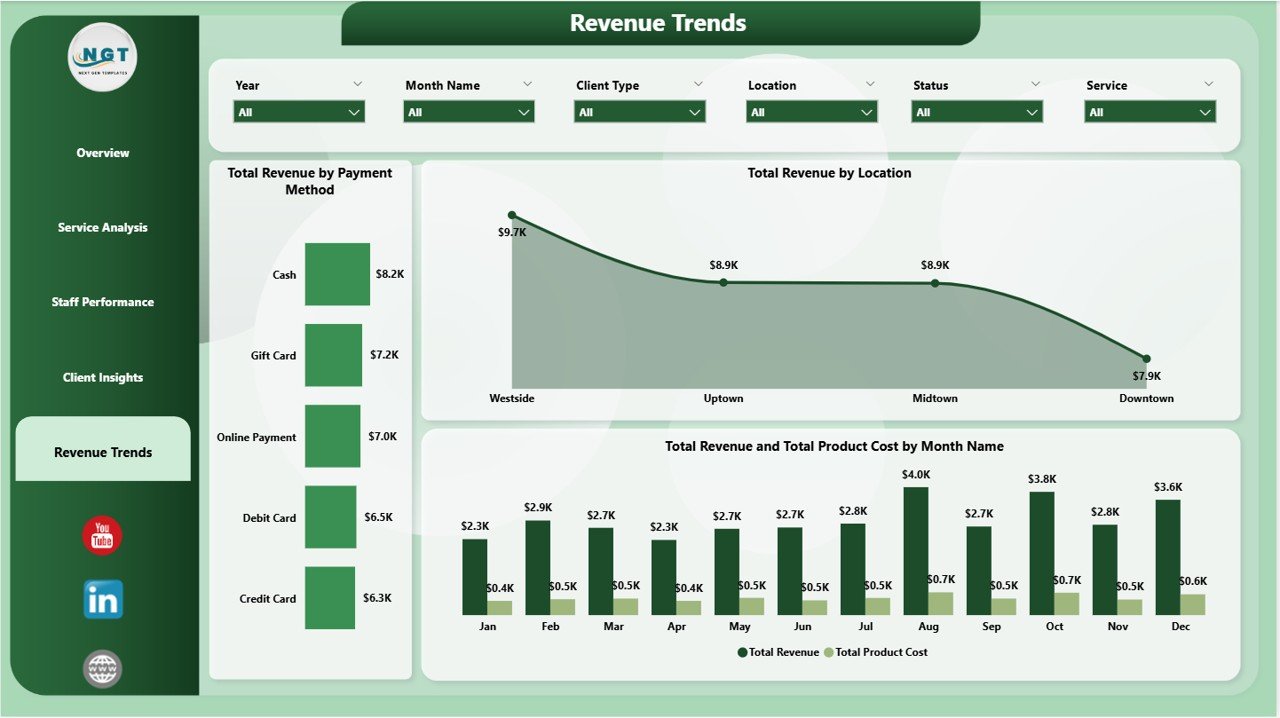 Revenue Trends
⚙️ How to Use the Salon and Spa Dashboard in Power BI
📌 Step 1: Download and unzip the file after purchase
📌 Step 2: Open the .pbix file in Power BI Desktop (free download from Microsoft Learn)
📌 Step 3: Review the sample data to understand the data structure
📌 Step 4: Replace the sample data with your salon’s actual booking, revenue, and staff data
📌 Step 5: All charts, KPIs, and visuals refresh automatically
📌 Step 6: Use slicers and filters to explore your data by location, date, service, and client type
👥 Who Can Benefit from This Salon and Spa Dashboard in Power BI
📌 Salon Owners & Spa Managers tracking revenue and bookings
📌 Beauty Business Chains monitoring multi-location performance
📌 Spa Directors analyzing client satisfaction and service trends
📌 Wellness Center Operators evaluating staff productivity and tips
📌 Data Analysts building reports for the beauty and wellness industry
📌 Business Consultants advising salon and spa clients
❓ Frequently Asked Questions
What KPIs does the Salon and Spa Dashboard in Power BI track?
The Salon and Spa Dashboard in Power BI tracks 5 key performance indicators: Total Bookings, Total Revenue, Total Product Cost, Completed Bookings, and Average Satisfaction. These KPIs are displayed as interactive cards on the Overview page and can be filtered using slicers.
Can I use this dashboard for multiple salon locations?
Yes. The dashboard includes multi-location analytics with charts that compare Avg Satisfaction by Location and Total Revenue by Location, making it ideal for salon chains and multi-branch spa businesses.
Do I need a Power BI license to use this template?
You only need Power BI Desktop, which is free to download from Microsoft. No paid Power BI Pro or Premium license is required to open and use the .pbix file locally.
How do I replace the sample data with my own salon data?
Open the .pbix file in Power BI Desktop, navigate to the data model, and replace the sample tables with your own data source (Excel, CSV, database, or API). All visuals and KPIs will refresh automatically once your data is connected.
What is the best Power BI dashboard for a salon business?
The Salon and Spa Dashboard in Power BI is one of the best options for beauty businesses. It covers 5 analytical pages including revenue analysis, staff performance, client insights, and service category breakdowns — all in a single, ready-to-use .pbix file.
🔗 Explore Related Templates
📌 Salon and Spa Dashboard in Excel – The Excel version of this salon analytics dashboard
📌 Beauty Salons Dashboard in Power BI – Another Power BI dashboard for the beauty industry
📌 Beauty Salons Dashboard in Excel – Excel dashboard for salon analytics and reporting
📖 Click here to read the Detailed Blog Post
🎥 Visit our YouTube channel to learn step-by-step video tutorials
👉 YouTube.com/@NextGenTemplates
Watch the step-by-step video tutorial:
YouTube


Reviews
There are no reviews yet.