


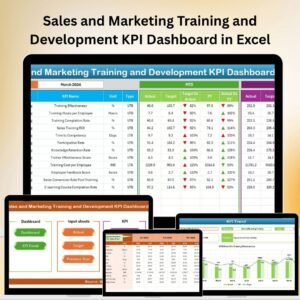
The Sales and Marketing Training and Development KPI Dashboard in Excel is a comprehensive tool designed to help businesses and training departments effectively track and measure the performance of their sales and marketing training programs. This Excel-based dashboard provides valuable insights into key performance indicators (KPIs) such as employee training progress, skill acquisition, performance improvements, and overall training effectiveness.
With this dashboard, managers and team leaders can monitor the success of their training initiatives, identify areas where additional support is needed, and ensure that sales and marketing teams are equipped with the necessary skills to perform at their best. The dashboard’s easy-to-use interface allows you to track multiple training programs simultaneously, assess employee progress, and optimize training strategies for improved results.
Key Features of the Sales and Marketing Training and Development KPI Dashboard in Excel
📊 Training Progress Tracking
Monitor the progress of each employee or team in your training programs. Track completed modules, certifications earned, and milestones reached, ensuring that every participant is on track to complete their training successfully.
📈 Skill Acquisition Monitoring
Track the skills acquired through training sessions. Use this KPI to identify areas of strength and areas where additional development may be required for your sales and marketing teams.
🧑🏫 Training Effectiveness Analysis
Evaluate the effectiveness of each training program by comparing pre- and post-training performance metrics. Assess whether the training has led to improved sales, marketing performance, and overall business results.
📅 Time-Based Training Performance
Analyze training performance over different time periods (daily, weekly, monthly). This feature helps track long-term improvements and identify trends in training effectiveness.
📉 Employee Performance Improvements
Monitor individual employee performance before and after training. Track key metrics such as sales conversions, marketing reach, and customer satisfaction to measure the impact of training on job performance.
⚙️ Customizable KPIs & Metrics
Customize the dashboard to track the specific KPIs that are most relevant to your sales and marketing training programs. Include metrics such as employee engagement, knowledge retention, or ROI from training investments.
Why You’ll Love the Sales and Marketing Training and Development KPI Dashboard in Excel

✅ Comprehensive Training Insights
Track all key training metrics in one place. Understand which programs are most effective and where adjustments are needed to improve training outcomes.
✅ Improve Training ROI
Measure the return on investment (ROI) of your sales and marketing training programs. Evaluate whether the training is contributing to business growth by improving performance and driving results.
✅ Personalized Employee Tracking
Monitor individual employee progress and identify strengths and weaknesses. Customize the dashboard to track each employee’s training journey and performance improvements.
✅ Boost Sales & Marketing Performance
Ensure that your sales and marketing teams are constantly improving by monitoring their training progress and evaluating the impact of training on performance metrics.
✅ User-Friendly & Customizable
Easily customize the dashboard to meet your organization’s unique training needs. Tailor the KPIs and reporting to match your specific business goals and training objectives.
What’s Inside the Sales and Marketing Training and Development KPI Dashboard in Excel?
-
Training Progress Tracking: Monitor completion rates, milestones, and certifications.
-
Skill Acquisition Monitoring: Track skills gained through training.
-
Training Effectiveness Analysis: Assess the impact of training on performance metrics.
-
Employee Performance Monitoring: Track sales, marketing performance, and KPIs before and after training.
-
Time-Based Performance Analysis: Monitor training progress and results over time.
-
Customizable KPIs: Track any KPIs relevant to your organization’s training programs.
How to Use the Sales and Marketing Training and Development KPI Dashboard in Excel
1️⃣ Download the Template: Get instant access to the Sales and Marketing Training and Development KPI Dashboard in Excel.
2️⃣ Input Employee & Training Data: Enter employee training details, progress, and performance metrics.
3️⃣ Track Key KPIs: Monitor training completion, skill development, and employee performance.
4️⃣ Analyze Training Effectiveness: Assess the impact of training on key sales and marketing KPIs.
5️⃣ Optimize Training Programs: Use insights from the dashboard to refine training strategies and improve results.
Who Can Benefit from the Sales and Marketing Training and Development KPI Dashboard in Excel?
🔹 Sales & Marketing Managers
🔹 HR & Training Departments
🔹 Learning & Development Teams
🔹 Business Owners & Executives
🔹 E-learning Platforms & Training Providers
🔹 Small & Medium Enterprises (SMBs)
🔹 Corporations with Sales & Marketing Teams
Optimize your sales and marketing training programs with the Sales and Marketing Training and Development KPI Dashboard in Excel. Track employee progress, assess training effectiveness, and improve team performance with data-driven insights.
Click here to read the Detailed blog post
Visit our YouTube channel to learn step-by-step video tutorials
Youtube.com/@PKAnExcelExpert


Reviews
There are no reviews yet.