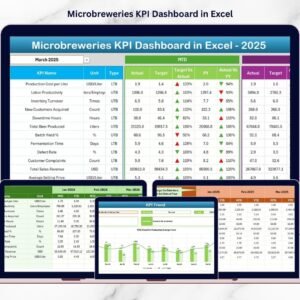
The robotics industry is evolving faster than ever across manufacturing, automation, logistics, healthcare, and smart factories 🤖. As competition intensifies, robotics companies must track performance accurately to stay ahead. However, when KPIs are managed using scattered Excel files or manual reports, teams lose visibility, alignment, and control. That is why the Robotics Industry KPI Scorecard in Excel is an essential performance management tool for modern robotics organizations.
This ready-to-use Excel KPI scorecard helps you monitor, analyze, and compare key robotics KPIs in one centralized and structured file. Instead of spending hours calculating metrics manually, this scorecard automatically tracks Month-to-Date (MTD) and Year-to-Date (YTD) performance, enabling faster and smarter decision-making 📊.
Built entirely in Microsoft Excel, this KPI scorecard is easy to use, highly flexible, and cost-effective—making it ideal for both growing robotics startups and established automation companies.
✅ Key Features of Robotics Industry KPI Scorecard in Excel
The Robotics Industry KPI Scorecard in Excel is designed to deliver clear insights with minimal effort 🚀.
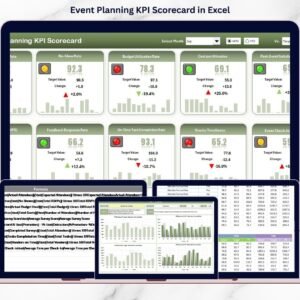
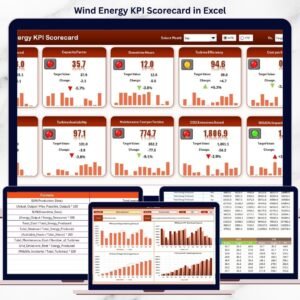
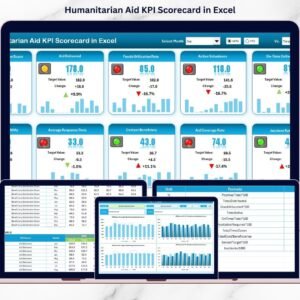
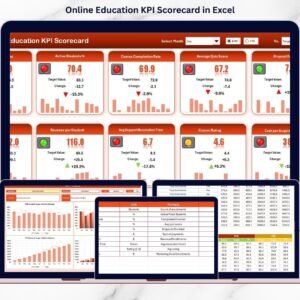
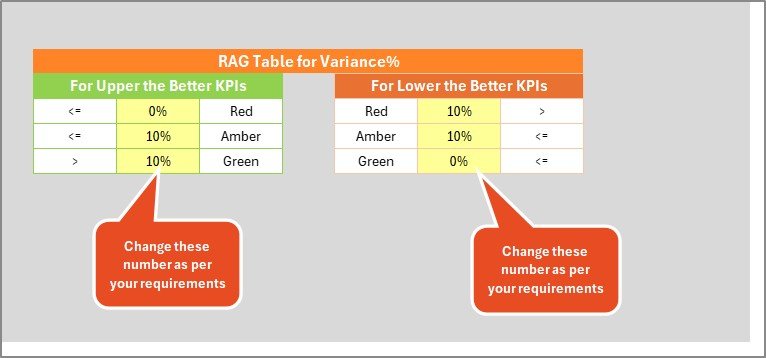
It provides a centralized scorecard view where users can compare Actual vs Target KPI values instantly. Color-coded indicators and conditional formatting highlight whether targets are met or missed, allowing quick performance reviews.
The scorecard supports:
-
MTD and YTD performance tracking
-
KPI group-wise analysis
-
Unit-based KPI measurement
-
Visual performance indicators
With dropdown-based period selection, users can easily switch between months and analysis types. As soon as data is updated, all calculations and visuals refresh automatically saving time and reducing errors.
📦 What’s Inside the Robotics Industry KPI Scorecard in Excel
This product includes four professionally structured worksheets, each serving a specific purpose:
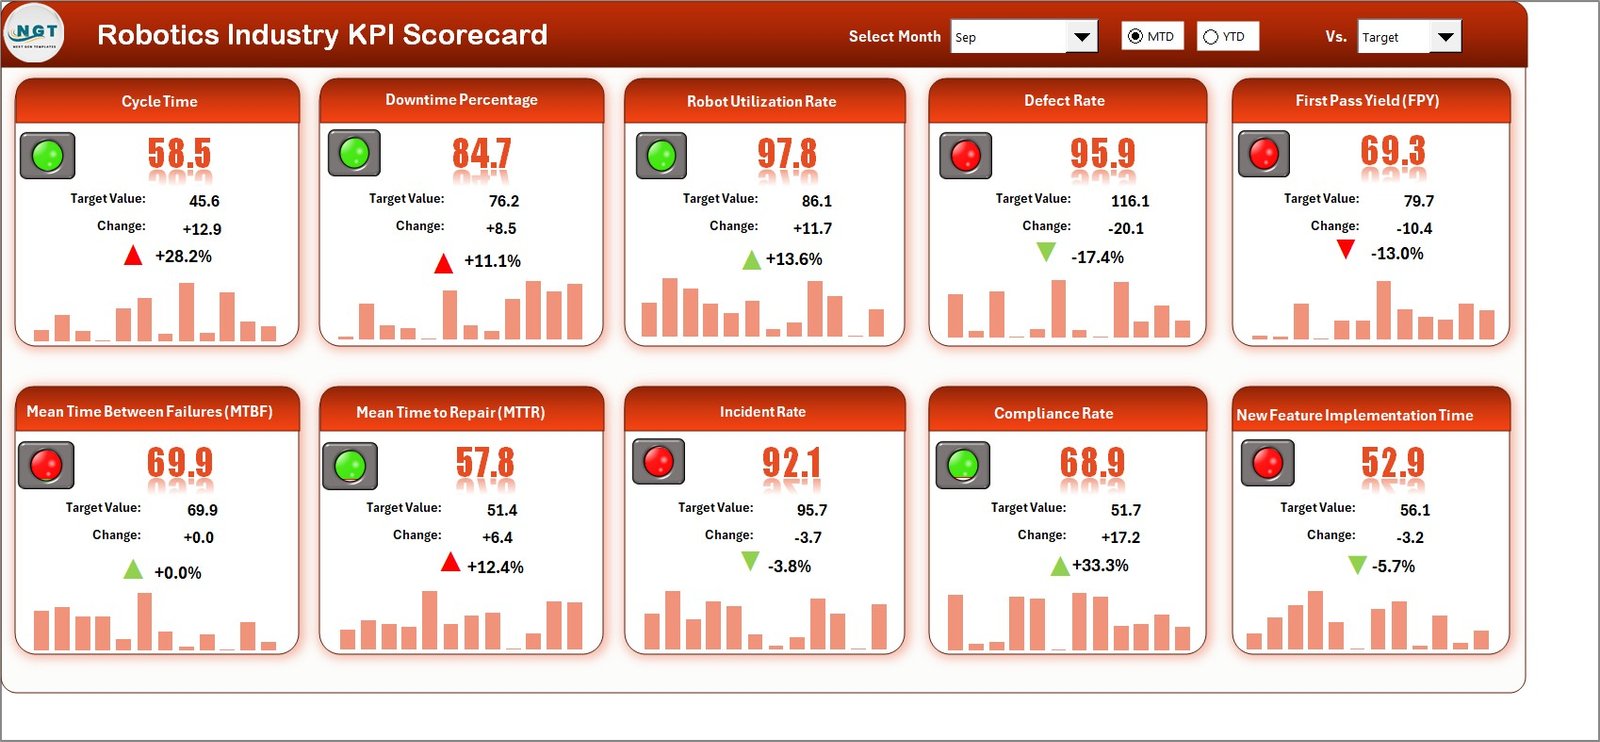
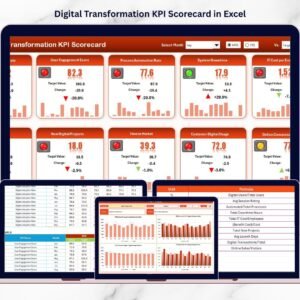
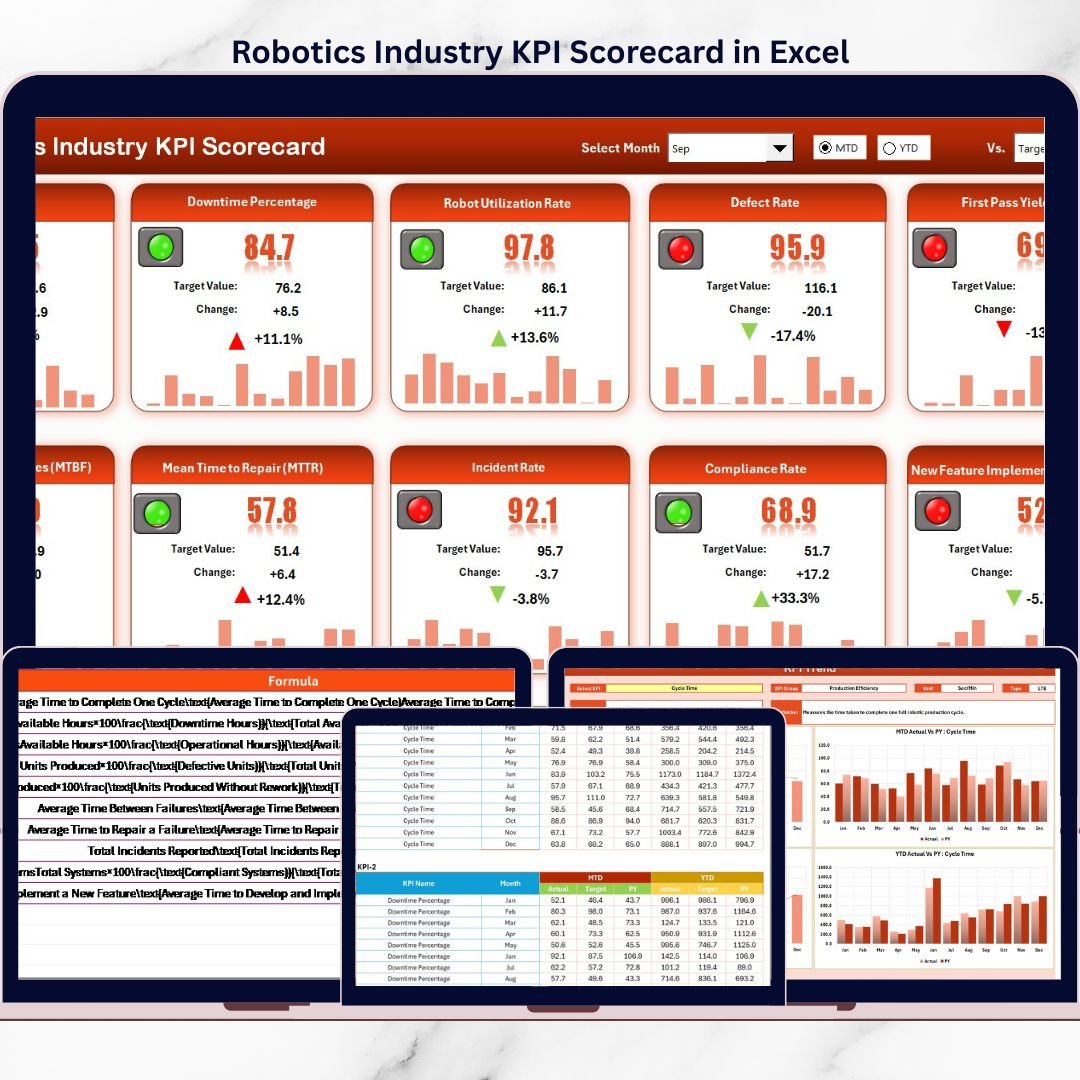
1️⃣ Scorecard Sheet
This is the main dashboard view showing all KPIs in one place. It displays:
-
KPI Name and Group
-
Unit of measurement
-
Actual vs Target values
-
MTD and YTD results
-
Visual indicators for performance status
Because everything appears on a single screen, management reviews become fast and effective.
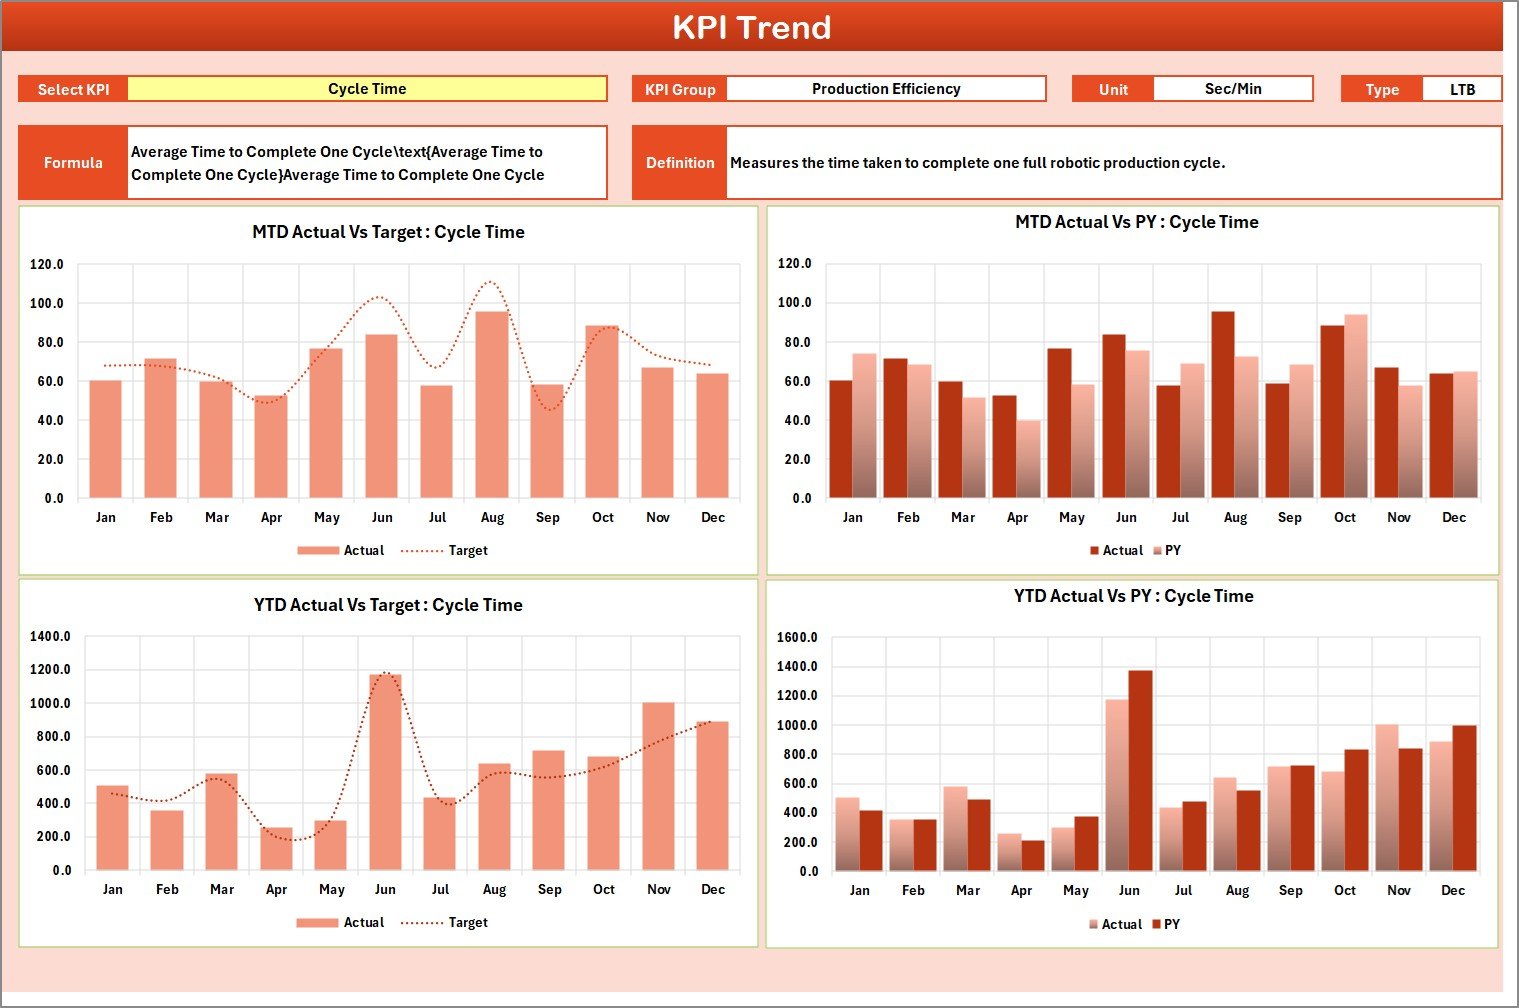
2️⃣ KPI Trend Sheet
This sheet focuses on trend analysis 📈. Users select a KPI from a dropdown, and the sheet automatically updates to show:
-
KPI definition and formula
-
KPI type (LTB or UTB)
-
MTD, YTD, and Previous Year trends
Trend charts help teams understand performance patterns over time.
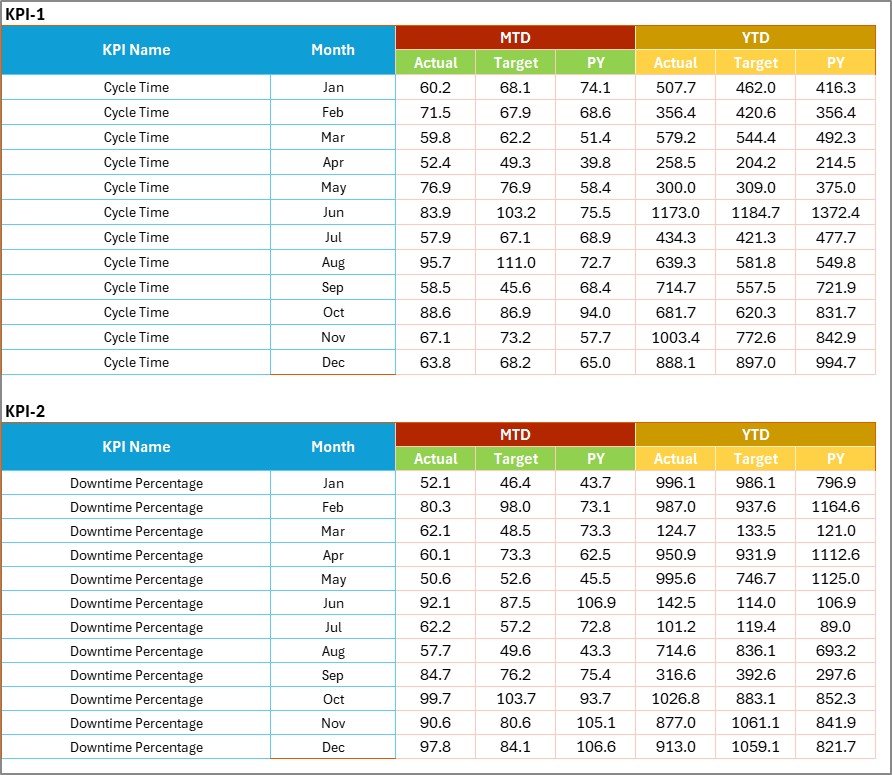
3️⃣ Input Data Sheet
This sheet acts as the data foundation. Users enter:
-
Actual KPI values
-
Target values
-
Time-based data
Structured data entry ensures accuracy and consistency across the scorecard.
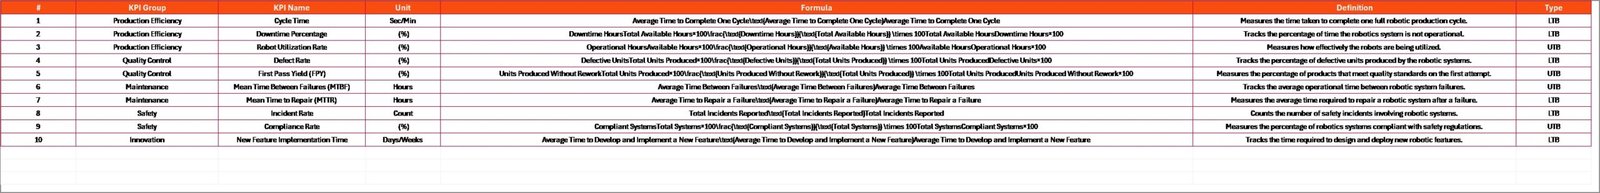
4️⃣ KPI Definition Sheet
This sheet stores:
-
KPI names
-
KPI groups
-
Units
-
Formulas
-
Definitions
It ensures clarity, consistency, and proper KPI interpretation across teams.
🛠️ How to Use the Robotics Industry KPI Scorecard in Excel
Using the scorecard is simple and intuitive 👍.
First, enter actual and target KPI values in the Input Data sheet.
Next, select the month and analysis type from dropdowns in the Scorecard sheet.
Then, review Actual vs Target comparisons and visual indicators.
Finally, analyze performance trends using the KPI Trend sheet.
Because everything is automated, managers always get up-to-date insights without manual calculations.
👥 Who Can Benefit from This Robotics Industry KPI Scorecard
This KPI scorecard is ideal for:
-
Robotics Operations Managers
-
Manufacturing Managers
-
Automation Engineers
-
Quality Assurance Teams
-
Plant Heads
-
Business & Performance Analysts
It works perfectly for robotics manufacturing units, automation solution providers, and smart factory environments.
🔗 Click here to read the Detailed blog post
🎥 Visit our YouTube channel to learn step-by-step video tutorials
👉 https://www.youtube.com/@PKAnExcelExpert