The Risk Management KPI Dashboard in Power BI is an essential tool designed for organizations to identify, monitor, and manage potential risks. Whether you’re working in finance, operations, or project management, this Power BI dashboard provides a comprehensive overview of risk-related KPIs, helping you make informed decisions and mitigate threats before they become critical.
With interactive visualizations, real-time data tracking, and customizable features, this dashboard allows you to track key risk factors, evaluate risk impact, and implement strategies to minimize potential harm to your organization. Gain deeper insights into your business’s risk landscape and stay proactive in addressing threats to ensure operational stability.
Key Features of the Risk Management KPI Dashboard in Power BI
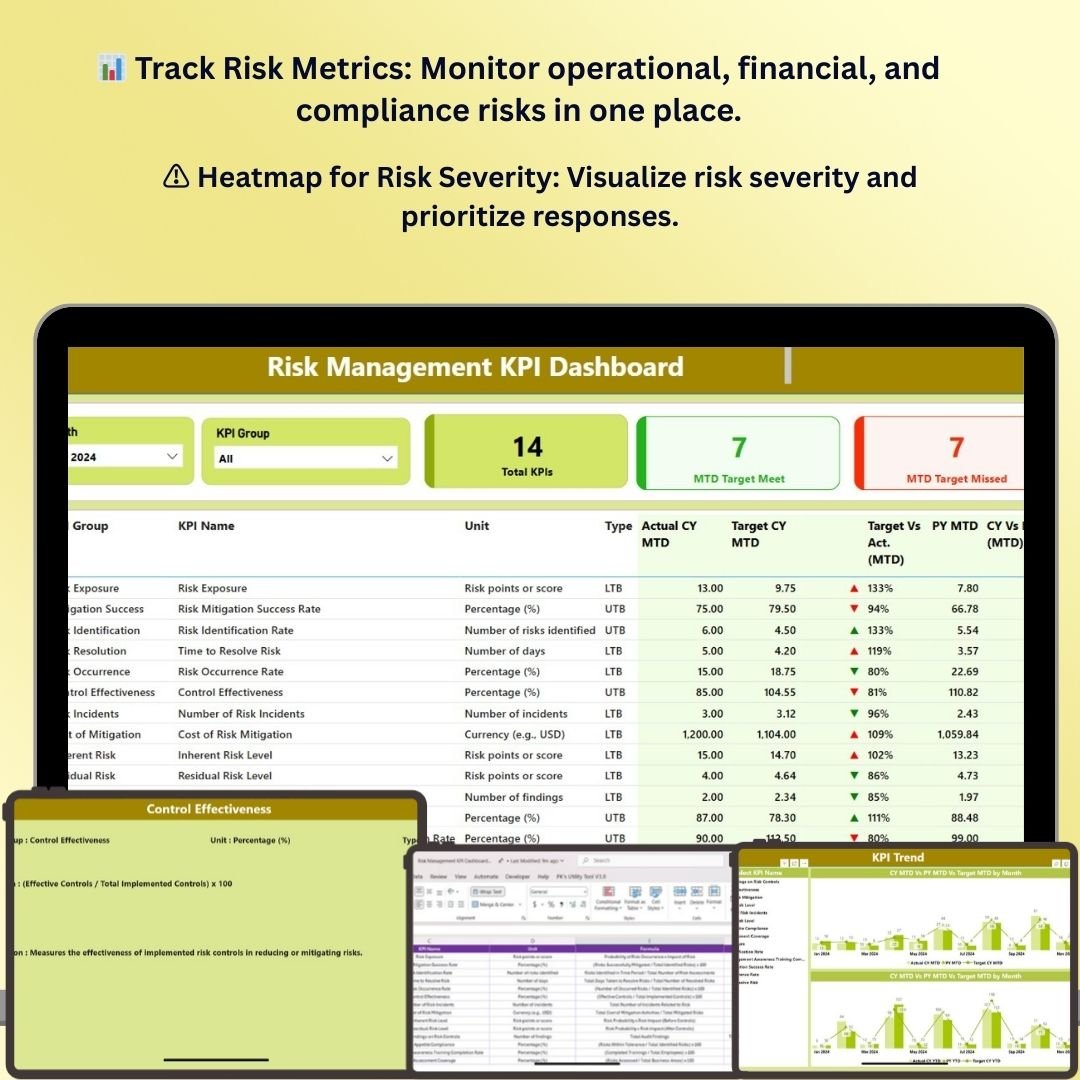
📊 Comprehensive Risk Tracking
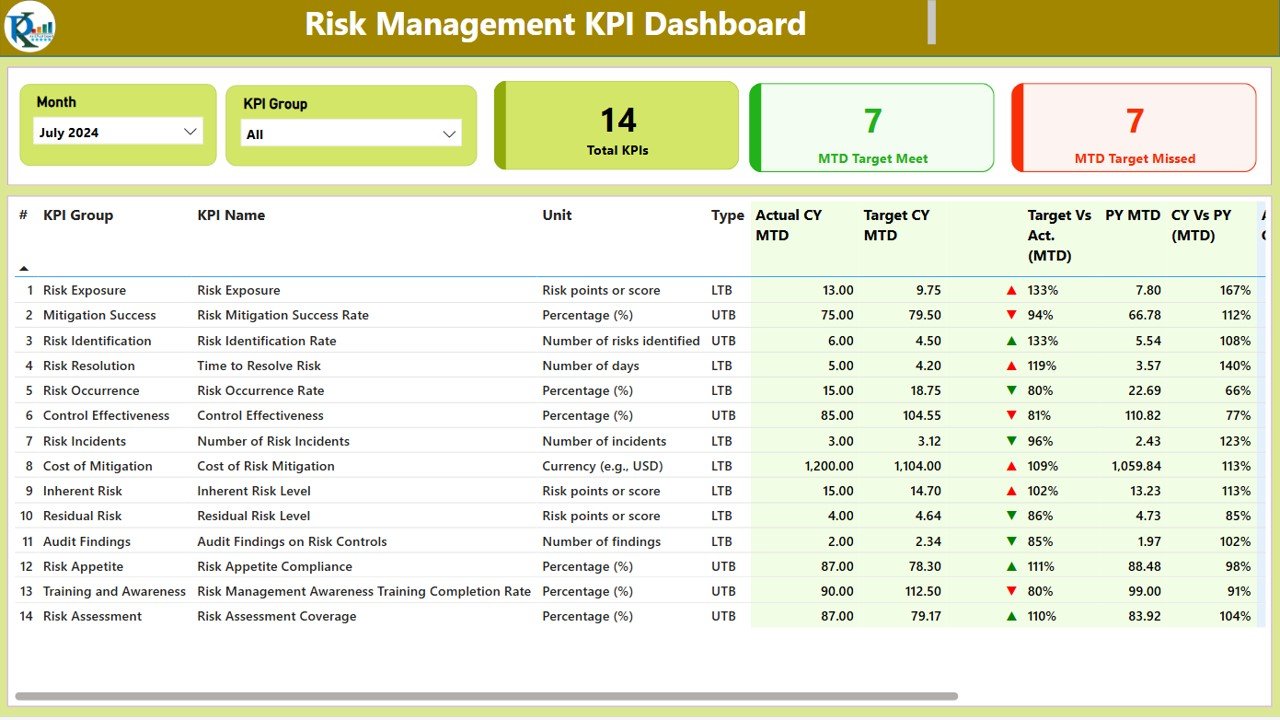
Monitor a range of risk metrics, such as operational risk, financial risk, compliance risk, and project risk. This dashboard consolidates all key data in one place, allowing for a clear and real-time view of your organization’s risk landscape.
⚠️ Risk Impact & Likelihood Analysis
Assess risks based on their potential impact and the likelihood of occurrence. Visualize the risk levels across different business areas to prioritize responses and mitigate the most critical threats first.
📈 Risk Heatmap
Use the dynamic heatmap to visualize risk severity across various departments or projects. The heatmap provides a quick snapshot of areas that require immediate attention and focus.
🔄 Risk Response Tracking
Track the effectiveness of mitigation strategies and the status of risk response efforts. Ensure that all mitigation actions are actively monitored, and any gaps are identified for timely intervention.
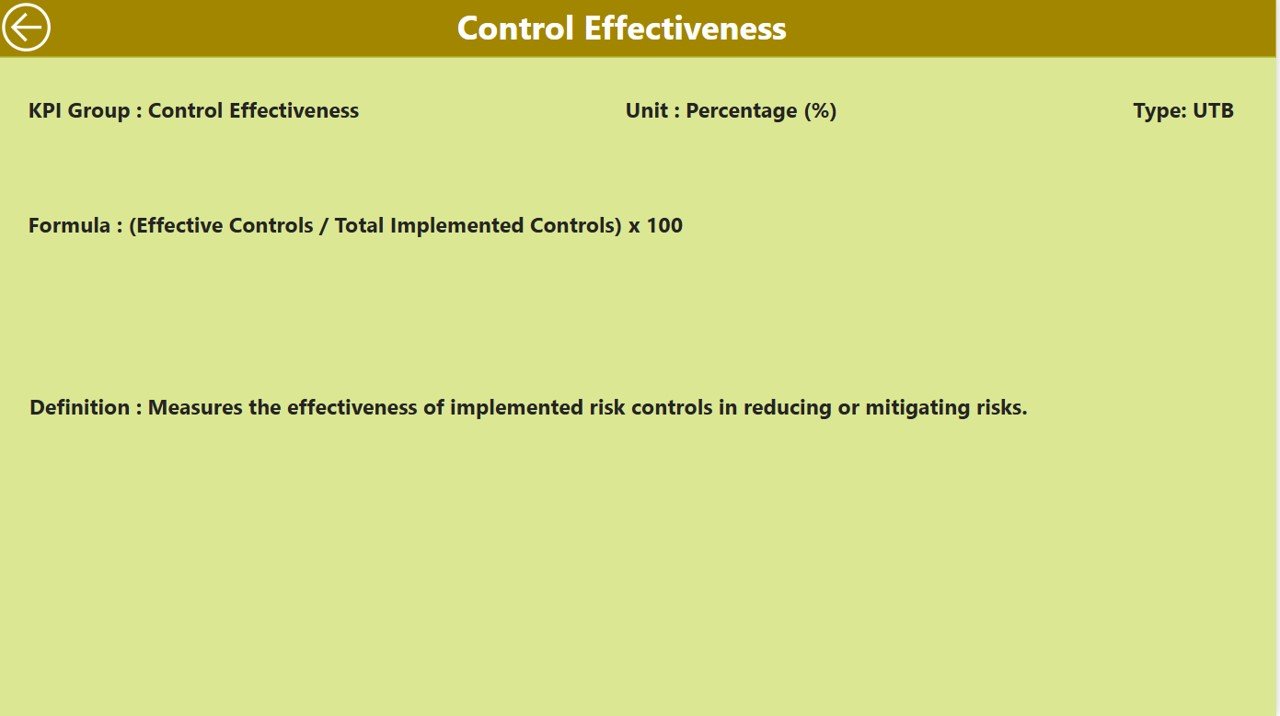
🧑💼 Customizable Risk Metrics
Tailor the dashboard to your organization’s specific risk profile. Add or remove metrics, adjust visualizations, and customize data points to align with your business objectives and risk management needs.
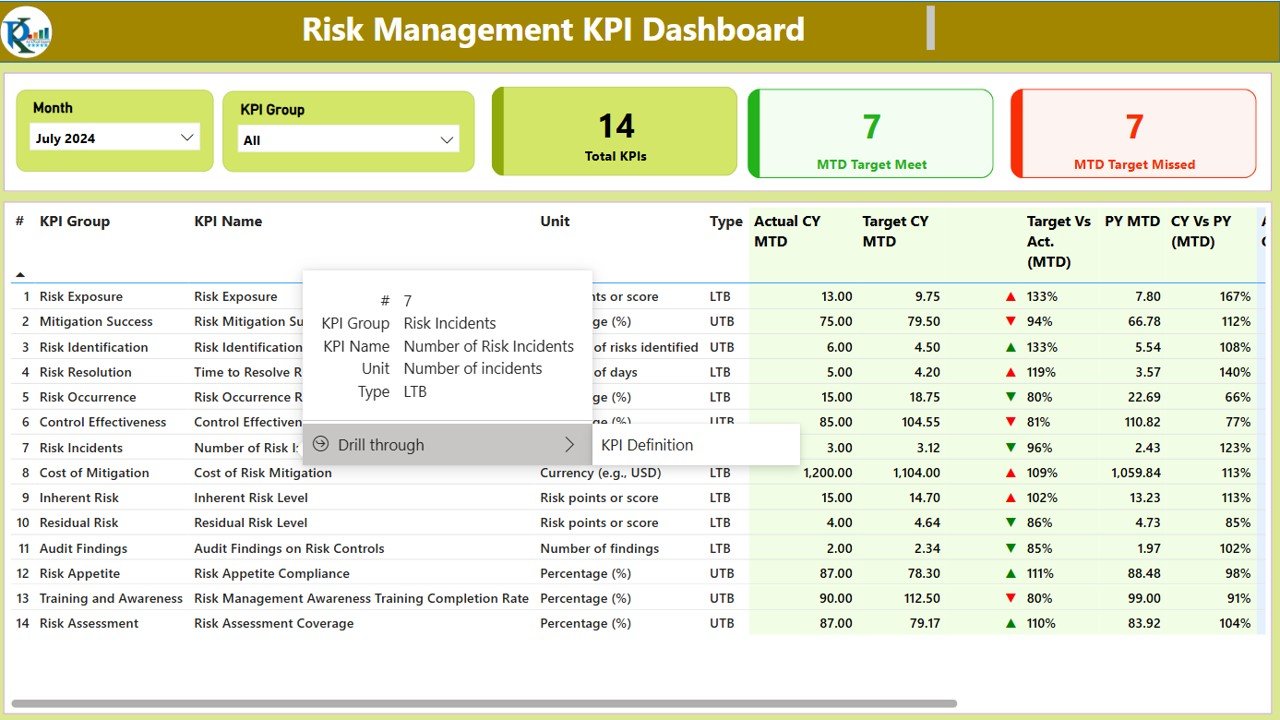
📉 Real-Time Reporting & Insights
Get real-time updates on risk metrics, including risk assessments, mitigation efforts, and response times. Stay on top of any potential threats and adjust strategies accordingly.
Why You’ll Love the Risk Management KPI Dashboard in Power BI
✅ Streamline Risk Management
Centralize risk-related data in a single dashboard, making it easier to identify, assess, and mitigate potential risks.
✅ Prioritize Critical Risks
Use the heatmap and impact/likelihood analysis to prioritize risk responses. Focus on the most significant threats and address them first.
✅ Measure Effectiveness of Risk Responses
Track the success of your risk mitigation strategies. Make adjustments and monitor ongoing actions to minimize risk exposure.
✅ Make Data-Driven Decisions
Base your risk management decisions on real-time data and insightful visualizations. Improve your risk mitigation strategies by understanding the full scope of potential threats.
✅ Fully Customizable & Scalable
The dashboard is customizable, allowing you to modify it to suit your organization’s specific risk management needs. Whether you’re managing risks in a small business or a large enterprise, the dashboard adapts as your business grows.
What’s Inside the Risk Management KPI Dashboard Template in Power BI?
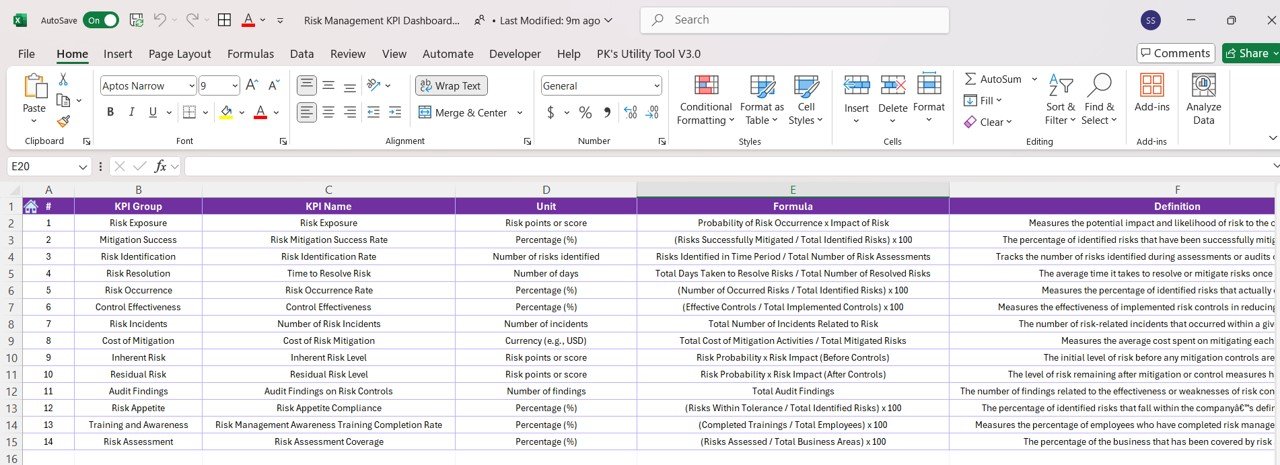
- Risk Tracking: Monitor risks across operational, financial, compliance, and project risks.
- Heatmap for Risk Severity: Visualize risk severity and prioritize responses based on impact.
- Impact & Likelihood Analysis: Assess risks by their potential impact and likelihood of occurrence.
- Risk Response Tracking: Track the status and effectiveness of risk mitigation efforts.
- Real-Time Data Updates: Stay informed with real-time updates on all risk-related metrics.
- Customizable Layout & Reports: Modify the dashboard and reporting features to match your organization’s risk management needs.
How to Use the Risk Management KPI Dashboard in Power BI
1️⃣ Download the Template: Get immediate access to the Risk Management KPI Dashboard in Power BI.
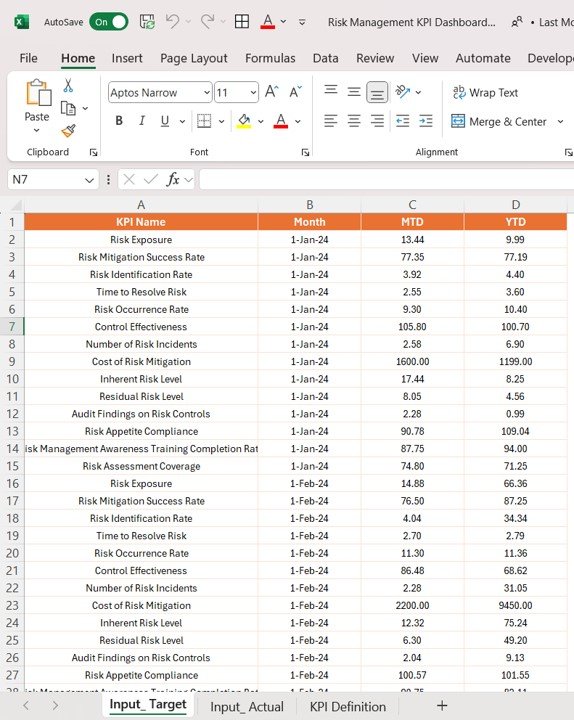
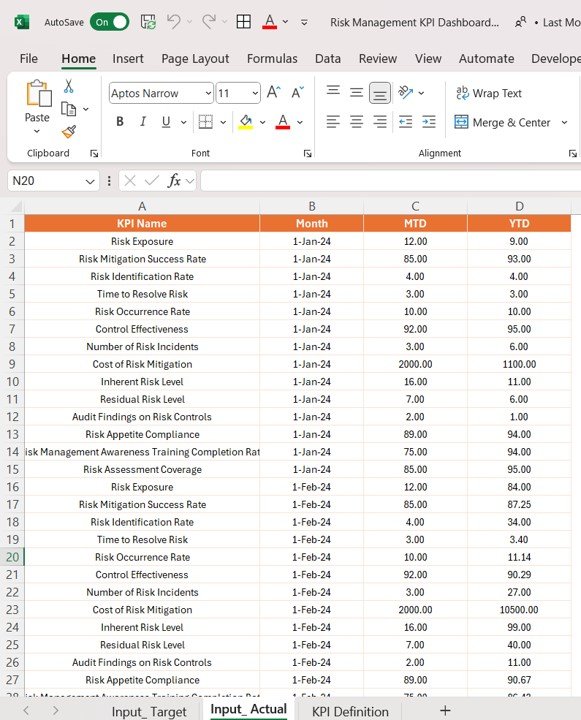
2️⃣ Input Risk Data: Enter your organization’s risk metrics, including impact levels, likelihood, and mitigation efforts.
3️⃣ Track & Monitor Risks: Use the dashboard to track key risk indicators, mitigation effectiveness, and response status.
4️⃣ Analyze & Prioritize Risks: Use the heatmap and analysis features to prioritize risk responses based on severity and likelihood.
5️⃣ Generate Reports & Insights: Create custom reports to share with stakeholders or decision-makers, showing risk trends and mitigation effectiveness.
Who Can Benefit from the Risk Management KPI Dashboard in Power BI?
🔹 Risk Managers & Analysts
🔹 Compliance & Governance Teams
🔹 Project Managers & Portfolio Managers
🔹 Business Continuity & Crisis Management Teams
🔹 Financial Analysts & Controllers
🔹 Executives & Organizational Leaders
Enhance your risk management strategy with the Risk Management KPI Dashboard in Power BI. Track risks, measure the effectiveness of mitigation efforts, and stay ahead of potential threats to ensure a secure and resilient business environment.
Click here to read the Detailed blog post
Visit our YouTube channel to learn step-by-step video tutorials
Youtube.com/@PKAnExcelExpert


Reviews
There are no reviews yet.