Struggling with Stockouts, Overstock, or Shrinking Margins? It’s Time to Take Control 📦📊
Retail moves fast. Products arrive daily. Customers expect availability. Margins stay tight. However, many retailers still manage inventory using scattered spreadsheets and manual tracking. As a result, stockouts increase, overstock piles up, slow-moving items block cash flow, and profits shrink silently.
The Retail Inventory KPI Scorecard in Excel gives you a structured, ready-to-use system to monitor inventory performance clearly and professionally.
Instead of guessing inventory health, you measure it.
Instead of reacting late, you act early.
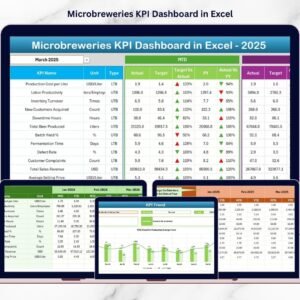
This dynamic Excel scorecard centralizes your key retail inventory metrics and allows you to compare Actual vs Target, analyze Month-to-Date (MTD) and Year-to-Date (YTD) performance, and review previous year benchmarks — all in one powerful dashboard.
Key Feature of Retail Inventory KPI Scorecard in Excel 📊
This professionally designed template includes 4 structured worksheets that provide complete visibility:
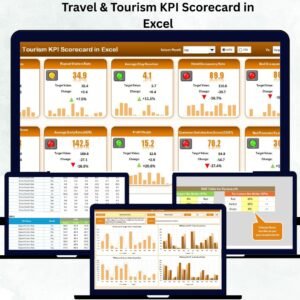
✅ Dynamic Month Selection – Instantly analyze any reporting period.
✅ MTD & YTD Toggle – Switch between short-term and long-term analysis.
✅ Actual vs Target Comparison – Identify inventory performance gaps quickly.
✅ Previous Year Benchmarking – Measure true Year-over-Year growth.
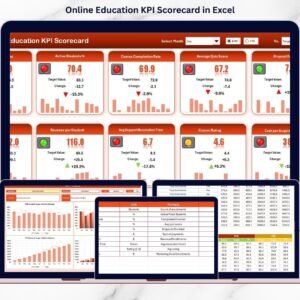
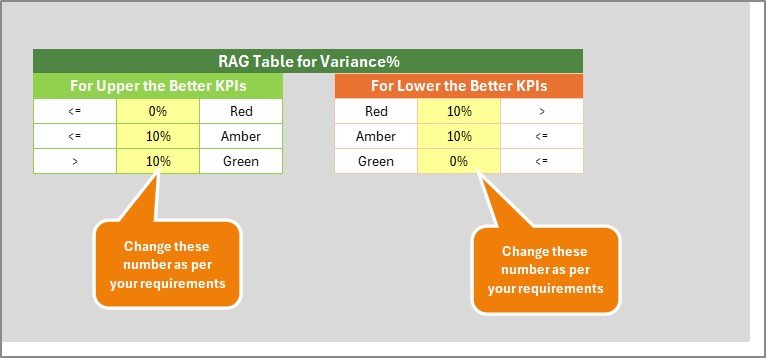
✅ Visual Performance Indicators – Green for improvement, Red for decline.
✅ KPI Trend Charts – Detect patterns in turnover and aging.
✅ LTB / UTB Classification – Logical performance interpretation.
✅ Fully Customizable Structure – Add or modify KPIs easily.
Because it runs entirely in Excel, you maintain full control without expensive inventory software.
What’s Inside the Retail Inventory KPI Scorecard in Excel 📁
You receive a structured Excel workbook with 4 powerful sheets:
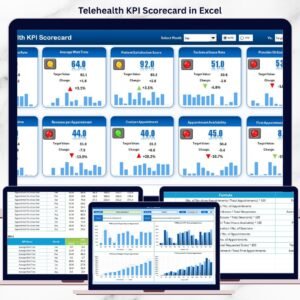
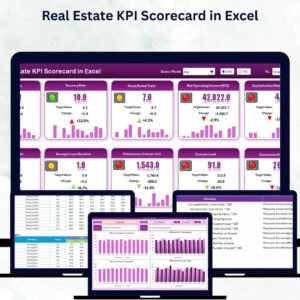
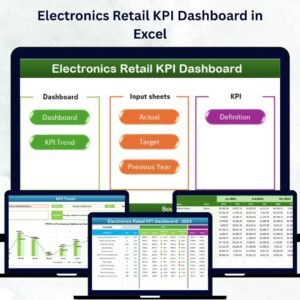
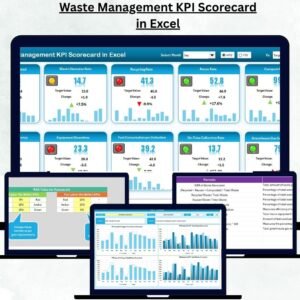
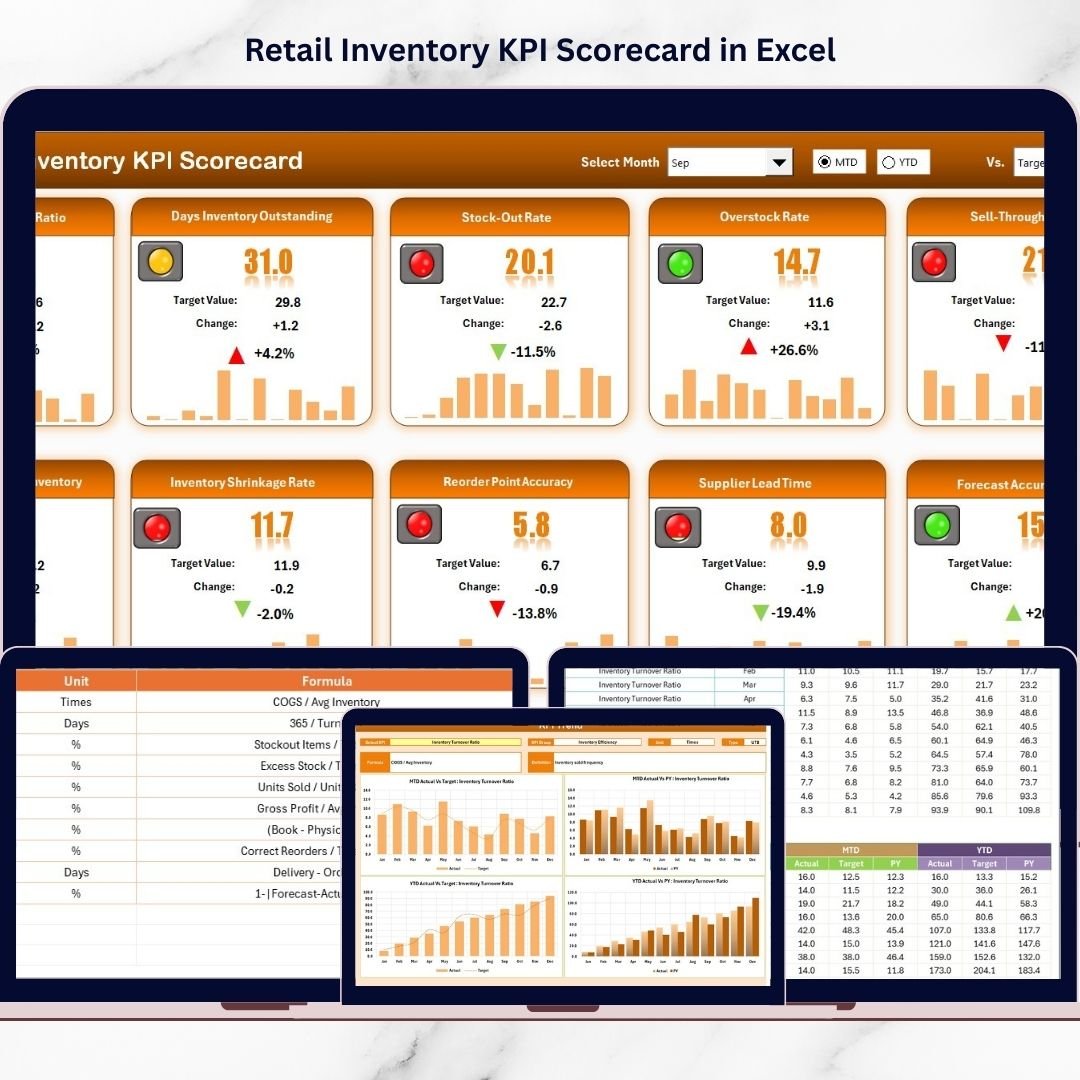
🏬 1️⃣ Scorecard Sheet – Main Inventory Dashboard
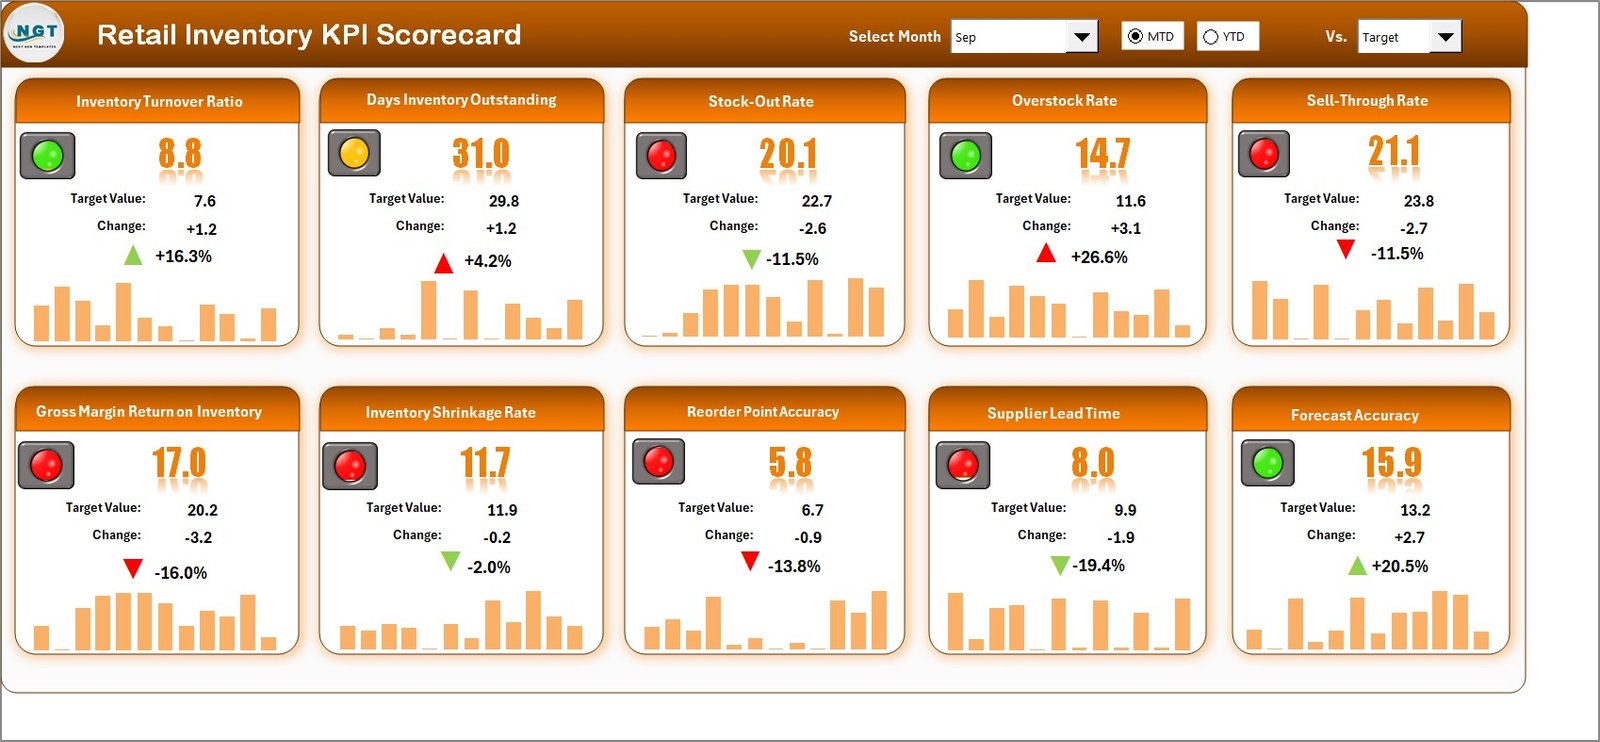
This is your inventory command center.
At the top, you can select:
-
Month
-
MTD or YTD view
The dashboard updates automatically.
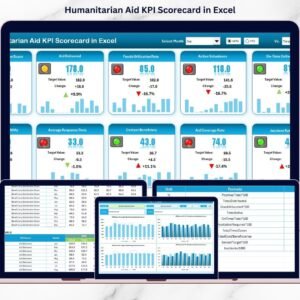
For each KPI, you can view:
-
Actual Value
-
Target Value
-
Previous Year Value
-
Target vs Actual %
-
PY vs Actual %
The sheet displays:
-
KPI Name
-
KPI Group
-
Unit of Measurement
-
MTD Performance
-
YTD Performance
Because of color-coded indicators and arrows, performance becomes instantly understandable.
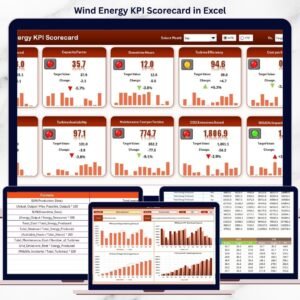
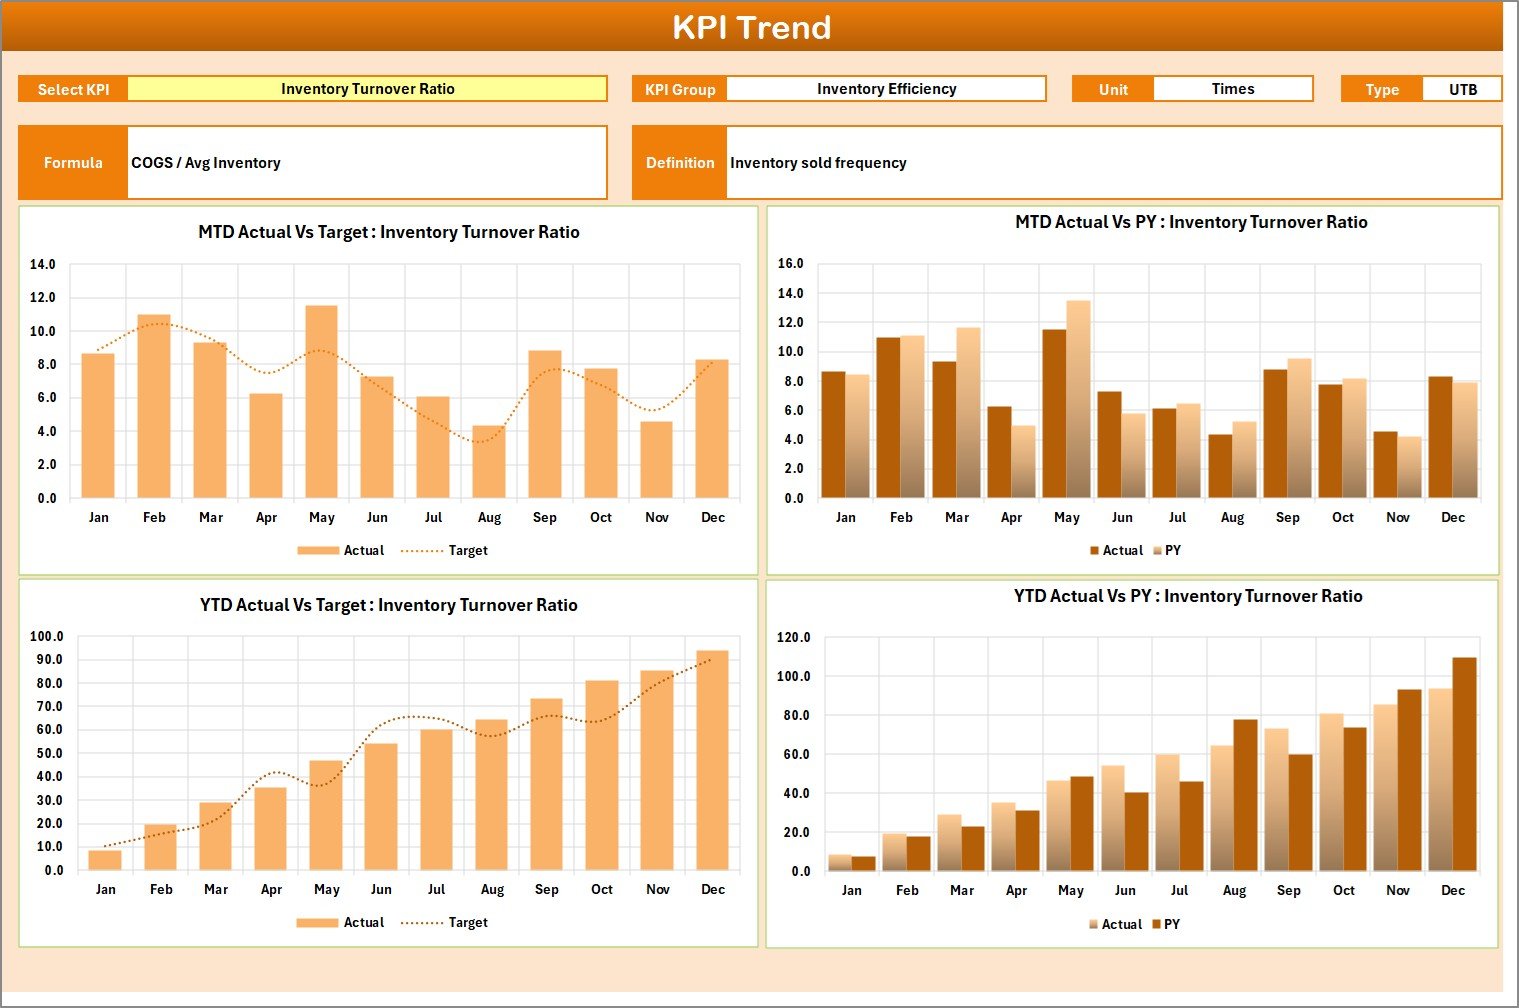
📈 2️⃣ KPI Trend Sheet – Deep Inventory Analysis
Select any KPI from dropdown (Cell C3).
The sheet displays:
-
KPI Group
-
Unit
-
KPI Type (Lower the Better / Upper the Better)
-
Formula
-
Definition
It also includes:
-
MTD Trend Chart (Actual vs Target vs PY)
-
YTD Trend Chart (Actual vs Target vs PY)
This helps you analyze trends like:
-
Improving turnover ratio
-
Rising carrying cost
-
Increasing shrinkage
Trend-based decisions improve purchasing and replenishment planning.
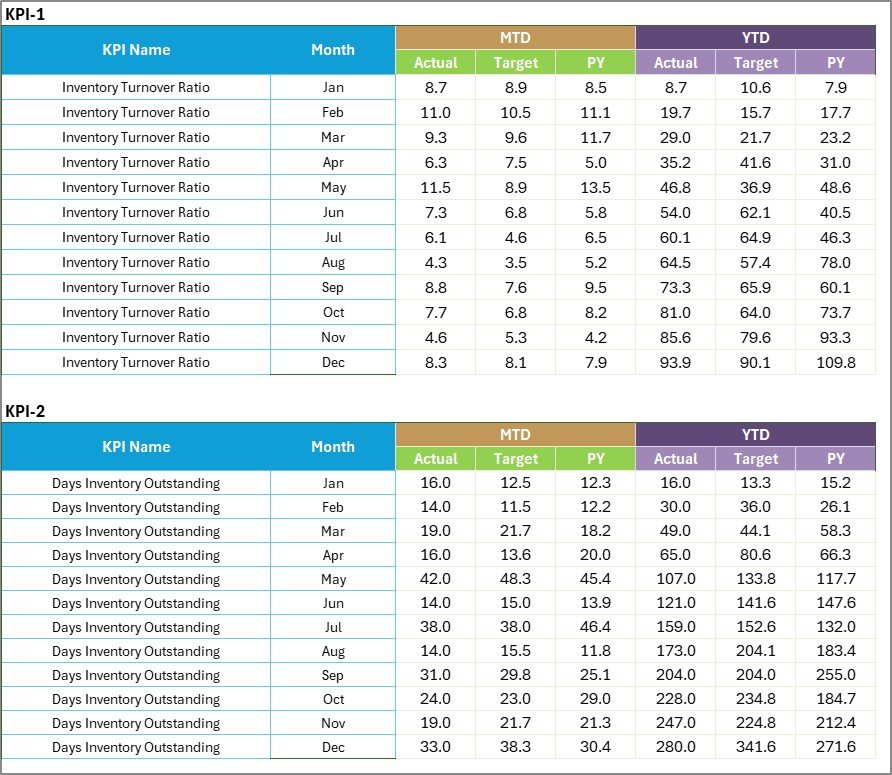
📊 3️⃣ Input Data Sheet – Data Entry Hub
Enter:
-
Actual KPI values
-
Target values
-
Supporting metrics
Because the scorecard connects directly to this sheet, updates reflect instantly.
This eliminates scattered reports and manual calculations.
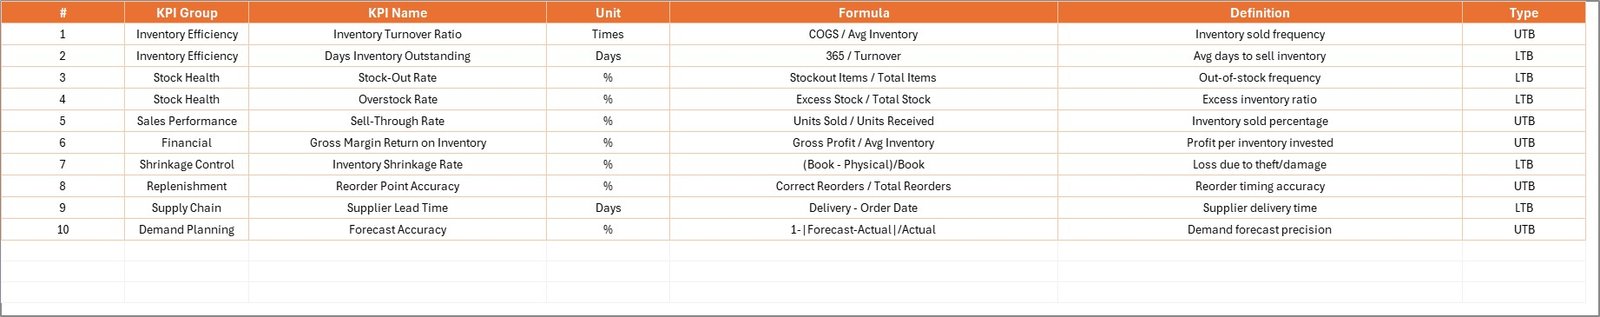
📘 4️⃣ KPI Definition Sheet – KPI Clarity & Governance
Document:
-
KPI Name
-
KPI Group
-
Unit
-
Formula
-
Definition
Clear documentation ensures reporting consistency and team alignment.
How to Use the Retail Inventory KPI Scorecard in Excel ⚙️
Step 1: Define Inventory KPIs
Select key metrics aligned with your retail strategy.
Step 2: Set Monthly Targets
Establish measurable performance goals.
Step 3: Update Actual Data
Enter monthly results into Input Sheet.
Step 4: Select Month & View
Switch between MTD and YTD instantly.
Step 5: Analyze Red Indicators
Focus on underperforming KPIs.
Step 6: Take Action
Adjust purchasing, promotions, or supplier strategy.
Within minutes, your inventory reporting becomes structured, and data driven.
Who Can Benefit from This Retail Inventory KPI Scorecard in Excel 👥
This scorecard is ideal for:
✔ Retail Store Owners
✔ Supermarkets
✔ E-commerce Sellers
✔ Fashion Retailers
✔ Electronics Retailers
✔ Warehouse Managers
✔ Inventory Analysts
Whether you manage a single store or multiple outlets, this scorecard scales with your business.
How This Scorecard Improves Retail Profitability 💰
It helps you:
🔹 Increase inventory turnover
🔹 Improve sell-through rate
🔹 Reduce stock aging
🔹 Minimize shrinkage losses
🔹 Control carrying costs
🔹 Improve cash flow
Because weak inventory signals become visible early, corrective action happens faster.
Instead of losing margins silently, you protect profitability proactively.
If stock control, margin protection, and efficient inventory planning matter to your retail business — this KPI Scorecard becomes your essential management tool.
Click here to read the Detailed blog post
Visit our YouTube channel to learn step-by-step video tutorials
👉 Youtube.com/@PKAnExcelExpert