Managing reseller performance is not just about tracking sales — it’s about understanding profitability, growth trends, efficiency, and accountability. Yet many businesses still rely on scattered spreadsheets, manual calculations, and disconnected reports. This often leads to delayed decisions, unclear performance visibility, and missed revenue opportunities.
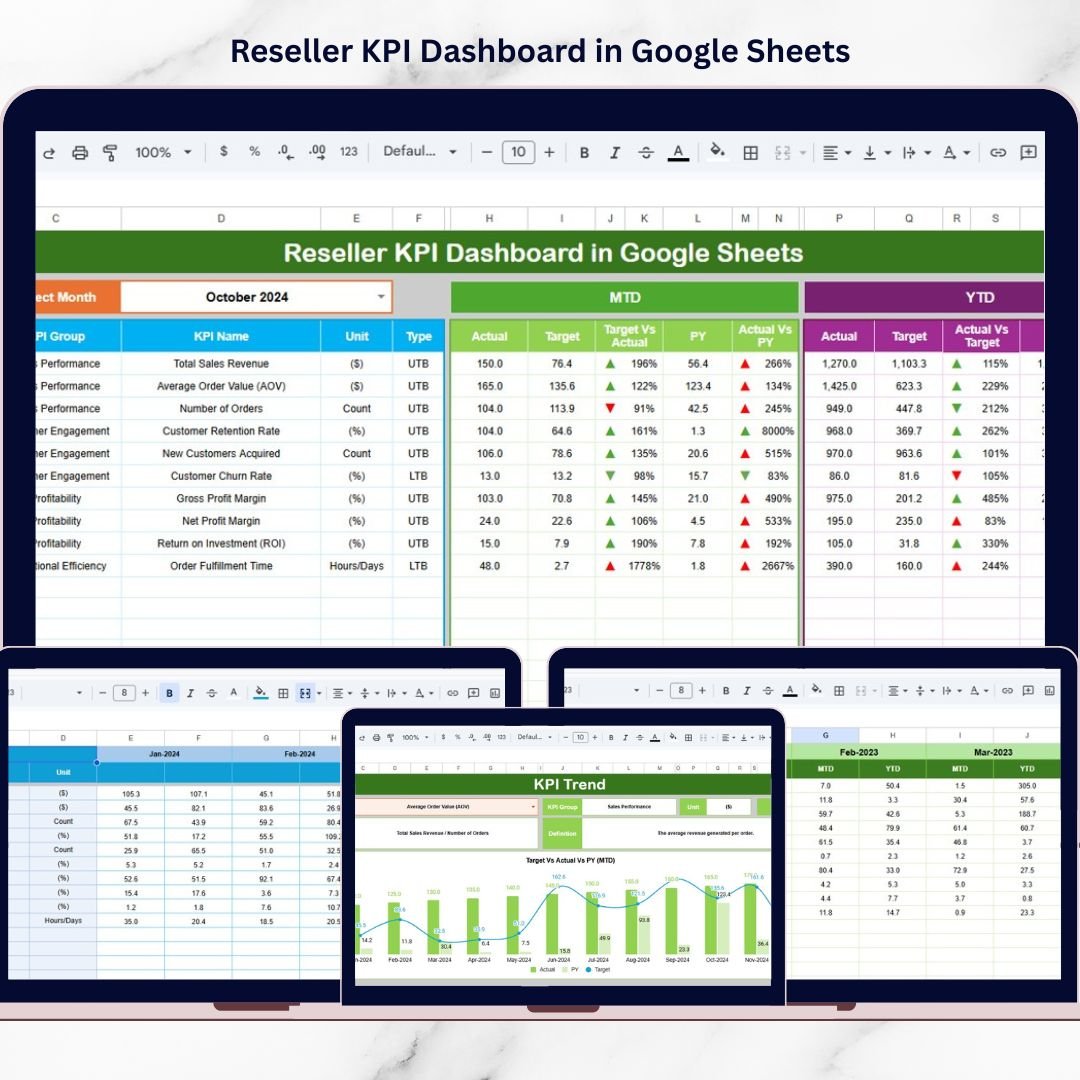
That’s why we created the Reseller KPI Dashboard in Google Sheets — a powerful, ready-to-use, cloud-based performance management system designed to give you total control over your reseller network.
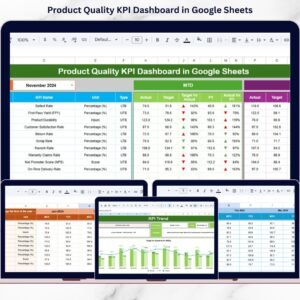
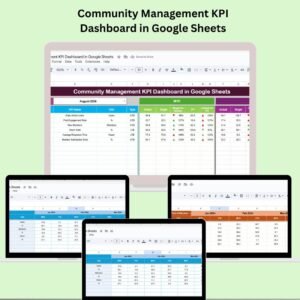
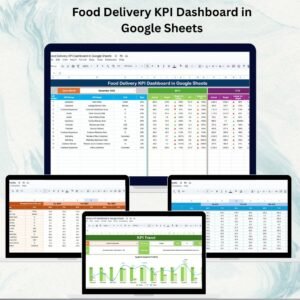
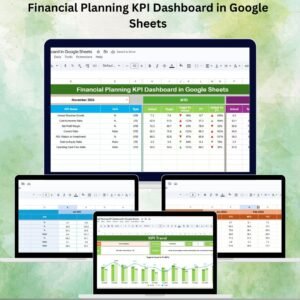
This dashboard transforms complex reseller data into structured, visual, and easy-to-understand insights. Instead of jumping between multiple files, managers can monitor all critical KPIs in one interactive dashboard. With dynamic month selection, automated calculations, MTD and YTD comparisons, and clear performance indicators, decision-making becomes faster and smarter.
Because it is built in Google Sheets, your team can collaborate in real time — without version control issues or expensive software.
If you want clarity, control, and growth in your reseller network, this dashboard is built for you.
🚀 Key Feature of Reseller KPI Dashboard in Google Sheets
✅ Interactive Dashboard with dynamic Month selector (Cell D3)
✅ Automatic MTD & YTD performance calculations
✅ Target vs Actual comparison with visual indicators
✅ Previous Year benchmarking analysis
✅ Conditional formatting with up/down arrows
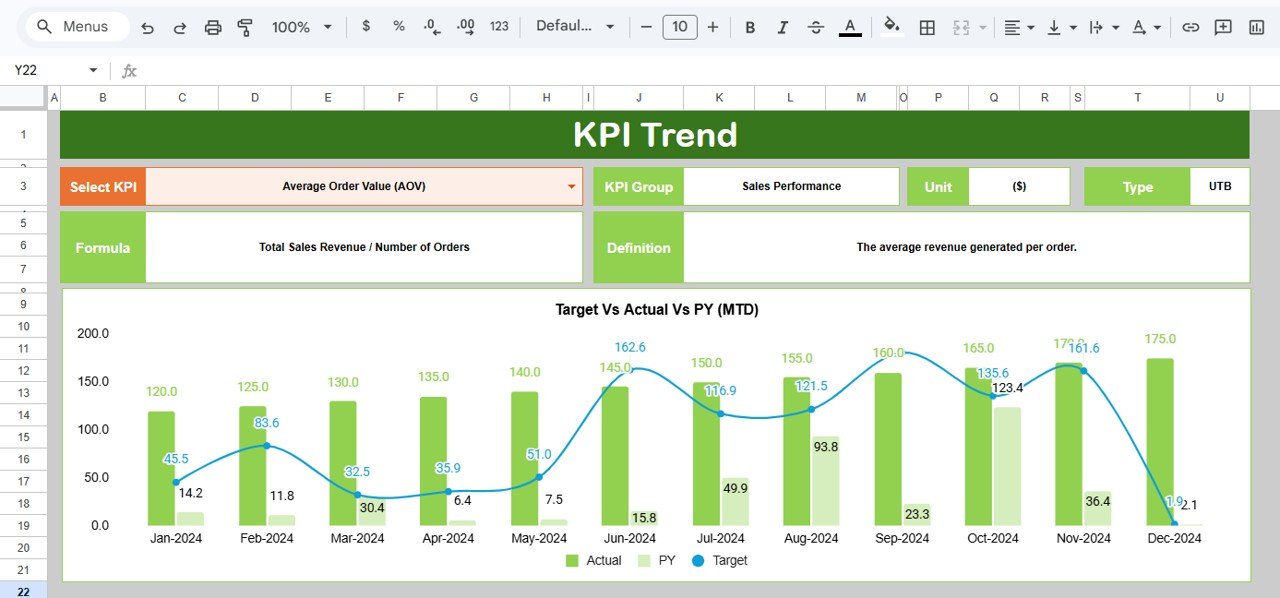
✅ KPI Trend analysis with monthly charts
✅ Structured data entry sheets for accuracy
✅ Fully cloud-based collaboration
✅ Clear KPI definitions with UTB / LTB classification
This dashboard is not just a report — it’s a performance command center.
📦 What’s Inside the Reseller KPI Dashboard in Google Sheets
This product includes 6 structured worksheets, each designed for complete reseller performance tracking:
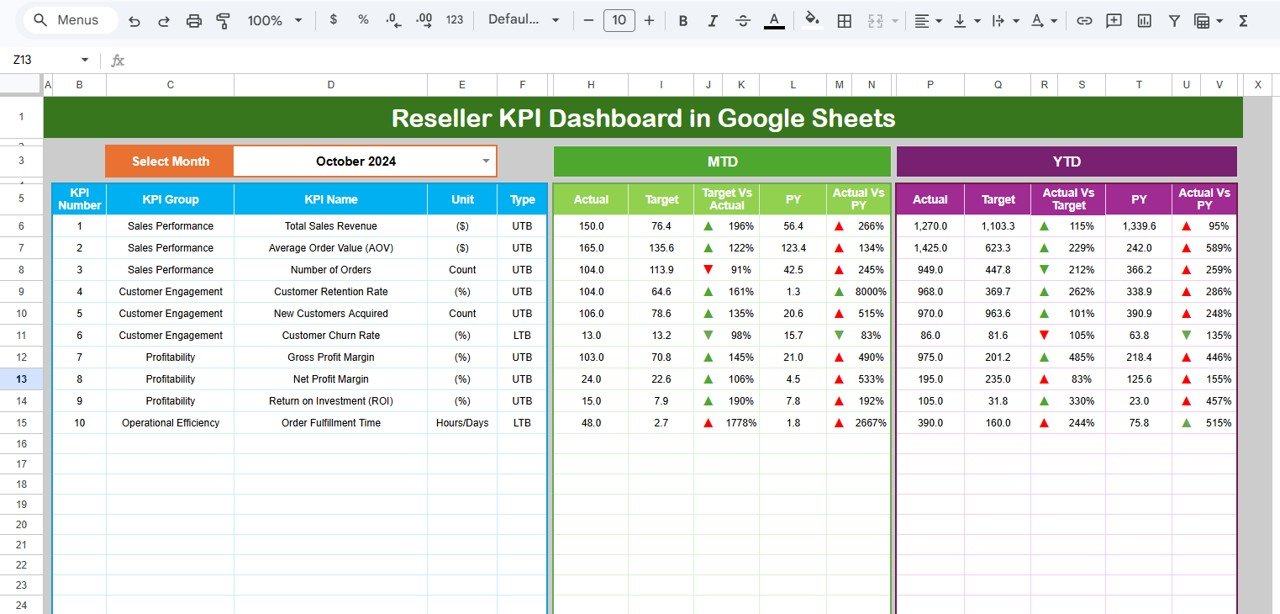
1️⃣ Dashboard Sheet (Main Control Panel)
-
Month dropdown in Cell D3
-
MTD Section (Actual, Target, Previous Year)
-
YTD Section (Actual, Target, Previous Year)
-
Target vs Actual comparison
-
PY vs Actual comparison
-
Conditional formatting indicators
2️⃣ KPI Trend Sheet
-
KPI dropdown selector (Cell C3)
-
KPI Group, Unit, Type (UTB/LTB)
-
Formula and definition visibility
-
Monthly trend chart
-
YTD performance movement
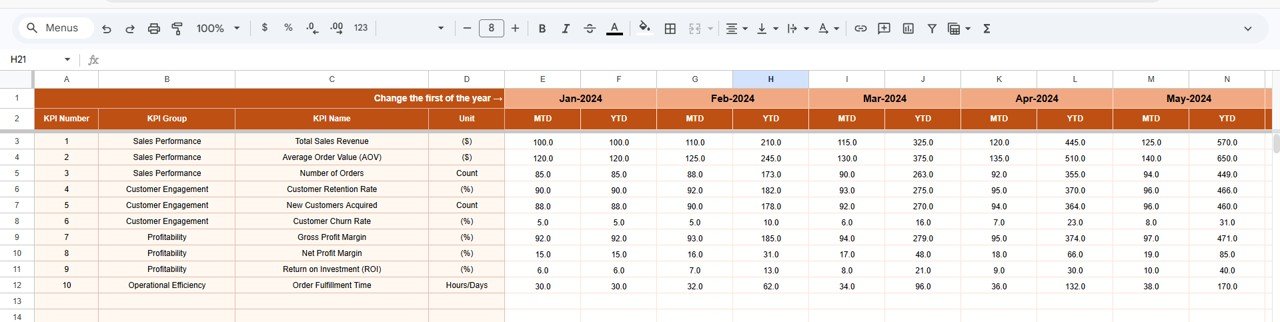
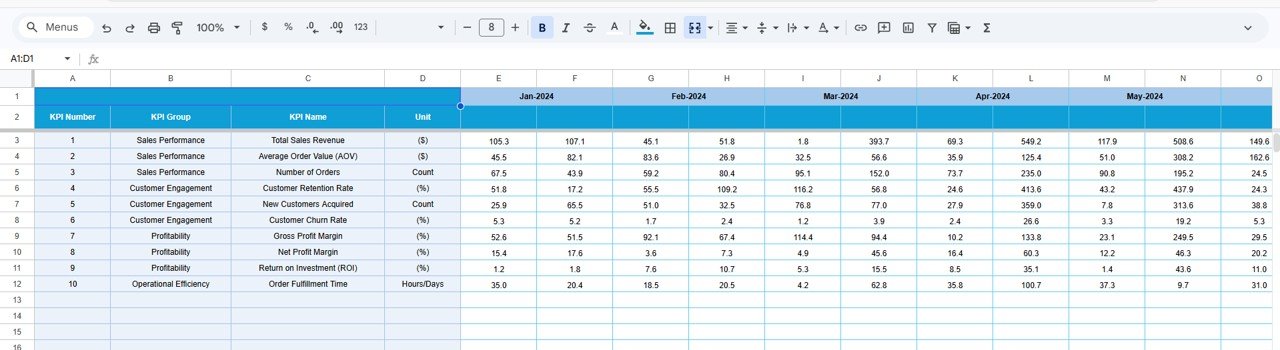
3️⃣ Actual Number Sheet
-
Structured data entry
-
Month control in Cell E1
-
Automatic dashboard integration
4️⃣ Target Sheet
-
Monthly MTD targets
-
YTD cumulative targets
-
Automatic comparison updates
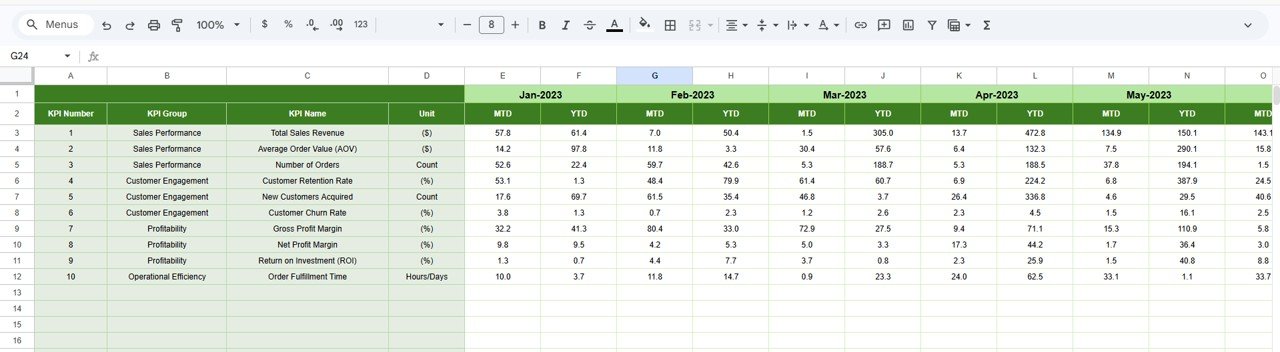
5️⃣ Previous Year Sheet
-
Historical MTD and YTD inputs
-
Growth benchmarking analysis
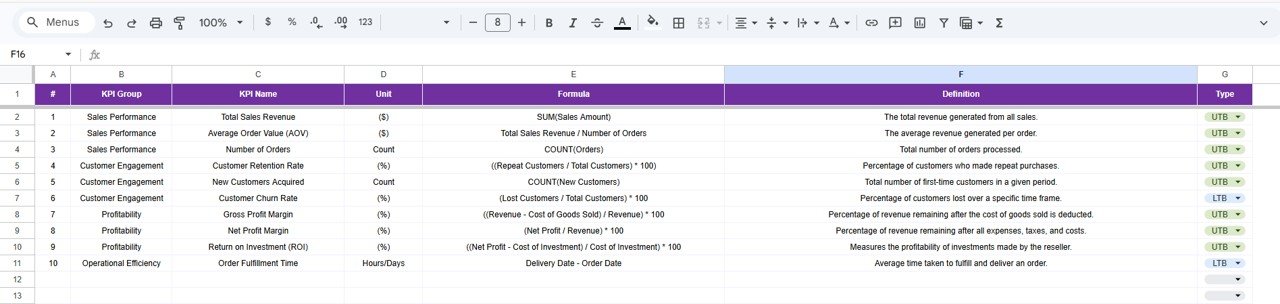
6️⃣ KPI Definition Sheet
-
KPI Name
-
KPI Group
-
Unit
-
Formula
-
KPI Definition
-
KPI Type (UTB / LTB)
Everything is structured, organized, and automated.
⚙️ How to Use the Reseller KPI Dashboard in Google Sheets
Using this dashboard is simple and efficient:
-
Enter current month actual data in the Actual Sheet.
-
Update targets in the Target Sheet.
-
Input previous year numbers for benchmarking.
-
Select the desired month from Cell D3.
-
Instantly analyze MTD and YTD performance.
-
Use KPI Trend Sheet for deeper KPI movement insights.
Within minutes, you gain a complete performance overview.
👥 Who Can Benefit from This Reseller KPI Dashboard in Google Sheets
This dashboard is perfect for:
-
Distribution companies
-
Wholesale businesses
-
FMCG companies
-
Channel sales managers
-
Business owners
-
Sales directors
-
Finance teams
-
Operations managers
Any organization managing reseller or channel partners can use this system to improve profitability and accountability.
By centralizing actuals, targets, and historical comparisons, this dashboard eliminates confusion and improves transparency. Managers identify underperforming resellers instantly, adjust strategies quickly, and align teams with clear goals.
The result? Better control, smarter decisions, and sustainable revenue growth.
### Click here to read the Detailed blog post
Watch the step-by-step video tutorial: