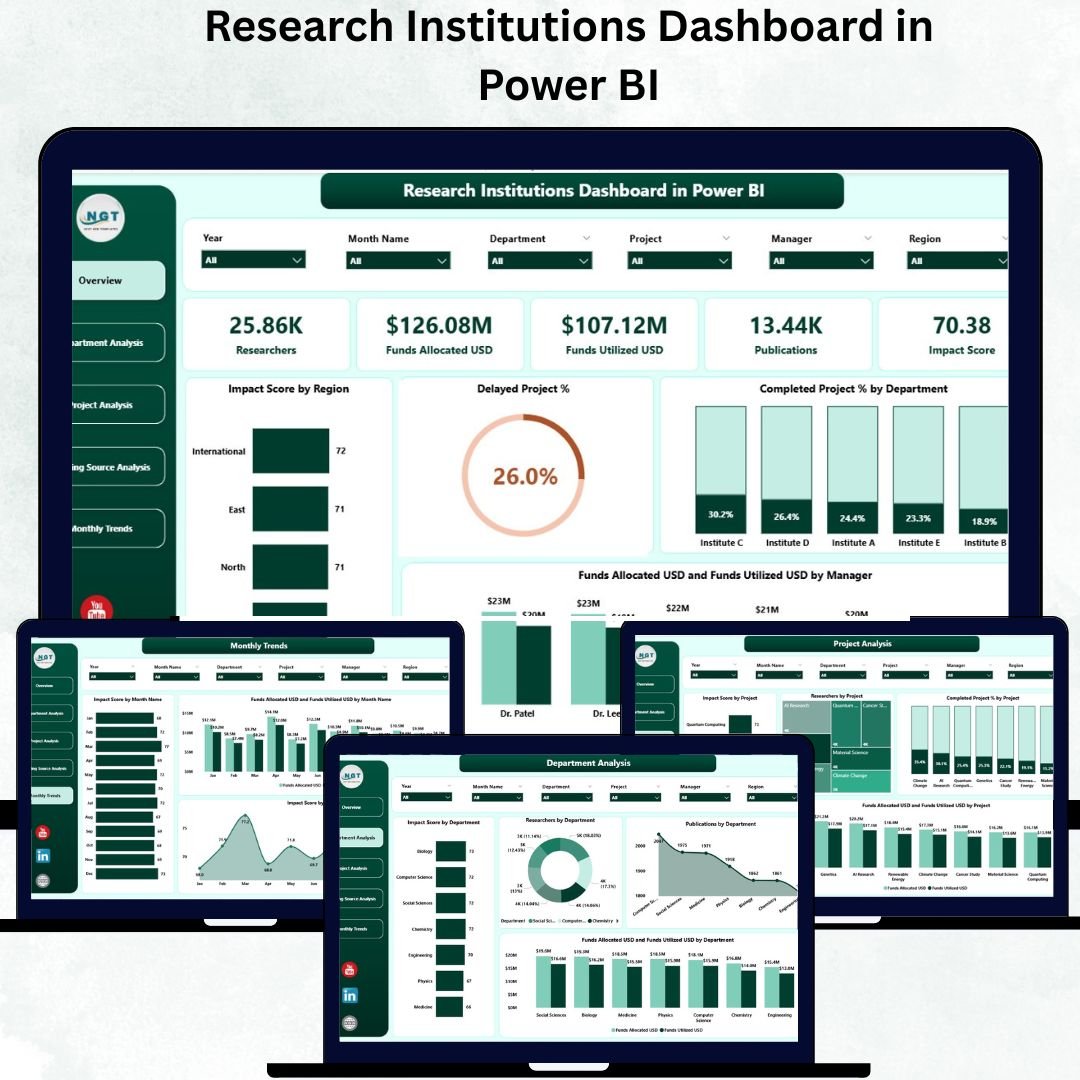
🔬 In the fast-paced world of research and innovation, managing data from multiple projects, departments, and funding sources can be overwhelming. The Research Institutions Dashboard in Power BI is a ready-to-use analytical tool designed to help universities, research centers, and funding agencies visualize performance, track progress, and optimize impact — all in one interactive dashboard.
Built entirely in Microsoft Power BI, this dashboard consolidates complex research data into visually rich insights that support better decision-making, transparency, and funding efficiency. From tracking publications and project performance to monitoring fund utilization and researcher productivity, this tool transforms raw data into actionable intelligence.
✨ Key Features of the Research Institutions Dashboard in Power BI
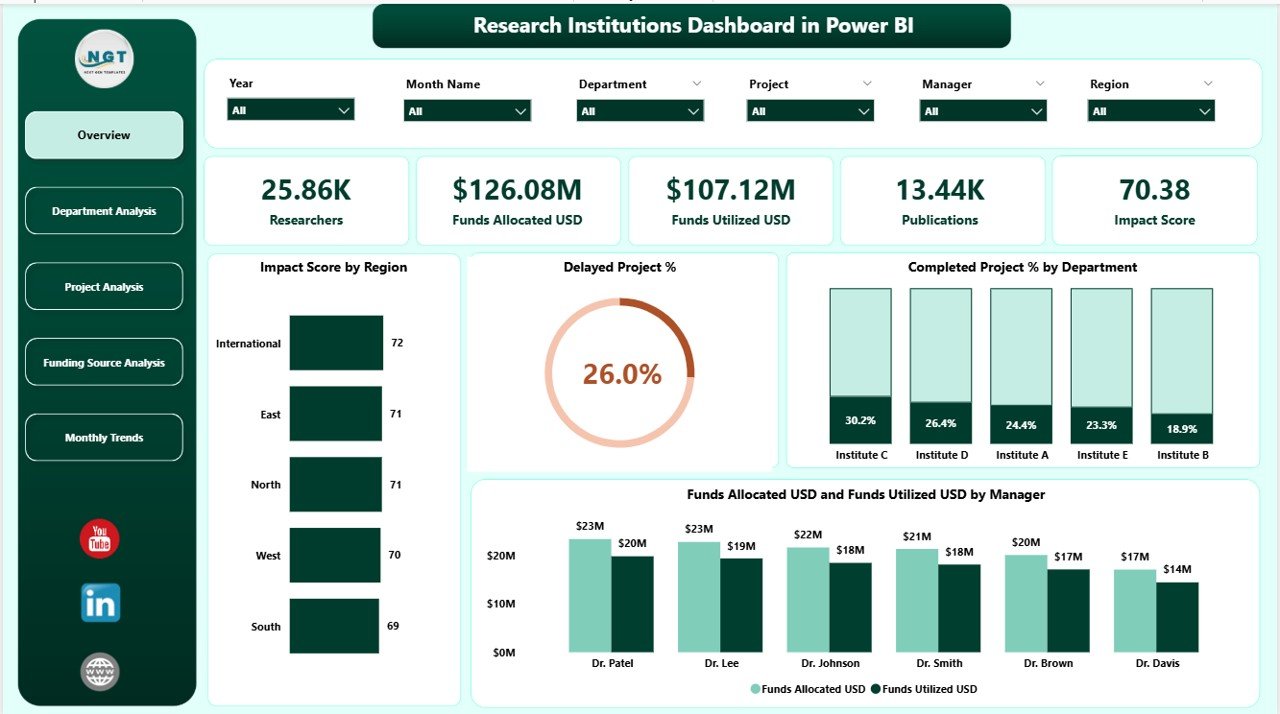
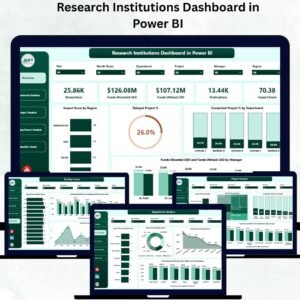
✅ 📊 Interactive Overview Page – Gain a complete institutional snapshot with 5 KPI cards displaying Impact Score, Delayed %, Completed %, Funds Allocated, and Funds Utilized — plus visuals showing performance by Region, Department, and Manager.
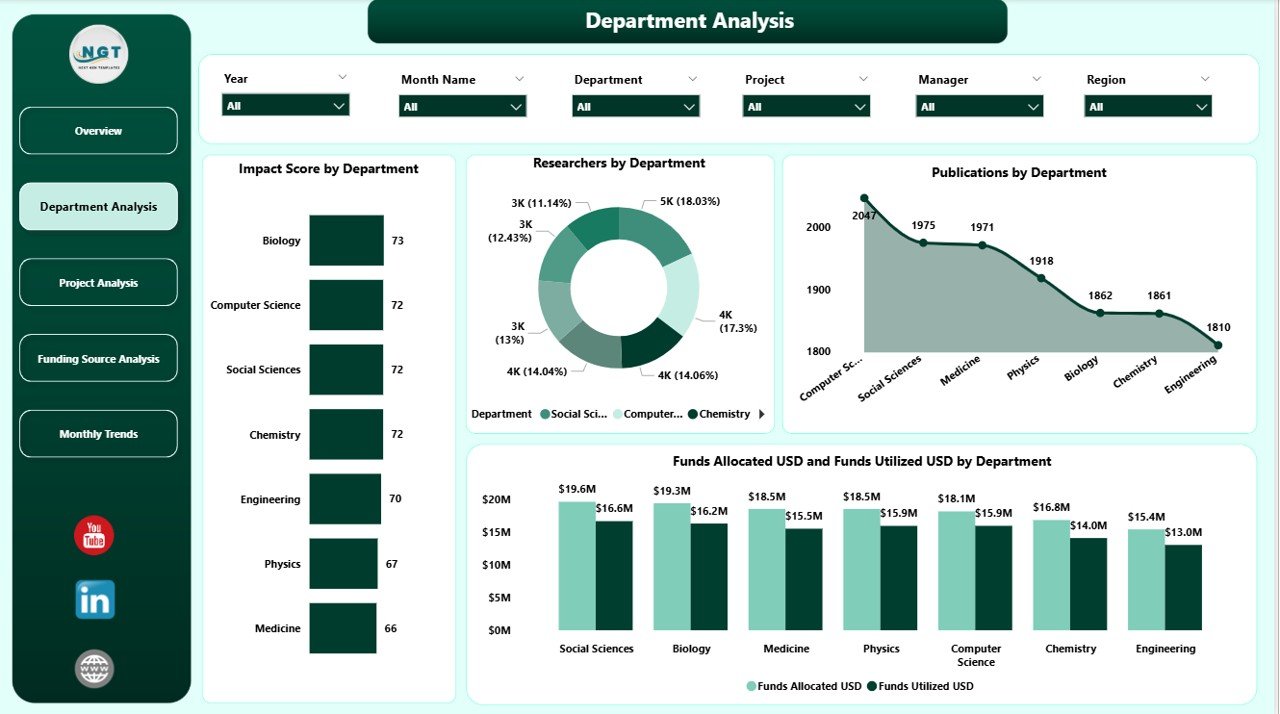
✅ 🏢 Department Analysis Page – View department-wise analytics with charts for Impact Score, Publications, Researchers, and Fund Allocation vs Utilization to identify high and low-performing departments.
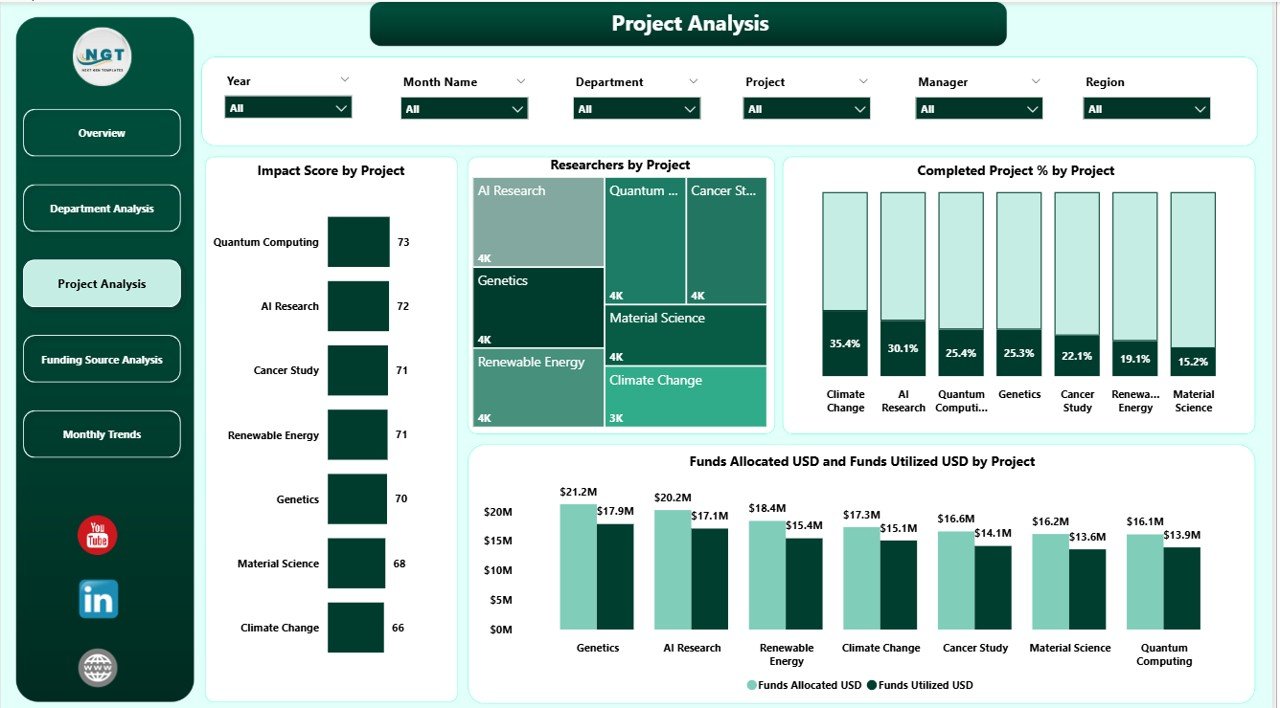
✅ 📁 Project Analysis Page – Evaluate project-level success with charts showing Impact Score, Researchers, Completion %, and Funding Efficiency — helping track timelines, budgets, and results.
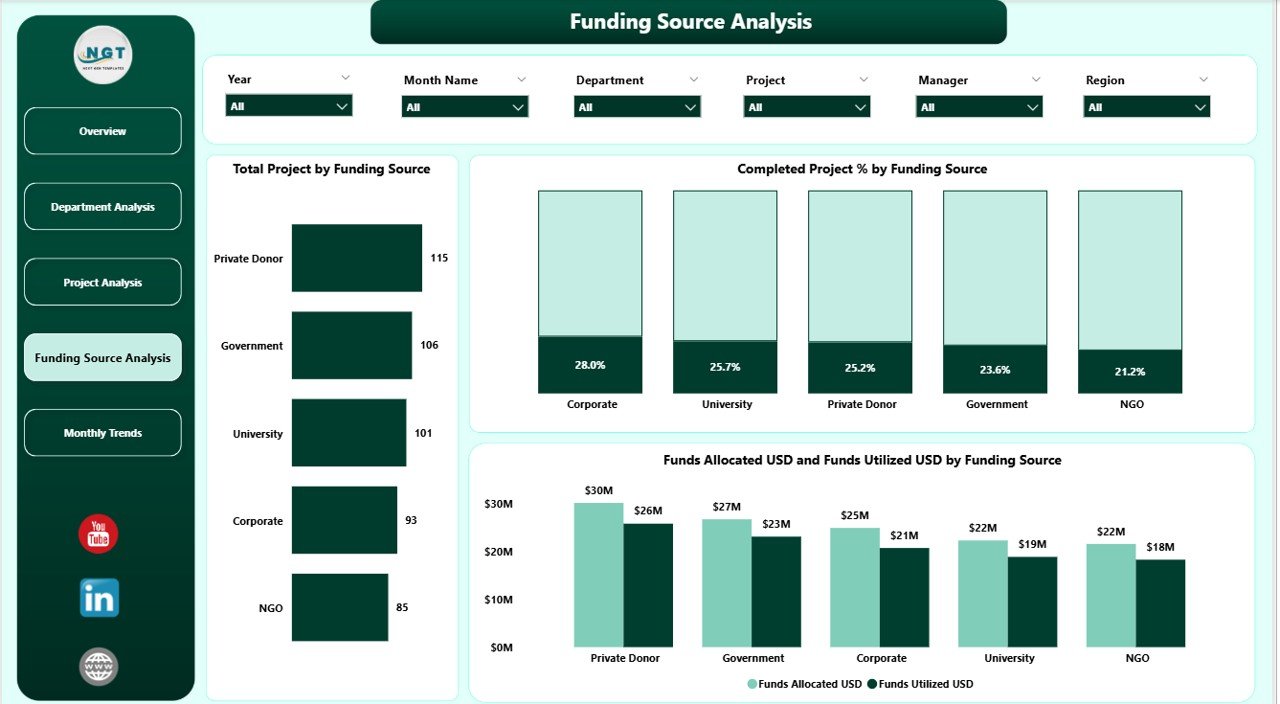
✅ 💰 Funding Source Analysis Page – Compare how various funding sources contribute to research success through visuals like Total Projects by Source, Completion %, and Funds Utilized vs Allocated (USD).
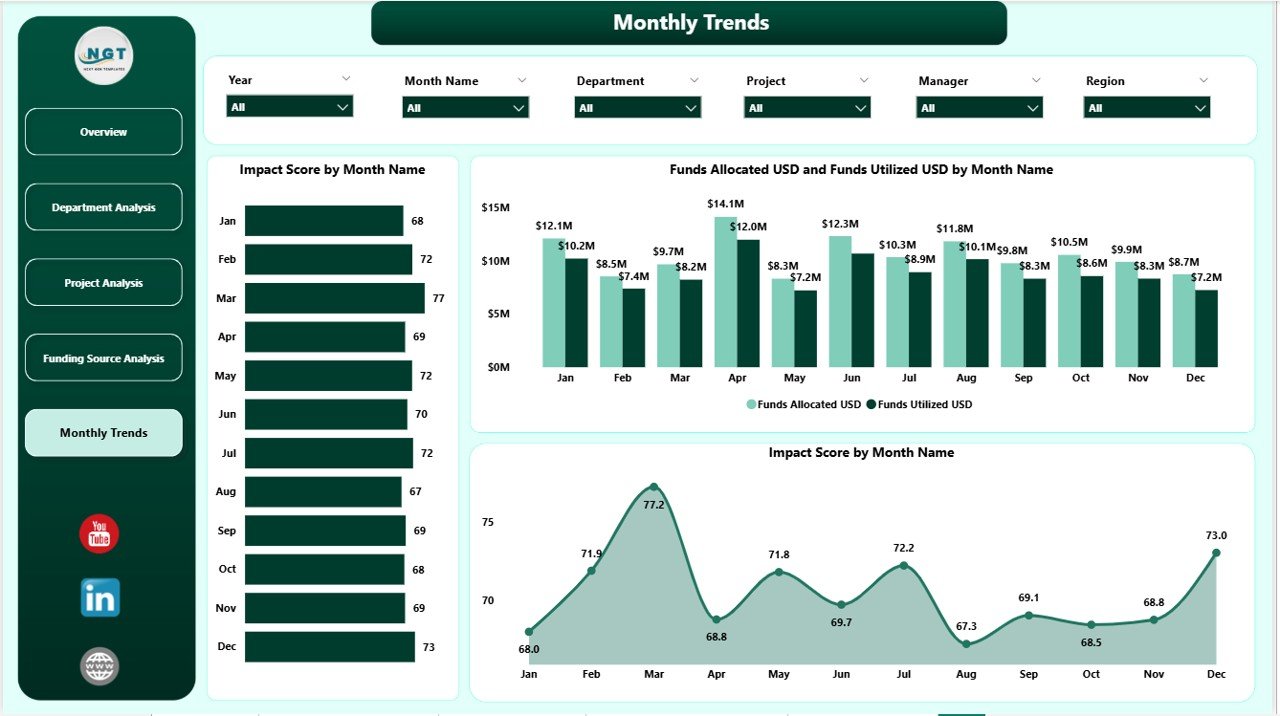
✅ 📅 Monthly Trends Page – Analyze performance over time with charts like Impact Score by Month, Funds Allocated vs Utilized, and Completion Trend, helping leaders track growth and forecast performance.
✅ ⚙️ Automated Data Refresh – Power BI automatically updates the visuals as soon as new data is added — no manual intervention needed.
✅ 🔍 Smart Filters & Slicers – Filter results instantly by Manager, Department, Funding Source, or Project to uncover detailed insights.
✅ 🔒 Secure Multi-User Access – Enable role-based permissions so that administrators, funders, and researchers view only relevant information.
📦 What’s Inside the Research Institutions Dashboard
📁 5 Professional Pages for In-Depth Analysis:
-
Overview Page – Instant performance summary.
-
Department Analysis Page – Departmental impact and output insights.
-
Project Analysis Page – Project-level performance evaluation.
-
Funding Source Page – Analyze sponsor-wise results and utilization.
-
Monthly Trends Page – Visualize time-based progress and fund flow.
🧮 Data Model & Structure:
-
Integrated data relationships for Projects, Departments, Funding, and Researchers.
-
Pre-defined KPIs for Impact Score, Fund Utilization %, and Completion %.
📈 Powerful Visualizations:
-
Bar, Line, Pie, and Card visuals optimized for clarity and storytelling.
-
Conditional formatting to highlight top and bottom performers.
⚙️ How to Use the Research Institutions Dashboard
1️⃣ Connect Data Sources: Link Excel, SQL, or SharePoint datasets.
2️⃣ Load Data: Import and clean using Power Query.
3️⃣ Review the Overview Page: Get an instant visual summary of all KPIs.
4️⃣ Explore Department & Project Pages: Drill down into performance metrics.
5️⃣ Analyze Trends: Track monthly progress to identify funding patterns.
6️⃣ Compare Funding Sources: Evaluate which grants produce the highest impact.
7️⃣ Share Dashboards: Publish to Power BI Service for collaboration with researchers and funders.
💡 Pro Tip: Use automated refresh schedules in Power BI Service to keep your dashboard live and accurate.
👥 Who Can Benefit from This Dashboard
🏫 Universities & Academic Institutions – Track publications, projects, and researcher performance.
🏛️ Government Research Bodies – Monitor nationwide R&D programs.
💰 Funding Agencies & Donors – Ensure accountability in fund utilization.
🔬 Private Research Labs – Evaluate project ROI and efficiency.
🌍 Non-Profit & International Research Organizations – Measure progress toward sustainability and innovation goals.
📈 Institutional Analysts & Data Officers – Simplify complex data into actionable visual stories.
With this dashboard, every stakeholder — from principal investigators to donors — can collaborate, evaluate, and accelerate research outcomes confidently.
🔗 Click here to read the Detailed Blog Post
🎥 Visit our YouTube channel to learn step-by-step video tutorials


Reviews
There are no reviews yet.