


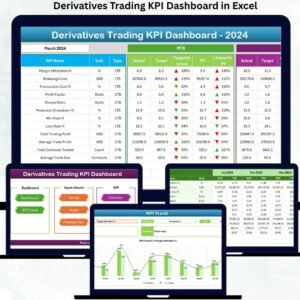
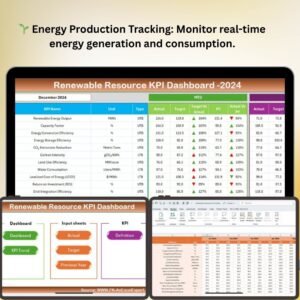
The Renewable Resource KPI Dashboard in Excel is a comprehensive tool designed for businesses and organizations in the renewable energy sector. Whether you’re managing solar, wind, or other renewable resources, this Excel-based dashboard allows you to track and evaluate key performance indicators (KPIs) that are crucial for optimizing energy production, resource utilization, and overall efficiency.
This dashboard helps you monitor real-time energy production, analyze resource consumption, assess operational efficiency, and measure the financial performance of renewable energy initiatives. It empowers decision-makers with data-driven insights that can improve sustainability efforts, reduce costs, and increase profitability.
Key Features of the Renewable Resource KPI Dashboard in Excel
🌱 Energy Production & Consumption Tracking
Track the energy produced and consumed across various renewable resources, such as solar panels, wind turbines, and bioenergy systems. Monitor energy generation efficiency and overall output.
📉 Efficiency & Performance Metrics
Evaluate the operational performance of renewable energy systems by monitoring efficiency metrics such as capacity utilization and resource yield. Assess whether systems are performing optimally or if there are inefficiencies that need addressing.
💰 Financial Performance & Cost Tracking
Analyze the financial aspects of renewable resource projects. Track revenue generation, operational costs, and ROI for each energy system to ensure your investments are profitable.
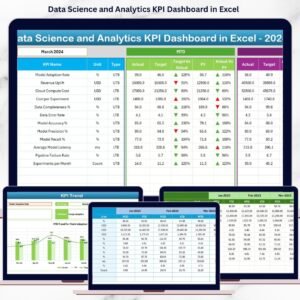
📊 Real-Time Data Visualization
Visualize key performance indicators and metrics with dynamic charts and graphs. Easily analyze production levels, financials, efficiency rates, and trends in real-time.
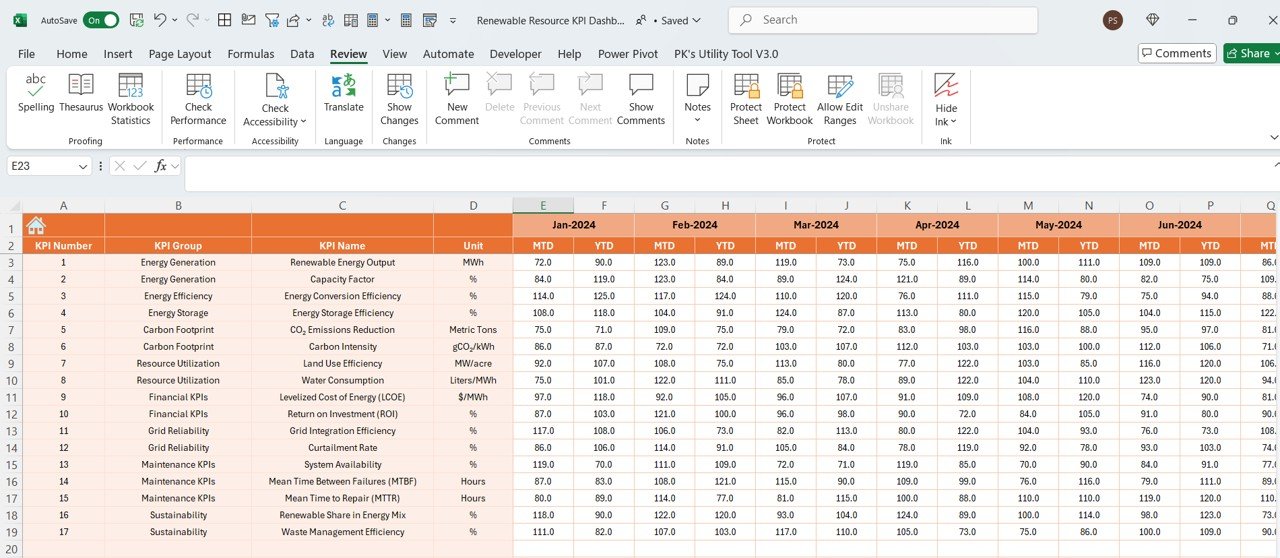
📅 Time-Based Tracking & Reporting
Monitor data over different time periods (e.g., daily, weekly, monthly, and yearly). This allows you to evaluate trends and performance variations over time, which helps you make timely adjustments.
⚙️ Customizable KPIs & Metrics
Customize the dashboard to fit your specific needs. Add new KPIs, adjust existing metrics, and track data that aligns with your organization’s renewable resource goals.
Why You’ll Love the Renewable Resource KPI Dashboard in Excel

✅ Optimized Resource Management
Track the performance and efficiency of renewable energy resources in one place, ensuring you get the most out of your assets and investments.
✅ Maximize Operational Efficiency
By monitoring efficiency metrics and system performance, you can identify areas of improvement, reduce waste, and optimize energy production.
✅ Make Data-Driven Financial Decisions
Monitor the financial performance of renewable resource projects, ensuring that you’re maximizing revenue while keeping costs under control. Measure ROI to evaluate profitability.
✅ Real-Time Insights & Visual Reports
Get real-time data and visual insights to make timely decisions. Use interactive charts to track progress and adjust strategies based on actual performance.
✅ Customizable for Your Renewable Energy Goals
Whether you’re managing a single solar farm or multiple renewable resource projects, the dashboard can be tailored to track the KPIs and data that matter most to your specific business needs.
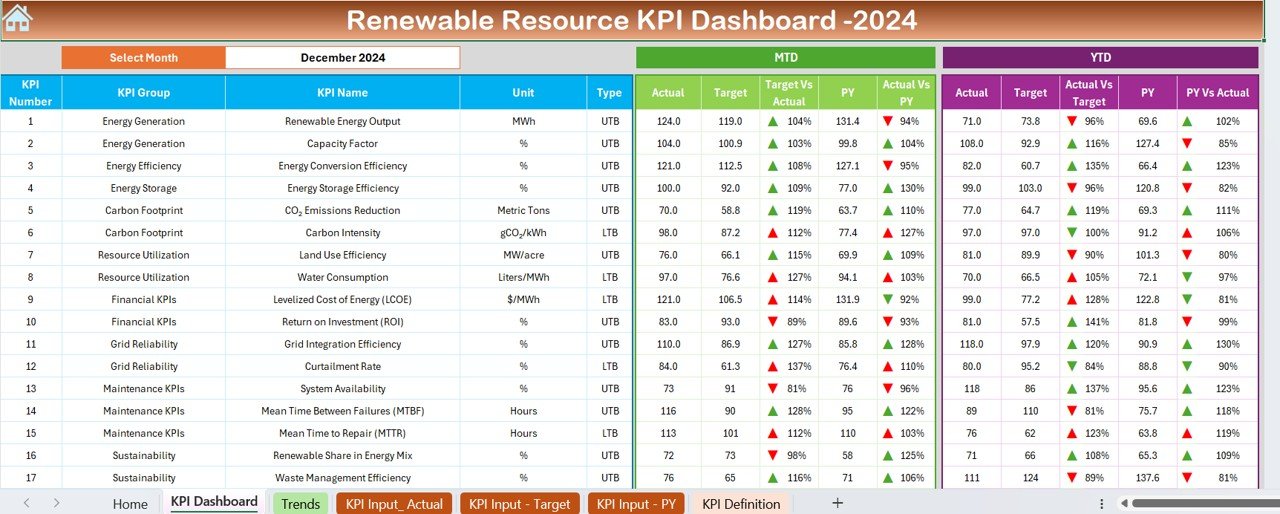
What’s Inside the Renewable Resource KPI Dashboard in Excel?
- Energy Production & Consumption Tracker: Monitor real-time data for energy generation and consumption.
- Operational Efficiency Metrics: Track system performance, capacity utilization, and energy yield.
- Financial Analysis & ROI: Measure revenue generation, operational costs, and financial performance.
- Customizable KPIs: Tailor the dashboard to track renewable energy metrics that are most important for your projects.
- Real-Time Data Visualization: Visualize data with charts and graphs to monitor performance trends.
- Time-Based Tracking: Analyze data over specific time frames to evaluate performance changes.
How to Use the Renewable Resource KPI Dashboard in Excel
1️⃣ Download the Template: Get immediate access to the Renewable Resource KPI Dashboard in Excel.
2️⃣ Input Your Data: Enter your renewable energy production, consumption, and financial data into the dashboard.
3️⃣ Set Up KPIs & Metrics: Customize the dashboard by adding the relevant KPIs for your renewable resource projects.
4️⃣ Track Performance: Monitor energy generation, efficiency, and financial metrics in real-time.
5️⃣ Visualize & Analyze: Use visual reports and charts to evaluate performance trends and adjust strategies.
Who Can Benefit from the Renewable Resource KPI Dashboard in Excel?
🔹 Renewable Energy Companies & Project Managers
🔹 Solar, Wind, & Bioenergy Professionals
🔹 Financial Analysts & Sustainability Experts
🔹 Environmental & Sustainability Organizations
🔹 Government & Regulatory Agencies
🔹 Small & Medium Enterprises (SMEs) & Large Corporations in Energy
Ensure that your renewable energy projects are performing optimally, financially viable, and contributing to sustainable growth with the Renewable Resource KPI Dashboard in Excel. Monitor key performance indicators, track energy production, and make informed decisions to optimize your operations and maximize ROI.
Click here to read the Detailed blog post
Visit our YouTube channel to learn step-by-step video tutorials
Youtube.com/@PKAnExcelExpert


Reviews
There are no reviews yet.