Remote work has become a permanent part of modern business operations. Many organizations now operate with distributed teams where employees work from home, remote offices, or hybrid environments. While remote work offers flexibility, cost savings, and improved work-life balance, it also creates new management challenges.
Companies must still monitor productivity, collaboration, communication efficiency, and project delivery performance. Without a structured monitoring system, managers may struggle to evaluate how effectively remote teams perform. Data related to remote work often comes from multiple sources such as project management tools, communication platforms, time-tracking systems, and productivity reports. When this information is scattered across different tools, analyzing team performance becomes complicated.
To address this challenge, organizations increasingly adopt centralized KPI dashboards that transform operational data into meaningful insights. One powerful solution designed for this purpose is the Remote Work KPI Dashboard in Google Sheets.
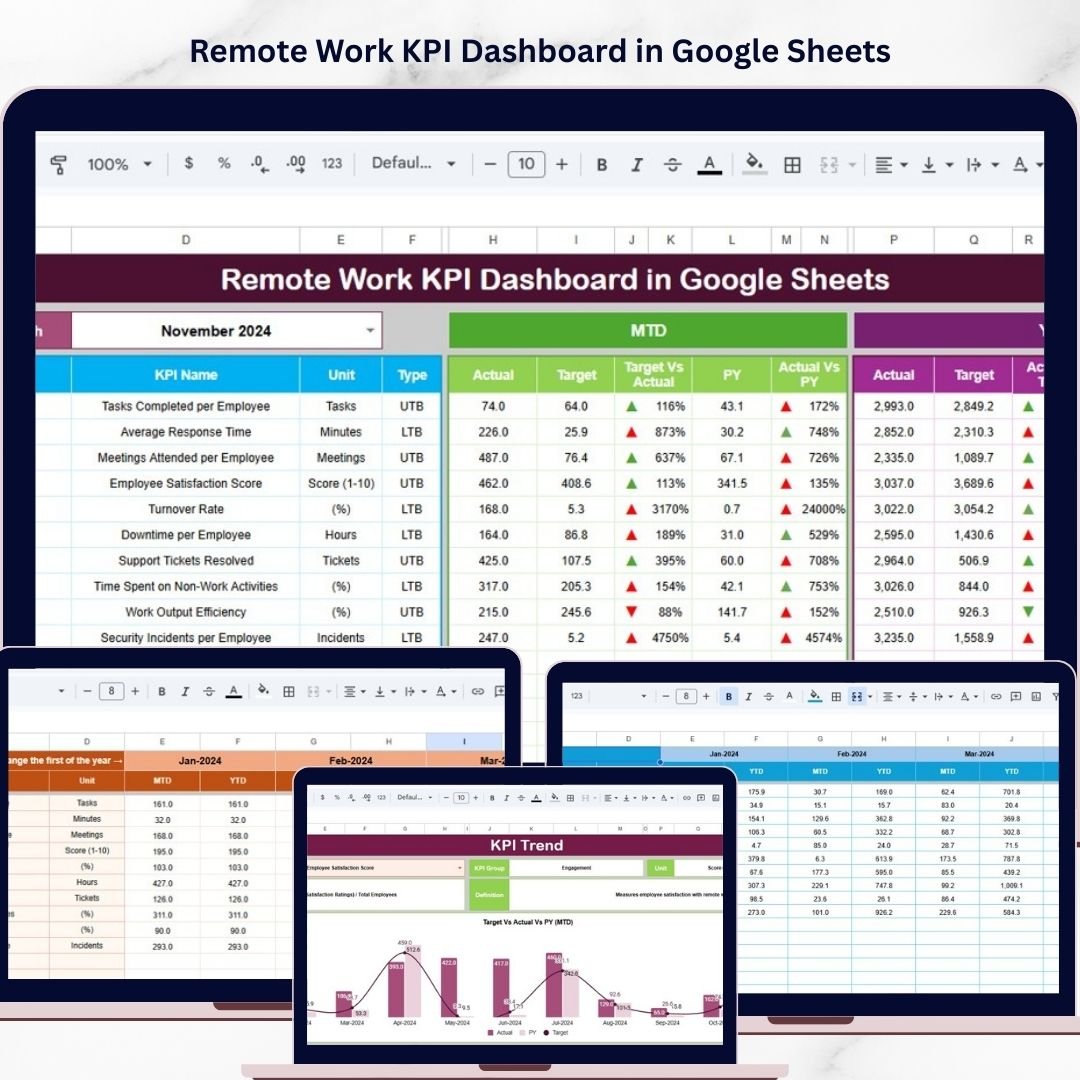
The Remote Work KPI Dashboard in Google Sheets is a structured analytics solution that allows organizations to track and evaluate remote work performance through interactive charts, KPI metrics, and automated calculations. Because Google Sheets supports real-time collaboration and automatic formula updates, the dashboard enables teams to monitor performance continuously without complex software.
This dashboard consolidates multiple remote work indicators into one centralized reporting system. Managers can track key metrics such as employee productivity, task completion rate, meeting attendance, communication response time, project delivery performance, work hour utilization, and employee engagement levels.
Instead of manually analyzing large spreadsheets, managers can use the dashboard to quickly evaluate performance through clear visual indicators. Conditional formatting, KPI comparisons, and automated calculations help leaders identify productivity trends and potential performance gaps instantly.
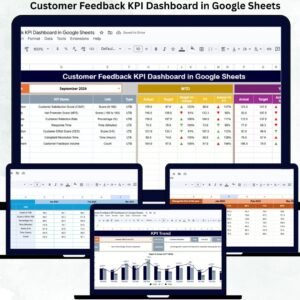
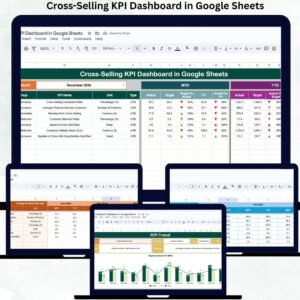
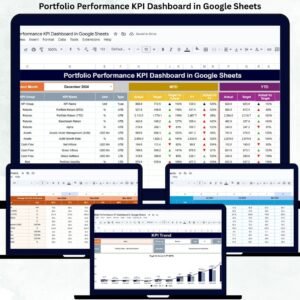
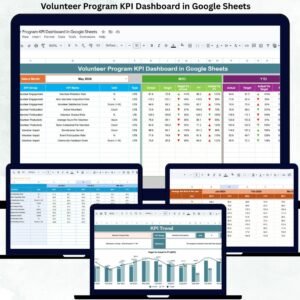
The template includes six well-structured worksheets designed to organize data efficiently. These worksheets include the Dashboard Sheet, KPI Trend Sheet, Actual Numbers Sheet, Target Sheet, Previous Year Numbers Sheet, and KPI Definition Sheet.
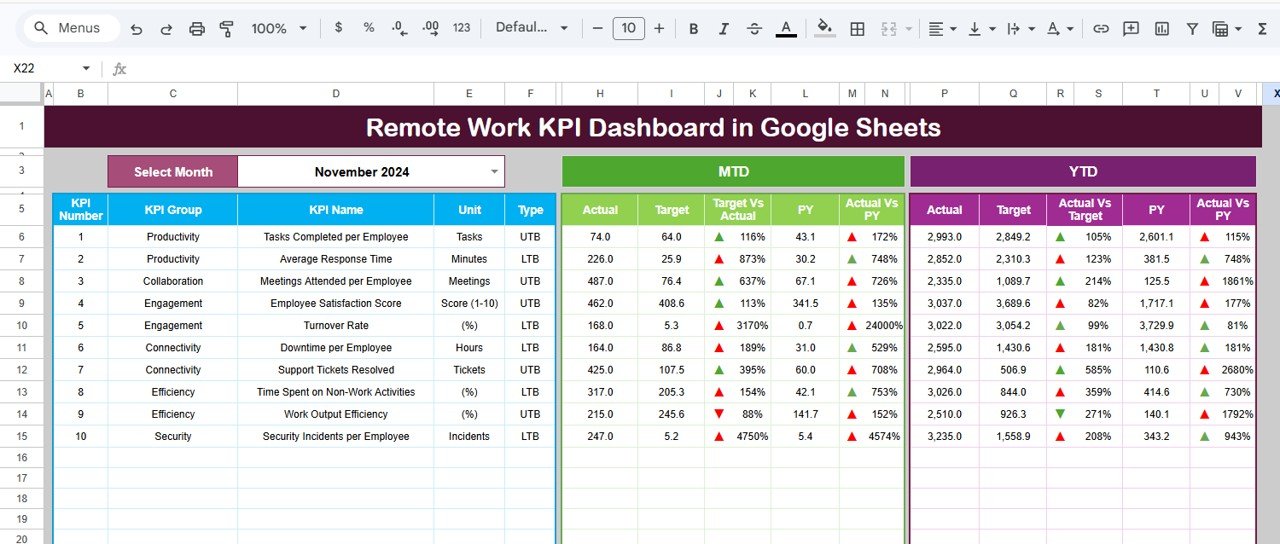
The Dashboard Sheet serves as the central performance monitoring page where managers can review key metrics for the selected month. Users can choose a specific month from the dropdown list, and the dashboard automatically updates all performance indicators for that period.
The dashboard tracks both Month-to-Date (MTD) and Year-to-Date (YTD) performance metrics. These values include actual performance, target values, and previous year comparisons. Conditional formatting uses green upward arrows and red downward arrows to visually highlight whether performance is improving or declining.
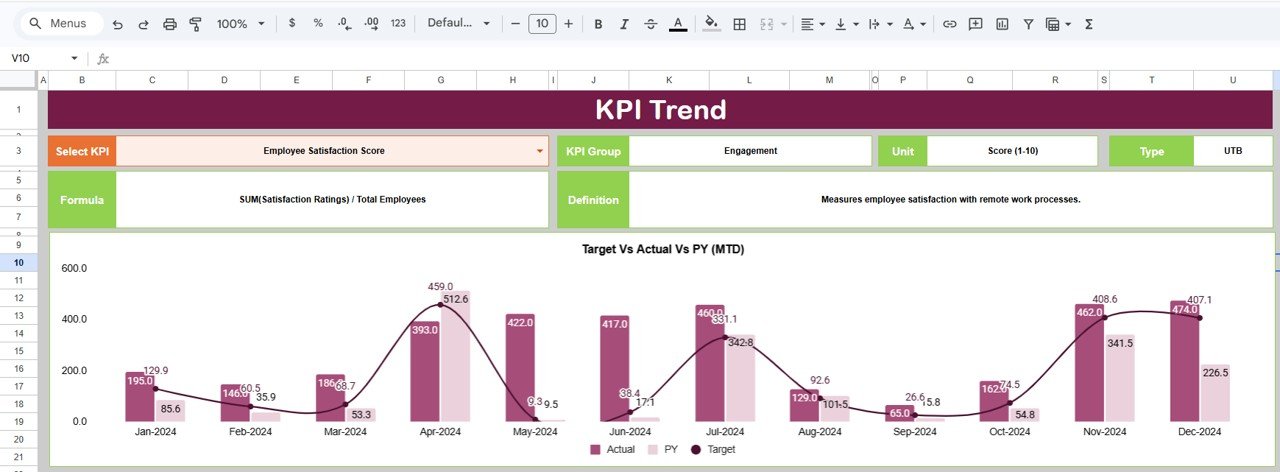
The KPI Trend Sheet allows managers to analyze the performance history of specific KPIs. By selecting a KPI from a dropdown list, users can review the KPI group, unit of measurement, formula, and detailed definition.
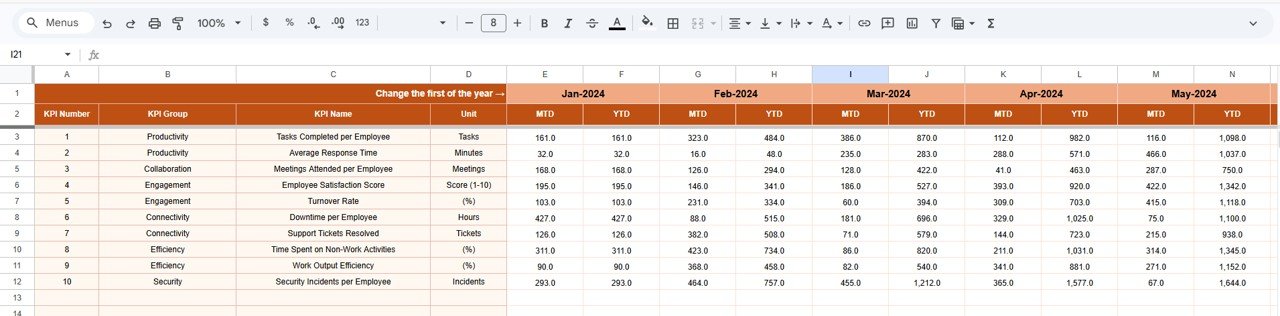
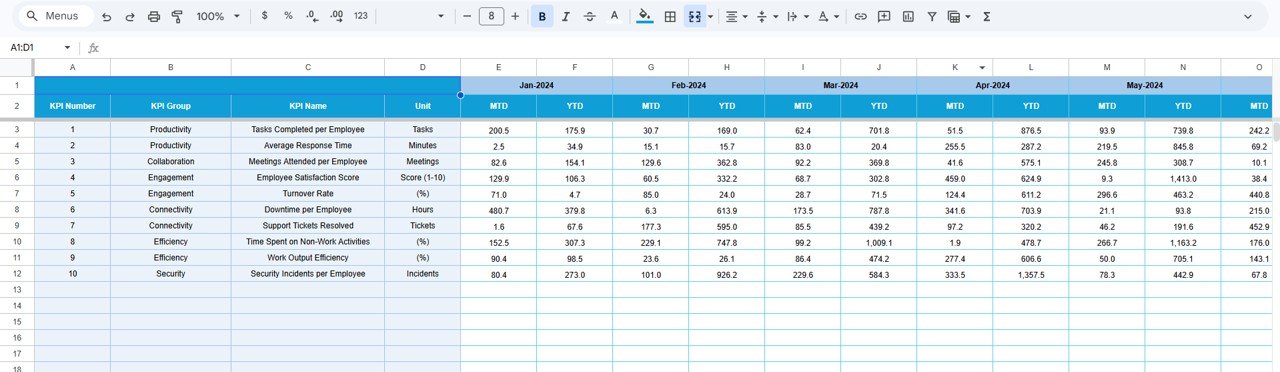
The Actual Numbers Sheet allows users to input real performance data for each KPI. This sheet records both MTD and YTD performance values for each reporting period.
The Target Sheet stores expected KPI targets for each month and year. By comparing actual results with targets, managers can quickly identify performance gaps and improvement opportunities.
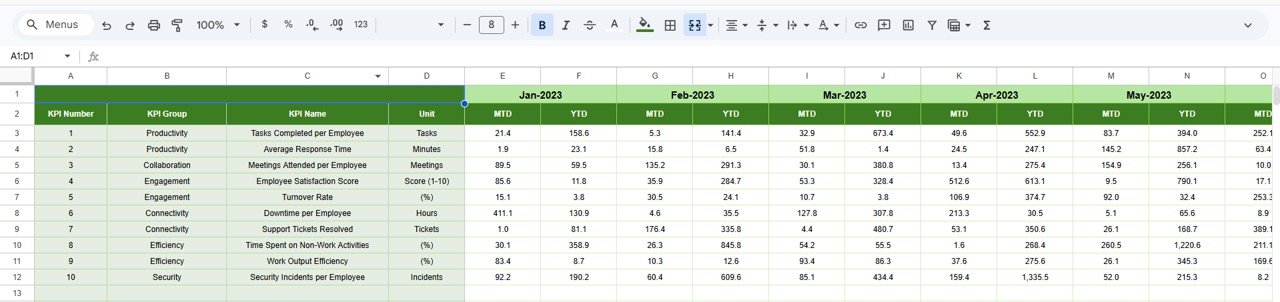
The Previous Year Numbers Sheet contains historical KPI values from the previous year. This data allows the dashboard to perform year-over-year performance comparisons.
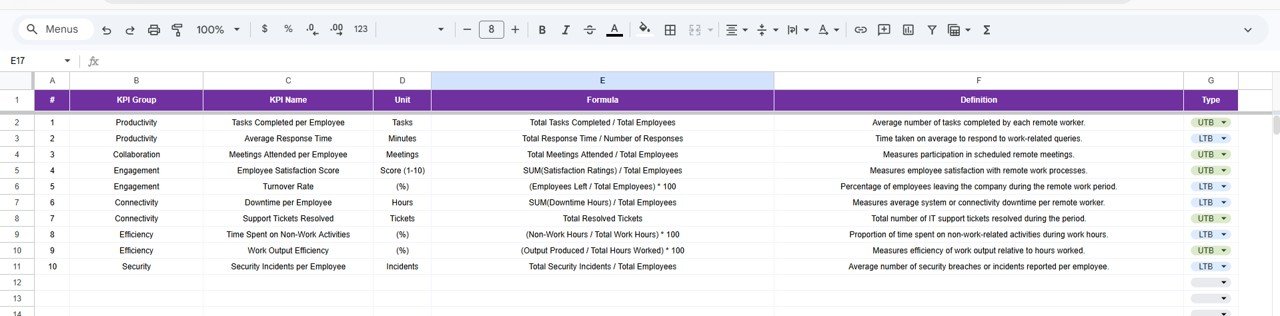
The KPI Definition Sheet acts as a documentation center for all KPIs used in the dashboard. It stores the KPI name, group, unit, formula, and detailed definition to ensure standardized reporting across teams.
Because Google Sheets enables real-time collaboration, multiple team members can update performance data simultaneously. As soon as new data is entered, the dashboard automatically refreshes calculations and charts.
This dashboard is ideal for organizations that manage remote teams, distributed workforces, hybrid workplaces, consulting teams, project-based organizations, or digital companies.
By transforming remote work data into structured analytics, the Remote Work KPI Dashboard in Google Sheets helps organizations improve productivity monitoring, strengthen accountability, and optimize remote work strategies.
🚀 Key Feature of Remote Work KPI Dashboard in Google Sheets
📊 Centralized Remote Work Analytics
Monitor all remote work KPIs in one interactive dashboard.
📈 MTD & YTD Performance Monitoring
Track both short-term and long-term performance metrics.
🧑💻 Employee Productivity Tracking
Measure productivity, task completion rates, and work efficiency.
📅 Monthly Performance Analysis
Analyze team performance for any selected month.
🎯 Target vs Actual KPI Comparison
Compare expected KPI targets with actual results.
📉 Previous Year Comparison
Evaluate year-over-year performance improvements.
🧠 KPI Documentation Center
Clearly define KPIs with formulas, definitions, and measurement units.
⚡ Automated Calculations
Google Sheets formulas update KPI metrics automatically.
🤝 Real-Time Collaboration
Multiple team members can update and analyze data simultaneously.
📊 Visual Performance Indicators
Conditional formatting with arrows highlights KPI trends instantly.
📦 What’s Inside the Remote Work KPI Dashboard in Google Sheets
This template includes six structured worksheets designed to manage KPI monitoring effectively.
📊 Dashboard Sheet
The Dashboard Sheet acts as the main performance monitoring interface.
Users can select a month from the dropdown menu in cell D3, which automatically updates all KPI metrics.
The dashboard displays:
• MTD Actual
• MTD Target
• MTD Previous Year
• Target vs Actual comparison
• Previous Year vs Actual comparison
It also shows YTD performance metrics with visual indicators.
📈 KPI Trend Sheet
The KPI Trend Sheet analyzes historical performance for specific KPIs.
Users can select a KPI from cell C3, and the sheet displays:
• KPI Group
• KPI Unit
• KPI Type (Upper the Better / Lower the Better)
• KPI Formula
• KPI Definition
📊 Actual Numbers Sheet
This sheet records the actual KPI performance values.
Users enter:
• Month-to-Date (MTD) data
• Year-to-Date (YTD) data
🎯 Target Sheet
The Target Sheet stores the expected KPI targets for each reporting period.
This enables performance comparisons between actual values and targets.
📉 Previous Year Numbers Sheet
This sheet stores historical KPI values from the previous year.
It allows the dashboard to calculate year-over-year performance trends.
📚 KPI Definition Sheet
The KPI Definition Sheet acts as the documentation center for KPIs.
It contains:
• KPI Name
• KPI Group
• KPI Unit
• KPI Formula
• KPI Definition
⚙️ How to Use the Remote Work KPI Dashboard
1️⃣ Enter KPI definitions in the KPI Definition Sheet.
2️⃣ Enter target values in the Target Sheet.
3️⃣ Record actual KPI performance in the Actual Numbers Sheet.
4️⃣ Add historical values in the Previous Year Numbers Sheet.
5️⃣ Select a month in the Dashboard Sheet to analyze results.
The dashboard automatically calculates and displays KPI insights.
👥 Who Can Benefit from This Dashboard
This dashboard is ideal for organizations managing distributed teams.
🏢 Remote-first companies
🧑💻 HR managers
📊 Operations managers
📈 Business analysts
🚀 Startup founders
👥 Team leaders
These professionals can use the dashboard to track productivity, monitor collaboration, and improve remote work strategies.
### Click hare to read the Detailed blog post
Watch the step-by-step video tutorial: